Car Week traffic challenges hit Monterey Peninsula – KSBW
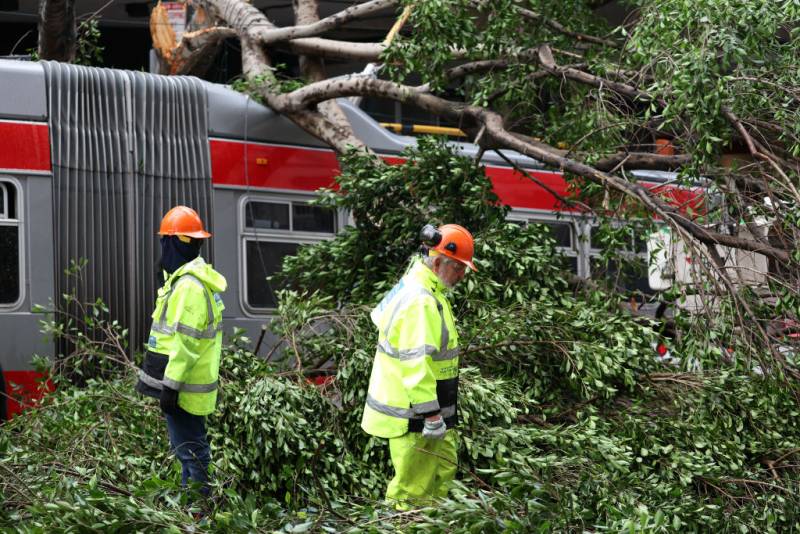
Report on Traffic Management and Sustainable Development during Monterey Car Week
1.0 Introduction
The annual Monterey Car Week event is causing a significant influx of visitors to the Monterey Peninsula, resulting in severe traffic congestion. This report analyzes the event’s impact on local infrastructure, community well-being, and public safety, evaluating the situation through the lens of the United Nations Sustainable Development Goals (SDGs).
2.0 Impact on Local Infrastructure and Community
The increased visitor volume has placed considerable strain on the region’s transportation infrastructure, particularly along the Highway 68 corridor between Salinas and Monterey. The effects on the local community are notable:
- Disruption to Daily Routines: Residents report needing to alter their schedules significantly, with commute times increasing from an average of 10 minutes to over 30 minutes.
- Adjustments for Work and School: To mitigate delays, community members, including local worker Aaron Chu, are departing 20-30 minutes earlier than usual for work and school commitments.
3.0 Official Response and Mitigation Strategies
In response to the congestion, a multi-agency effort is underway to manage traffic flow and ensure public safety. Key strategies and recommendations include:
- Promotion of Sustainable Transport: Officials and event staff are strongly recommending the use of shuttle bus services to reduce the number of individual vehicles on the road. This aligns with efforts to create more sustainable transport systems.
- Enhanced Law Enforcement Presence: The California Highway Patrol (CHP) and local police departments have increased patrols to monitor traffic and enforce regulations.
- Public Safety Campaign: Authorities are issuing public safety announcements, with Officer Saul Perez emphasizing the importance of avoiding distracted driving, driving under the influence, and excessive speed.
4.0 Analysis of Alignment with Sustainable Development Goals (SDGs)
The challenges and responses associated with Monterey Car Week directly relate to several key SDGs:
-
SDG 11: Sustainable Cities and Communities
The event highlights the critical need for resilient urban planning. The traffic congestion challenges Target 11.2 (provide access to safe, affordable, accessible, and sustainable transport systems). The promotion of shuttle services is a positive step towards this target, aiming to reduce the adverse environmental impact of urban activities (Target 11.6).
-
SDG 3: Good Health and Well-being
The heightened focus on road safety by law enforcement directly supports Target 3.6 (halve the number of global deaths and injuries from road traffic accidents). By cracking down on speeding and impaired driving, authorities are working to protect the well-being of both residents and visitors.
-
SDG 8: Decent Work and Economic Growth
While the event promotes tourism and local economic growth (Target 8.9), the resulting traffic congestion negatively impacts the “decent work” aspect for local commuters by creating stressful and elongated travel to their workplaces.
-
SDG 9: Industry, Innovation, and Infrastructure
The severe traffic demonstrates the vulnerability of existing infrastructure to surges in demand. This underscores the importance of investing in resilient and sustainable infrastructure (Target 9.1) that can support both daily life and large-scale tourism events.
Which SDGs are addressed or connected to the issues highlighted in the article?
-
SDG 3: Good Health and Well-being
This goal is relevant due to the article’s emphasis on road safety. The presence of California Highway Patrol and local officers cracking down on speeders, and the specific warnings from Officer Saul Perez to “not drive distracted, don’t drink and drive,” directly address the need to prevent traffic-related injuries and fatalities, which is a key aspect of ensuring healthy lives and promoting well-being.
-
SDG 11: Sustainable Cities and Communities
This goal is central to the article’s theme. The core issue of severe traffic congestion during Car Week impacts the efficiency and sustainability of the city’s transport infrastructure. The article discusses managing the influx of visitors, the need for residents to significantly alter their schedules, and the promotion of alternative transport like shuttle buses. These are all elements related to making urban areas more inclusive, safe, and sustainable, particularly concerning transportation systems.
What specific targets under those SDGs can be identified based on the article’s content?
-
Target 3.6: By 2020, halve the number of global deaths and injuries from road traffic accidents.
Although the 2020 deadline has passed, the objective remains a global priority. The article directly connects to this target through the actions of law enforcement. The statement that police are “cracking down on speeders” and the explicit advice to avoid distracted driving and drunk driving are direct measures aimed at preventing road traffic accidents and the resulting injuries and deaths.
-
Target 11.2: By 2030, provide access to safe, affordable, accessible and sustainable transport systems for all, improving road safety, notably by expanding public transport…
The article highlights several aspects of this target. The “improving road safety” component is covered by the police monitoring traffic and enforcing speed limits. The “sustainable transport systems” and “expanding public transport” components are addressed by the shuttle bus driver’s recommendation to “take a shuttle to some of the events.” This suggests the use of shared public transport as a solution to the congestion caused by individual cars, which is a key strategy for sustainable urban mobility.
Are there any indicators mentioned or implied in the article that can be used to measure progress towards the identified targets?
-
Indicator 3.6.1: Death rate due to road traffic injuries.
The article implies this indicator through its focus on preventative actions. While no statistics on accidents or fatalities are provided, the active monitoring by the California Highway Patrol and warnings against speeding, distracted driving, and drunk driving are all measures intended to reduce the death and injury rate from traffic incidents. The success of these measures would be tracked by this indicator.
-
Indicator 11.2.1: Proportion of population that has convenient access to public transport…
This indicator is relevant because the article explicitly mentions a public transport alternative. The shuttle bus driver’s advice to use shuttles points to the availability of a public transport system designed to manage the increased population during Car Week. The effectiveness of this system in providing “convenient access” is a measure of progress towards Target 11.2.
SDGs, Targets and Indicators Table
| SDGs | Targets | Indicators |
|---|---|---|
| SDG 3: Good Health and Well-being | Target 3.6: Halve the number of global deaths and injuries from road traffic accidents. | Indicator 3.6.1: Death rate due to road traffic injuries. |
| SDG 11: Sustainable Cities and Communities | Target 11.2: Provide access to safe, affordable, accessible and sustainable transport systems for all, improving road safety, notably by expanding public transport. | Indicator 11.2.1: Proportion of population that has convenient access to public transport. |
Source: ksbw.com

What is Your Reaction?
 Like
0
 Dislike
0
 Love
0
 Funny
0
 Angry
0
 Sad
0
Sad
0
 Wow
0
Wow
0


















_1.png?#)

