


;Resize=805#)


Map Shows Which U.S. States Have the Highest (and Lowest) Life Expectancy – Mental Floss
Report on Global and National Life Expectancy Disparities and Their Alignment with Sustainable Development Goals
Global Progress Towards SDG 3: A Century of Increased Longevity
An analysis of historical data reveals significant progress in global public health, directly aligning with the objectives of Sustainable Development Goal 3 (Good Health and Well-being). Global average life expectancy has more than doubled over the past century, increasing from 32 years in 1900 to over 73 years today. This advancement underscores successful global efforts to improve health outcomes. Notably, the first two decades of the 21st century alone saw an average increase of six years in global life expectancy, marking a substantial step towards ensuring healthy lives for all.
Challenges to SDG 10: Persistent Global and Regional Inequalities
Despite overall progress, significant disparities in life expectancy persist across and within regions, highlighting challenges to Sustainable Development Goal 10 (Reduced Inequalities). These variations indicate unequal access to healthcare, nutrition, and safe living conditions, which are fundamental to achieving SDG 3 universally. An examination of global data reveals a stark contrast between nations:
- Nations with Highest Life Expectancy: Monaco (86.5 years), San Marino (85.8 years), Hong Kong (85.6 years), and Japan (84.8 years).
- Nations with Lowest Life Expectancy: Nigeria (54.6 years), Chad (55.2 years), the Central African Republic (57.7 years), and South Sudan (57.7 years).
A pronounced regional divide is also evident. The average life expectancy in Oceania and Europe is approximately 79.1 years, whereas in Africa, it is significantly lower at 63.8 years. This gap represents a critical area for targeted interventions to reduce global health inequalities.
National-Level Analysis: Life Expectancy Disparities in the United States
The United States, with a national average life expectancy of 78.4 years, presents a case study of internal disparities that reflect the challenges outlined in SDG 10. An analysis based on U.S. Centers for Disease Control and Prevention (CDC) data shows considerable variation among states, indicating that the benefits of health advancements are not equally distributed. The nine-year gap between the highest and lowest-ranking states represents a profound inequality in health outcomes within a single nation.
States with Highest Life Expectancy
- Hawaii: 79.9 years
- Massachusetts: 79.6 years
- Connecticut: 79.2 years
- New York: 79.0 years
- New Jersey: 79.0 years
States with Lowest Life Expectancy
- Mississippi: 70.9 years
- West Virginia: 71.0 years
- Alabama: 72.0 years
- Louisiana: 72.2 years
- Kentucky: 72.3 years
A distinct geographic pattern emerges, with northeastern and coastal states generally reporting higher life expectancies than southern and inland states. The data for Mississippi, which shows a one-year decrease in the last five years, is particularly concerning and indicates a regression from the targets of SDG 3.
Methodological Framework
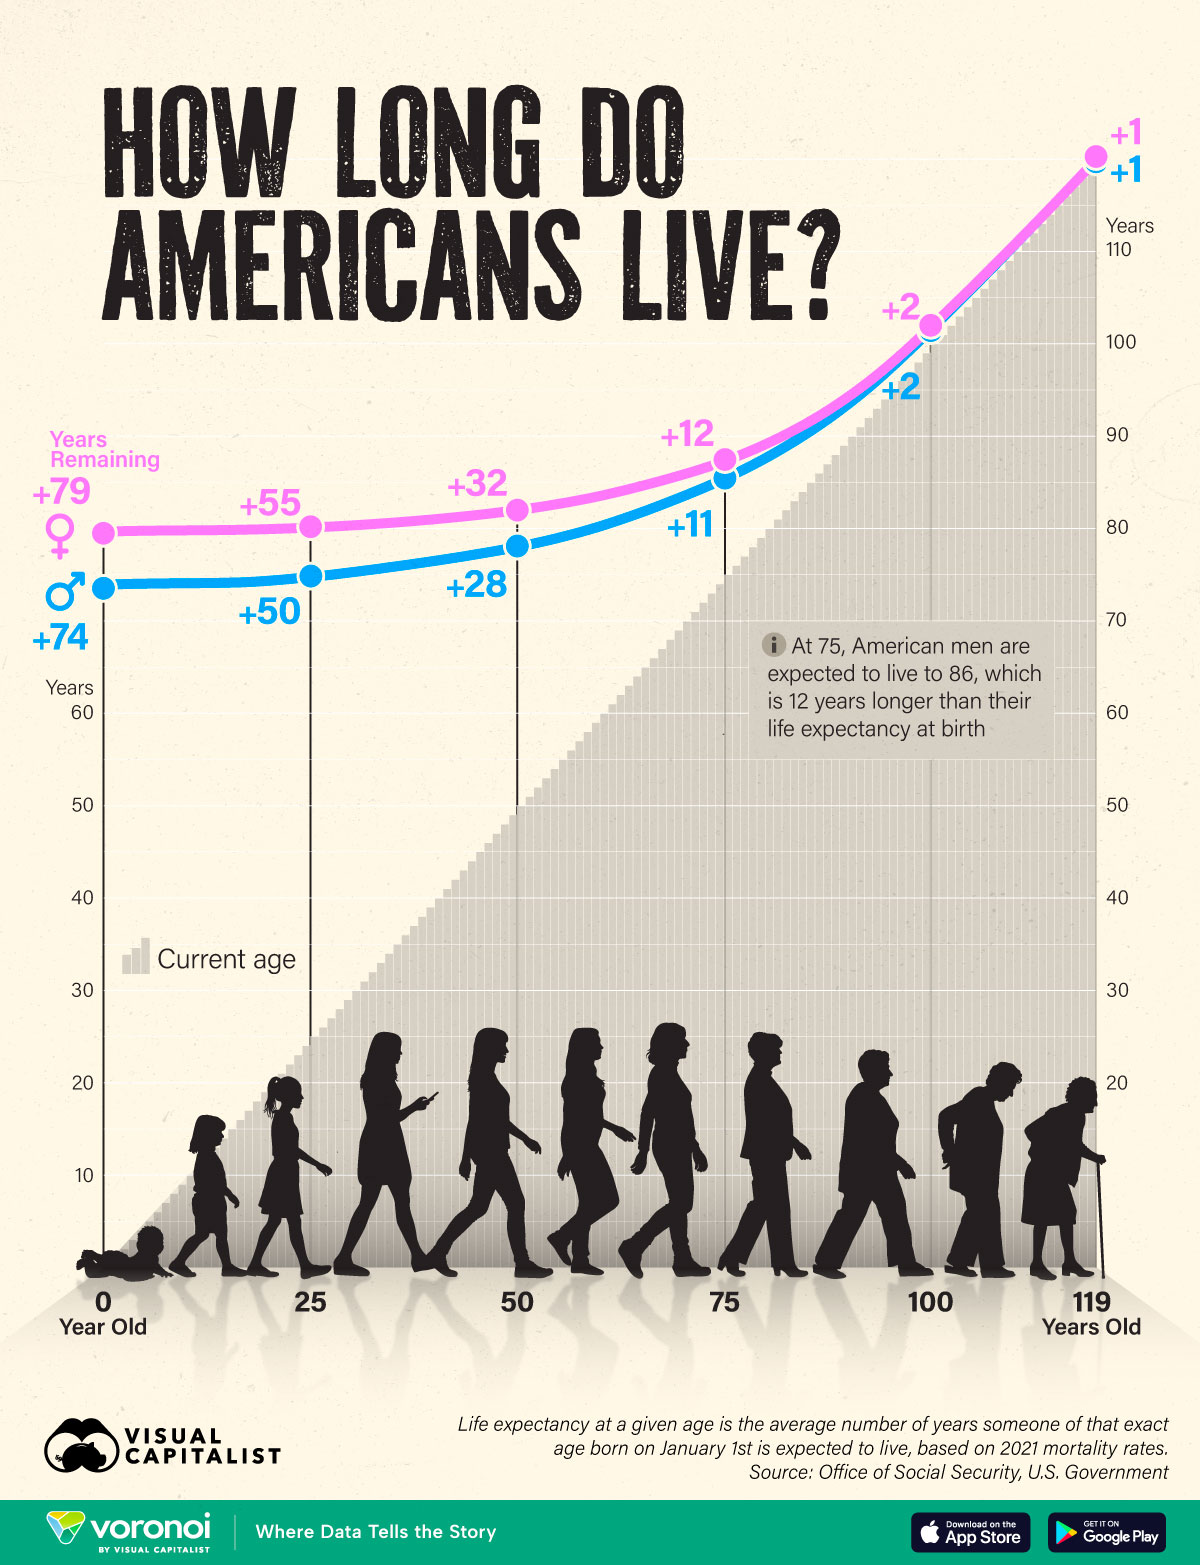
The life expectancy figures cited in this report are based on the CDC’s methodology, which calculates the metric from age-specific death rates recorded in a given year. It is important to note that life expectancy is a predictive statistic—the average number of years a person born today is expected to live—and is distinct from a region’s crude death rate or the average age at death of the current population.
State-Level Life Expectancy Data (Lowest to Highest)
| Rank | State | Life Expectancy |
|---|---|---|
| 51 | Mississippi | 70.9 |
| 50 | West Virginia | 71.0 |
| 49 | Alabama | 72.0 |
| 48 | Louisiana | 72.2 |
| 47 | Kentucky | 72.3 |
| 46 | Tennessee | 72.4 |
| 45 | Arkansas | 72.5 |
| 44 | Oklahoma | 72.7 |
| 43 | New Mexico | 73.0 |
| 42 | South Carolina | 73.5 |
| 41 | Georgia | 74.3 |
| 40 | Ohio | 74.5 |
| 39 | Alaska | 74.5 |
| 38 | Indiana | 74.6 |
| 37 | Missouri | 74.6 |
| 36 | North Carolina | 74.9 |
| 35 | Wyoming | 75.0 |
| 34 | Arizona | 75.0 |
| 33 | Nevada | 75.1 |
| 32 | District of Columbia | 75.3 |
| 31 | Texas | 75.4 |
| 30 | Michigan | 75.7 |
| 29 | Montana | 75.8 |
| 28 | Kansas | 76.0 |
| 27 | Florida | 76.1 |
| 26 | Delaware | 76.3 |
| 25 | Pennsylvania | 76.4 |
| 24 | South Dakota | 76.6 |
| 23 | Maine | 76.7 |
| 22 | Virginia | 76.8 |
| 21 | Illinois | 77.1 |
| 20 | Idaho | 77.2 |
| 19 | Maryland | 77.2 |
| 18 | Oregon | 77.4 |
| 17 | North Dakota | 77.6 |
| 16 | Iowa | 77.7 |
| 15 | Colorado | 77.7 |
| 14 | Wisconsin | 77.8 |
| 13 | Nebraska | 77.8 |
| 12 | Utah | 78.2 |
| 11 | Washington | 78.2 |
| 10 | California | 78.3 |
| 9 | Vermont | 78.4 |
| 8 | Rhode Island | 78.5 |
| 7 | New Hampshire | 78.5 |
| 6 | Minnesota | 78.8 |
| 5 | New Jersey | 79.0 |
| 4 | New York | 79.0 |
| 3 | Connecticut | 79.2 |
| 2 | Massachusetts | 79.6 |
| 1 | Hawaii | 79.9 |
SDGs Addressed in the Article
-
SDG 3: Good Health and Well-being
The article’s central theme is life expectancy, which is a primary indicator of a population’s overall health and well-being. It discusses the historical and current global average life expectancy, highlighting significant improvements over time. The text states, “Back in 1900, the average global life expectancy was just 32 years. Today, it’s more than doubled to just over 73 years.” This directly connects to the goal of ensuring healthy lives and promoting well-being for all at all ages.
-
SDG 10: Reduced Inequalities
The article extensively details the disparities in life expectancy among different countries, continents, and even within a single country (the United States). It explicitly points out that “Not all countries and regions fare quite as well as others.” By comparing countries with the highest life expectancies like Monaco (86.5 years) to those with the lowest like Nigeria (54.6 years), and by showing the “distinct coastal vs. inland divide” in the U.S., the article underscores the issue of inequality in health outcomes, which is a core concern of SDG 10.
Specific SDG Targets Identified
-
Target 3.4: By 2030, reduce by one-third premature mortality from non-communicable diseases through prevention and treatment and promote mental health and well-being.
While the article does not specify the causes of death, life expectancy is a direct reflection of mortality rates. A lower life expectancy, as seen in states like Mississippi (70.9 years), implies a higher rate of premature mortality compared to states like Hawaii (79.9 years). The overall discussion of increasing life expectancy aligns with the ambition of this target to reduce premature deaths and allow people to live longer, healthier lives.
-
Target 10.2: By 2030, empower and promote the social, economic and political inclusion of all, irrespective of age, sex, disability, race, ethnicity, origin, religion or economic or other status.
The data presented in the article demonstrates a clear lack of equal health outcomes, which is a key dimension of social inclusion. The article highlights significant disparities between continents (“Oceania has recently joined Europe as the continent with the highest average life expectancy (79.1), while in Africa, the figure is 63.8.”) and between states (“the state with the lowest life expectancy is Mississippi… almost a full decade behind Hawaii”). These disparities point to underlying inequalities that prevent all populations from achieving the same level of well-being, which this target aims to eliminate.
Indicators Mentioned or Implied
-
Life Expectancy at Birth
This is the most prominent indicator used throughout the article to measure health outcomes. Specific data points are provided at global, continental, national, and sub-national levels. Examples include the global average (73 years), country-specific figures (Japan, 84.8; Chad, 55.2), and state-level data (Hawaii, 79.9; Mississippi, 70.9). This metric is a direct way to measure progress towards ensuring good health.
-
Age-specific death rates
The article explicitly mentions how the primary indicator is calculated: “life expectancy statistics [are] based on the age-specific death rates reported in a particular year.” This is a foundational statistical indicator used to assess mortality patterns within a population and is crucial for tracking progress on reducing premature mortality.
-
Disparity in Life Expectancy between geographic regions
The article implicitly uses the gap in life expectancy as an indicator of inequality. The analysis highlights the difference between the highest and lowest performing countries (a gap of nearly 32 years between Monaco and Nigeria) and U.S. states (a 9-year gap between Hawaii and Mississippi). The “north vs. south” divide mentioned in the U.S. context also serves as a qualitative indicator of regional inequality. Tracking this gap over time would measure progress towards SDG 10.
SDGs, Targets, and Indicators Analysis
| SDGs | Targets | Indicators |
|---|---|---|
| SDG 3: Good Health and Well-being Ensure healthy lives and promote well-being for all at all ages. |
Target 3.4: Reduce premature mortality from non-communicable diseases. |
|
| SDG 10: Reduced Inequalities Reduce inequality within and among countries. |
Target 10.2: Promote social, economic, and political inclusion of all. |
|
Source: mentalfloss.com

What is Your Reaction?
 Like
0
Like
0
 Dislike
0
Dislike
0
 Love
0
Love
0
 Funny
0
Funny
0
 Angry
0
Angry
0
 Sad
0
Sad
0
 Wow
0
Wow
0