


;Resize=805#)


The 10 worst U.S. cities for jobs and earning potential, according to new report – CNBC

Economic Disparities in U.S. Cities: An Analysis Through the Lens of Sustainable Development Goals
Introduction
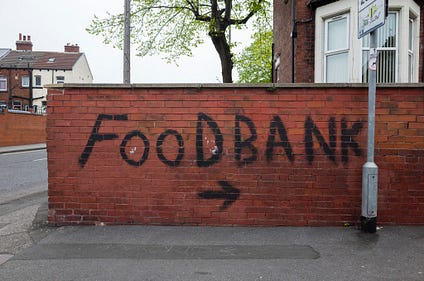
A recent analysis of the 100 largest U.S. cities reveals significant economic disparities, with several urban centers facing substantial challenges that impede progress toward key Sustainable Development Goals (SDGs). While some cities demonstrate robust economic growth, others are characterized by low employment and declining wages, highlighting critical issues related to SDG 8 (Decent Work and Economic Growth), SDG 1 (No Poverty), SDG 10 (Reduced Inequalities), and SDG 11 (Sustainable Cities and Communities).
Methodology of Urban Economic Assessment
The ranking, conducted by Checkr, utilized federal data to evaluate cities on two primary composite scores: employment opportunity and earning potential. The methodology incorporated several key indicators:
- Data Sources: U.S. Bureau of Labor Statistics, U.S. Census Bureau, and the Bureau of Economic Analysis.
- Employment Opportunity Metrics:
- Unemployment rate
- Labor force growth and size
- Percentage of available jobs
- Earning Potential Metrics:
- Real per capita personal income
- 10-year income growth trajectory
- Percentage of households with annual earnings over $200,000
Cities with Lowest Economic Opportunity and Earning Potential
The following ten U.S. cities were identified as having the most significant challenges in providing job opportunities and high earning potential, indicating a struggle to meet fundamental targets for sustainable urban development.
- Bakersfield, CA
- Scranton, PA
- McAllen, TX
- Fresno, CA
- Memphis, TN
- Jackson, MS
- Rochester, NY
- Toledo, OH
- Augusta, GA
- Spokane, WA
Alignment with Sustainable Development Goals
SDG 8: Decent Work and Economic Growth
The economic conditions in the lowest-ranked cities directly conflict with the objectives of SDG 8, which aims to promote sustained, inclusive, and sustainable economic growth, full and productive employment, and decent work for all.
- High Unemployment: A primary concern is the failure to achieve full employment. The Bakersfield and Fresno metro areas report exceptionally high unemployment rates of 9.6% and 8.5%, respectively. McAllen (6.4%) and Jackson (6.2%) also significantly exceed the national average, indicating a severe lack of decent work opportunities.
- Stagnant Job Markets: The report notes that these cities struggle with slow job growth and an inability to generate new employment, limiting opportunities for economic advancement and urban vitality.
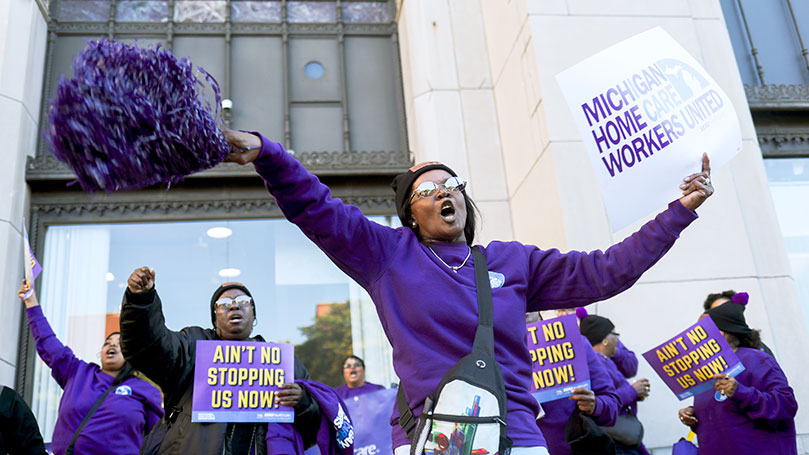
- Low Wage Growth: Earning potential is severely constrained, with wages often falling below the national average. This undermines the “decent work” aspect of SDG 8, as employment does not guarantee economic security.
SDG 9: Industry, Innovation, and Infrastructure
The industrial base of these cities presents a major barrier to sustainable development, as outlined in SDG 9, which calls for building resilient infrastructure, promoting inclusive and sustainable industrialization, and fostering innovation.
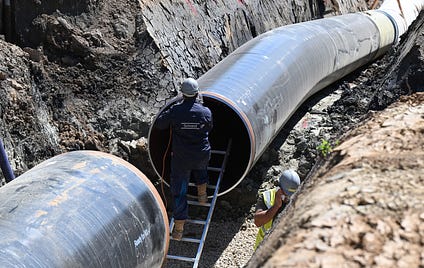
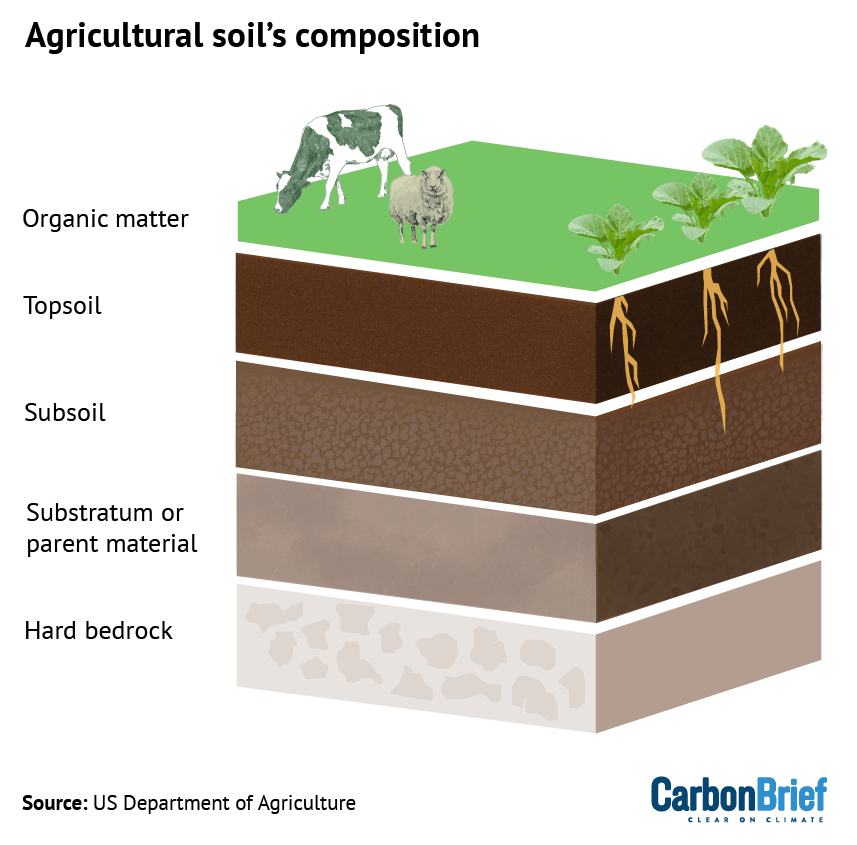
- Reliance on Declining Industries: Cities like Bakersfield and Fresno are heavily dependent on traditional agriculture and energy sectors. Similarly, “Rust Belt” cities such as Scranton and Rochester continue to face the long-term effects of deindustrialization and manufacturing decline.
- Lack of Diversification and Innovation: An overreliance on sectors that often require on-site labor limits economic resilience and restricts opportunities for a diverse, modern workforce, including remote workers. This points to a critical need for investment in high-growth, innovative industries.
SDG 1 & SDG 10: No Poverty and Reduced Inequalities
The findings underscore significant challenges in achieving SDG 1 (No Poverty) and SDG 10 (Reduced Inequalities). The economic struggles in these cities perpetuate cycles of poverty and exacerbate economic disparities within the nation.
- Poverty and Low Income: The combination of low median wages, high unemployment, and elevated poverty rates directly contravenes the goal of eradicating poverty.
- Economic Inequality: The stark contrast between thriving cities like Raleigh and Nashville and the struggling cities on this list highlights a growing intra-country inequality. The limited earning potential and low percentage of high-income households in these areas signify a lack of economic mobility and a widening wealth gap.
SDG 11: Sustainable Cities and Communities
Ultimately, the economic deficiencies impact the ability to create inclusive, safe, resilient, and sustainable cities as envisioned by SDG 11.
- Inability to Attract and Retain Talent: A stagnant job market and low wages make it difficult for these cities to attract and retain a skilled workforce, which is essential for long-term growth and community development.
- Limited Economic Resilience: Without new business investment and job creation, these urban communities lack the economic resilience needed to adapt to future challenges, thereby compromising their overall sustainability.
Analysis of Sustainable Development Goals in the Article
1. Which SDGs are addressed or connected to the issues highlighted in the article?
- SDG 1: No Poverty
The article connects to this goal by mentioning that the lowest-ranked cities face challenges that include “high unemployment and poverty rates.” This directly addresses the goal of eradicating poverty in all its forms.
- SDG 8: Decent Work and Economic Growth
This is the central theme of the article. The entire analysis revolves around “employment opportunity,” “earning potential,” “unemployment rate,” “job growth,” and “declining wages.” The article contrasts cities with thriving job markets against those with “stagnant” employment and overreliance on declining industries, which is the core focus of SDG 8.
- SDG 10: Reduced Inequalities
The article highlights the economic disparities between different U.S. cities, such as the contrast between “thriving job markets” in Raleigh and Nashville and the struggles in cities like Bakersfield and Scranton. This focus on the unequal distribution of economic opportunities and income potential within a country relates directly to reducing inequalities.
- SDG 11: Sustainable Cities and Communities
The article’s analysis is framed around the economic sustainability of the “100 largest U.S. cities.” It discusses factors that make urban centers struggle, such as the inability to “attract and retain talent” or generate “new jobs,” which are critical for creating inclusive, safe, resilient, and sustainable cities.
2. What specific targets under those SDGs can be identified based on the article’s content?
- Under SDG 1: No Poverty
- Target 1.2: By 2030, reduce at least by half the proportion of men, women and children of all ages living in poverty in all its dimensions according to national definitions. The article’s mention of “high poverty rates” as a key challenge in struggling U.S. cities directly aligns with this target.
- Under SDG 8: Decent Work and Economic Growth
- Target 8.2: Achieve higher levels of economic productivity through diversification… including through a focus on high-value added… sectors. The article points out that cities like Bakersfield and Fresno are “largely reliant on the agriculture and energy sectors,” while Rust Belt cities suffer from “industrial and manufacturing declines.” This lack of diversification is presented as a primary cause of their economic struggles, making this target highly relevant.
- Target 8.5: By 2030, achieve full and productive employment and decent work for all… and equal pay for work of equal value. The article’s core focus is on the lack of “employment opportunity” and high “unemployment rates” in several cities. The mention that it is “even more difficult to get paid the national average” speaks to the challenge of achieving decent work and pay.
- Under SDG 10: Reduced Inequalities
- Target 10.1: By 2030, progressively achieve and sustain income growth of the bottom 40 per cent of the population at a rate higher than the national average. The article discusses “declining wages,” “low median wages,” and low “earning potential,” which are issues that disproportionately affect lower-income populations and prevent the achievement of this target.
- Under SDG 11: Sustainable Cities and Communities
- Target 11.a: Support positive economic… links between urban, peri-urban and rural areas by strengthening national and regional development planning. The article’s city-level analysis of economic failure (e.g., “There’s not a ton of new jobs being generated”) underscores a failure in regional economic planning to create resilient and prosperous urban centers.
3. Are there any indicators mentioned or implied in the article that can be used to measure progress towards the identified targets?
- For SDG 1 (No Poverty)
- Poverty Rate (Implied for Indicator 1.2.1): The article explicitly states that “high … poverty rates” are a key economic challenge in the lowest-ranked cities.
- For SDG 8 (Decent Work and Economic Growth)
- Unemployment Rate (Indicator 8.5.2): This is a primary indicator used throughout the article. Specific figures are provided, such as the national average of 4.2% and the rates in Bakersfield (9.6%), Fresno (8.5%), McAllen (6.4%), and Jackson (6.2%).
- Real Per Capita Personal Income (Proxy for Indicator 8.2.1): The article states that the study’s “earning potential score is sourced from the city’s real per capita personal income.” This is a direct measure of economic growth per person.
- 10-Year Income Growth (Proxy for Indicator 8.2.1): This metric, used in the Checkr study, directly measures the rate of economic growth over time.
- Labor Force Growth: Mentioned as a component of the “employment opportunity score,” this indicates the dynamism of the local economy.
- Percentage of Jobs Open: Also part of the “employment opportunity score,” this measures the availability of work.
- For SDG 10 (Reduced Inequalities)
- Percentage of Households Earning More Than $200,000 (Proxy for income distribution): This metric, used to calculate the “earning potential score,” serves as an indicator of income concentration at the top, which is relevant for assessing inequality.
- Real Per Capita Personal Income (Proxy for Indicator 10.1.1): When compared across different cities as done in the article, this metric highlights income inequality between geographic regions.
Summary Table: SDGs, Targets, and Indicators
| SDGs | Targets | Indicators Identified in the Article |
|---|---|---|
| SDG 1: No Poverty | 1.2: Reduce poverty in all its dimensions according to national definitions. | Poverty rates (mentioned as a key challenge). |
| SDG 8: Decent Work and Economic Growth | 8.2: Achieve higher levels of economic productivity through diversification. | Overreliance on declining industries (e.g., agriculture, manufacturing) vs. high-growth industries. |
| 8.5: Achieve full and productive employment and decent work for all. | Unemployment rate (specific figures cited for Bakersfield, Fresno, McAllen, Jackson). | |
| Labor force growth and percentage of jobs open. | ||
| Wages (mentioned as “declining wages,” “low median wages,” and difficulty to get “paid the national average”). | ||
| SDG 10: Reduced Inequalities | 10.1: Sustain income growth of the bottom 40 per cent. | Real per capita personal income and 10-year income growth (used to compare cities, highlighting inequality). |
| Percentage of households earning more than $200,000 (indicates income distribution). | ||
| SDG 11: Sustainable Cities and Communities | 11.a: Support positive economic links by strengthening regional development planning. | Metrics of urban economic struggle: slow job growth, inability to attract and retain talent, lack of new business generation. |
Source: cnbc.com

What is Your Reaction?
 Like
0
Like
0
 Dislike
0
Dislike
0
 Love
0
Love
0
 Funny
0
Funny
0
 Angry
0
Angry
0
 Sad
0
Sad
0
 Wow
0
Wow
0