


Extreme Heat Streaks – Climate Central
Report on the Increasing Frequency of Extreme Heat Streaks and Implications for Sustainable Development Goals
Executive Summary
An analysis of temperature data from 1970 to 2024 across 247 U.S. cities reveals a significant increase in the frequency of multi-day extreme heat streaks. These events, fueled by climate change, pose a direct threat to public health, urban infrastructure, and economic stability, thereby challenging the progress of several key Sustainable Development Goals (SDGs). The findings underscore the urgent need for integrated strategies that address climate change (SDG 13), protect human health (SDG 3), and build resilient communities (SDG 11).
Analysis of Extreme Heat Trends in U.S. Cities (1970-2024)
Key Findings
- The annual number of extreme heat streaks, defined as three or more consecutive days with temperatures above the local 90th percentile, has increased in 198 of the 247 cities analyzed (80%).
- On average, these 198 cities now experience two additional extreme heat streaks per year compared to the early 1970s.
- The most significant increases were observed in cities across the Southwest, Northeast, Ohio Valley, and Southeast.
- The escalation in the frequency and intensity of these heat events is a direct consequence of global warming driven by heat-trapping pollution.
Impacts on Sustainable Development Goals (SDGs)
SDG 3: Good Health and Well-being
The rise in extreme heat directly undermines public health, creating significant obstacles to achieving SDG 3. The primary impacts include:
- Increased Morbidity and Mortality: Prolonged exposure to extreme heat elevates the risk of heat-related illnesses such as heat exhaustion and fatal heat stroke. In 2023, a record 2,325 heat-related deaths were recorded in the U.S., a figure considered an undercount.
- Degraded Air Quality: Heat streaks trap pollutants and facilitate the formation of ground-level ozone, exacerbating respiratory conditions and threatening the health of the general population.
- Disproportionate Risk for Vulnerable Groups: Children, older adults, pregnant people, and individuals with pre-existing health conditions face a heightened risk of severe health complications from extreme heat, amplifying health inequalities.
SDG 11: Sustainable Cities and Communities
The increasing frequency of heat streaks places immense pressure on urban environments, jeopardizing the goal of creating safe, resilient, and sustainable cities. Key challenges include:
- Infrastructure Strain: Surges in cooling demand during heat waves strain electrical grids, increasing the likelihood of power outages that can disable critical services and endanger vulnerable residents.
- Reduced Livability: Worsened air quality and the direct thermal stress of extreme heat diminish the quality of urban life and compromise public safety. This necessitates urgent adaptation and resilience planning in urban development to protect citizens, directly aligning with Target 11.5 (reduce the impact of disasters) and 11.B (implement integrated policies for resilience).
SDG 13: Climate Action
The data provides unequivocal evidence of the localized impacts of global climate change. The trend of increasing heat streaks serves as a critical indicator of a warming planet, reinforcing the urgent need for comprehensive climate action as mandated by SDG 13. These events are not random weather occurrences but a direct result of anthropogenic heat-trapping pollution, highlighting the necessity of immediate and sustained mitigation efforts.
SDG 7: Affordable and Clean Energy & SDG 8: Decent Work and Economic Growth
The consequences of extreme heat extend to energy systems and economic productivity, impacting both SDG 7 and SDG 8.
- Energy Security (SDG 7): The strain on power grids from sustained high demand for cooling challenges the reliability and stability of energy infrastructure, underscoring the need for resilient and sustainable energy solutions.
- Worker Safety and Productivity (SDG 8): Weather-exposed workers, particularly in agriculture and construction, face severe health and safety hazards from humid heat. This leads to increased rates of illness and injury and results in lost labor hours and wages, undermining the goal of ensuring safe working environments and sustained economic productivity.
Methodology
Data and Definitions
The analysis utilized daily maximum temperature data from the Applied Climate Information System (ACIS) for 247 U.S. locations from 1970 to 2024. An “extreme heat streak” was defined as a period of three or more consecutive days where the maximum temperature exceeded the 90th percentile for that date, based on the 1991-2020 climate normal period. The change in the annual frequency of these streaks was calculated using linear regression.
Resources for Monitoring and Action
Public Health and Climate Monitoring Tools
To support public and policy responses aligned with the SDGs, several tools are available for monitoring and assessing heat-related risks:
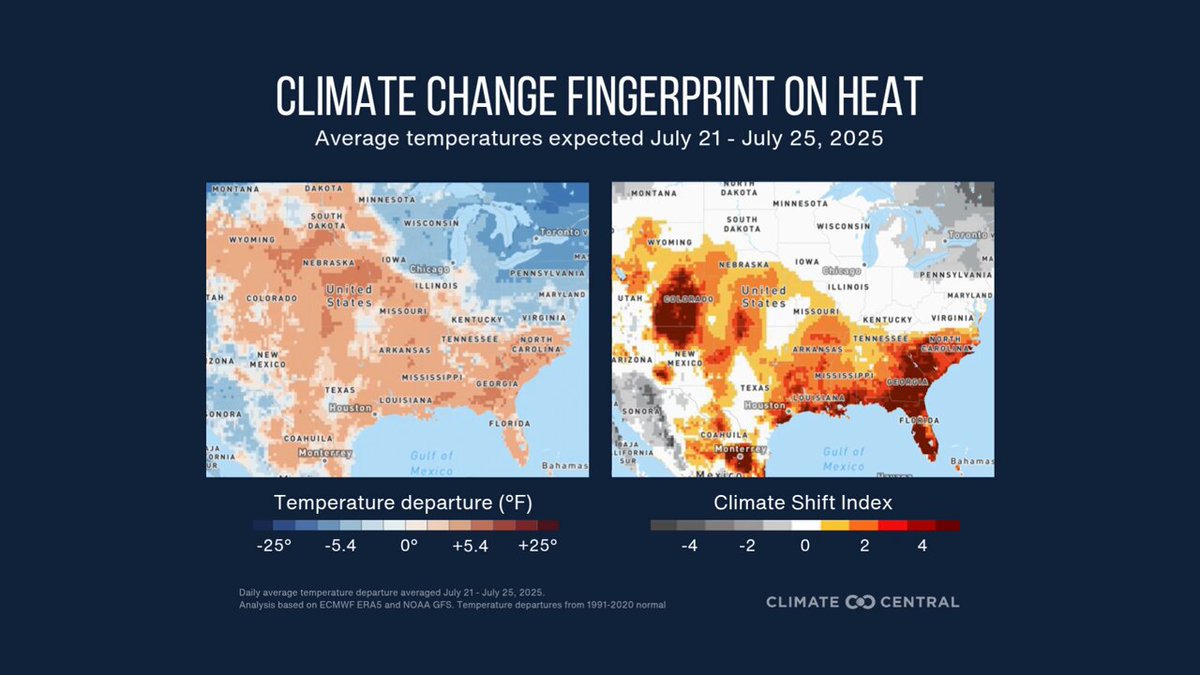
- Climate Shift Index (CSI): This tool from Climate Central quantifies the influence of climate change on daily temperatures in real-time, providing a direct link between local weather and global warming.
- HEAT.gov: A portal from the National Integrated Heat Health Information System that provides information and tools, including the HeatRisk forecast map, to support heat resilience planning.
- CDC Heat and Health Tracker: This tool maps daily rates of heat-related illnesses across the United States, offering critical data for public health interventions.
1. Which SDGs are addressed or connected to the issues highlighted in the article?
- SDG 3: Good Health and Well-being: The article extensively discusses the health impacts of extreme heat, such as heat-related illnesses and deaths, and the effects of worsened air quality on respiratory health.
- SDG 7: Affordable and Clean Energy: The article connects heat streaks to strains on the power grid and subsequent power outages, which affects the reliability of energy services.
- SDG 11: Sustainable Cities and Communities: The analysis is focused on 247 U.S. cities and highlights risks to urban populations, including health crises, infrastructure failure (power grid), and deteriorating air quality.
- SDG 13: Climate Action: The core theme of the article is that “heat-trapping pollution warms the planet,” leading to an increase in the frequency and intensity of extreme heat events, which is a direct consequence of climate change.
2. What specific targets under those SDGs can be identified based on the article’s content?
SDG 3: Good Health and Well-being
- Target 3.9: By 2030, substantially reduce the number of deaths and illnesses from hazardous chemicals and air, water and soil pollution and contamination. The article connects to this target by stating that heat streaks “worsen air quality by trapping harmful pollutants in the air we breathe and fueling the formation of ground-level ozone, worsening health issues for people with respiratory illness.”
- Target 3.d: Strengthen the capacity of all countries… for early warning, risk reduction and management of national and global health risks. This is relevant as the article identifies extreme heat as the “deadliest type of weather in the U.S.” and a growing global health risk. It also mentions tools like the CDC’s “Heat and Health Tracker” which serve as early warning and risk management systems.
SDG 7: Affordable and Clean Energy
- Target 7.1: By 2030, ensure universal access to affordable, reliable and modern energy services. The article highlights a threat to the reliability of energy services by stating that high cooling demand during heat streaks “can strain the grid, leading to power outages that put vulnerable people at higher risk.”
SDG 11: Sustainable Cities and Communities
- Target 11.5: By 2030, significantly reduce the number of deaths and the number of people affected… caused by disasters… with a focus on protecting the poor and people in vulnerable situations. The article identifies extreme heat as a deadly weather-related disaster, noting it is the “leading cause of weather-related deaths in the U.S.” and that “a record 2,325 people died from heat in the U.S. alone” in 2023. It also specifies vulnerable groups like children, pregnant people, and the elderly.
- Target 11.6: By 2030, reduce the adverse per capita environmental impact of cities, including by paying special attention to air quality. The article directly addresses this by explaining how heat streaks “worsen air quality” within cities.
SDG 13: Climate Action
- Target 13.1: Strengthen resilience and adaptive capacity to climate-related hazards and natural disasters in all countries. The entire article is about the increasing frequency of a climate-related hazard (“extreme heat streaks”), which necessitates stronger resilience and adaptation. The analysis shows that “the annual number of extreme heat streaks increased in 198 (80%) of the 247 cities analyzed.”
- Target 13.3: Improve education, awareness-raising and human and institutional capacity on climate change… impact reduction and early warning. The article itself is a form of awareness-raising. It also promotes tools like the “Climate Shift Index” and “HEAT.gov” which are designed to improve capacity for impact reduction and early warning.
3. Are there any indicators mentioned or implied in the article that can be used to measure progress towards the identified targets?
SDG 3: Good Health and Well-being
- Indicator for Target 3.9: The article implies the measurement of air quality by mentioning that heat streaks “worsen air quality by trapping harmful pollutants… and fueling the formation of ground-level ozone.” This suggests tracking annual mean levels of pollutants like ground-level ozone in cities.
- Indicator for Target 3.d: The article provides a direct measure related to mortality rates from disasters. It states, “In 2023, a record 2,325 people died from heat in the U.S. alone.” This number can be used to calculate the mortality rate attributed to heat disasters. The mention of “heat-related illness” also points to tracking morbidity rates.
SDG 7: Affordable and Clean Energy
- Indicator for Target 7.1: The article implies an indicator for energy reliability by stating that heat streaks can “lead to power outages.” The frequency and duration of these power outages during extreme heat events would be a direct indicator of grid reliability.
SDG 11: Sustainable Cities and Communities
- Indicator for Target 11.5 (Indicator 11.5.1): The article provides data for the “Number of deaths… attributed to disasters.” The figure “2,325 people died from heat in the U.S. alone” in 2023 is a direct measure for this indicator.
- Indicator for Target 11.6 (Indicator 11.6.2): The mention of worsened air quality and the formation of “ground-level ozone” implies the use of the “Annual mean levels of fine particulate matter… in cities” as a relevant indicator.
SDG 13: Climate Action
- Indicator for Target 13.1 (Indicator 13.1.1): The number of deaths attributed to heat disasters (“2,325 people died from heat”) serves as a direct indicator. Furthermore, the article’s central analysis on the “changing frequency of extreme heat streaks” provides a measure of the occurrence of climate-related hazards. It states that on average, the analyzed cities “now experience two more extreme heat streaks each year than in the early 1970s.”
4. SDGs, Targets and Indicators Analysis
| SDGs | Targets | Indicators Identified in Article |
|---|---|---|
| SDG 3: Good Health and Well-being | 3.9: Reduce deaths and illnesses from air pollution. 3.d: Strengthen early warning and management of health risks. |
– Worsened air quality and increased ground-level ozone. – Number of deaths from heat (e.g., “2,325 people died from heat in the U.S. alone” in 2023). – Rates of heat-related illnesses. |
| SDG 7: Affordable and Clean Energy | 7.1: Ensure universal access to reliable energy services. | – Frequency and duration of power outages caused by grid strain during heat streaks. |
| SDG 11: Sustainable Cities and Communities | 11.5: Reduce deaths and people affected by disasters. 11.6: Reduce the adverse per capita environmental impact of cities (air quality). |
– Number of deaths attributed to heat disasters. – Number of people affected by heat, especially vulnerable populations. – Worsened urban air quality during heat events. |
| SDG 13: Climate Action | 13.1: Strengthen resilience to climate-related hazards. 13.3: Improve education and awareness on climate change. |
– Increase in the annual number of extreme heat streaks (e.g., “two more extreme heat streaks each year” on average). – Use of awareness tools like the Climate Shift Index and HEAT.gov. |
Source: climatecentral.org

What is Your Reaction?
 Like
0
Like
0
 Dislike
0
Dislike
0
 Love
0
Love
0
 Funny
0
Funny
0
 Angry
0
Angry
0
 Sad
0
Sad
0
 Wow
0
Wow
0