


I had to look up what Mariculture meant too, guys, don't worry.
Mariculture is increasingly seen as vital for global food security, aligning with UN sustainability goals. However, past studies mainly highlighted its negatives. This work proposes an Emergy Accounting-based evaluation, showing mariculture's diverse environmental benefits beyond seafood production. China's mariculture areas like Liaoning and Shandong perform well, suggesting room for sustainable improvements and promoting integrated multi-trophic aquaculture (IMTA) for ecological gains.
Mariculture has gradually become a proposed solution to address the global food production crisis, prompting it to become the fastest growing food production sector in recent years. Therefore, mariculture's environmental and ecological influences have also been paid more attention, including both negative and positive aspects. At present, a comprehensive evaluation of mariculture's ecological performance is still lacking, so we propose an evaluation framework with China as a case study. We find that both cultured species and cultivation patterns determine the performance of mariculture. At present, mariculture in Liaoning, Shandong, Jiangsu, and Zhejiang performs better than that in other regions. Offshore mariculture will be paid more attention in the future. By identifying priority areas for offshore mariculture development, ecological benefits such as carbon sequestration and water purification can be significantly improved, while environmental impacts such as water contamination can be reduced. If the local cultured species can be properly matched, ecological burden such as water contamination can be reduced and even converted into ecological benefit. The goal of the study is to provide a way of comprehending the complexity of the mariculture system, thus providing reference and theoretical support for the sustainable development of mariculture both in China and around the world.
Abstract
Mariculture has been gradually regarded as an important solution to the global food production crisis. Increasing scientific evidence reveals that mariculture can provide a large number of ecologic benefits, in accordance with several United Nations sustainable development goals. However, previous studies mostly focused on the negative impacts of mariculture, which may impede its increased production. Here, based on Emergy Accounting (EMA), we propose a comprehensive “Multiple Inputs-Ecosystem Service Multifunctionality-Multiple Environmental Impacts” (MI-ESM-MEI) evaluation framework, trying to describe mariculture's overall environmental performances beyond just limiting to the production of seafoods. As the world's largest mariculture producer, China is taken as an example for evaluation. Our results show that both cultured species and cultivation patterns determine the environmental performance of mariculture: seaweed-raft, shellfish-raft, shellfish-hanging cage, shellfish-bottom sowing and others-bottom sowing mariculture could be more influential in environmental support. By identifying priority areas for offshore mariculture development, ecological benefits can be significantly improved using about 27% of China's territorial sea area. At present, mariculture in Liaoning, Shandong, Jiangsu, and Zhejiang performs better than that in other regions. Under the condition of recognizing nonnegligible ecological benefits of mariculture, additional improvements for more sustainable development are urgently needed. In addition, mariculture activities especially seaweed mariculture can help solve water contamination problem and alleviate the effects of eutrophication on coastal ecosystems. For most China coastal regions, if integrated multi-trophic aquaculture (IMTA) mode can be promoted, the ecological burden of mariculture can be reduced and even converted into ecological benefit.
Key Points
-
Mariculture can bring plenty of ecological benefits and even transform ecological burdens such as water contamination into ecological benefits in some cases
-
Both cultured species and cultivation patterns determine the environmental performance of mariculture
-
In China, mariculture's ecological benefits can be significantly improved if offshore mariculture can be developed in the future
Plain Language Summary
Mariculture has gradually become a proposed solution to address the global food production crisis, prompting it to become the fastest growing food production sector in recent years. Therefore, mariculture's environmental and ecological influences have also been paid more attention, including both negative and positive aspects. At present, a comprehensive evaluation of mariculture's ecological performance is still lacking, so we propose an evaluation framework with China as a case study. We find that both cultured species and cultivation patterns determine the performance of mariculture. At present, mariculture in Liaoning, Shandong, Jiangsu, and Zhejiang performs better than that in other regions. Offshore mariculture will be paid more attention in the future. By identifying priority areas for offshore mariculture development, ecological benefits such as carbon sequestration and water purification can be significantly improved, while environmental impacts such as water contamination can be reduced. If the local cultured species can be properly matched, ecological burden such as water contamination can be reduced and even converted into ecological benefit. The goal of the study is to provide a way of comprehending the complexity of the mariculture system, thus providing reference and theoretical support for the sustainable development of mariculture both in China and around the world.
1 Introduction
With the continuous growth of global population and the shortage of land and fresh water resources, mariculture has gradually become a proposed solution to address the global food production crisis, prompting such an economic sector to become the fastest growing food production sector in recent years (FAO, 2016). It is estimated that by 2050, the increase of edible seafood will be equivalent to 12%–25% of the increase in all meat needed to feed 9.8 billion people in the world, and the contribution of mariculture to seafood will be about 44%–76% (Costello et al., 2020). Almost all of the coastal countries have large areas suitable for the development of mariculture, and the annual finfish production potential will be over 100 times of the current global seafood consumption under the condition that all suitable areas are developed (Gentry, Froehlich, et al., 2017). Besides, a form of mariculture called “marine ranching” has received wide attention in the past few years (Yu & Zhang, 2020). Countries such as Japan, South Korea, the United States and China, etc., have vigorously carried out marine ranching implementation (Lee & Zhang, 2018; Qin et al., 2020), and treat it as a robust tool for resource enhancement and ecological restoration.
Since mariculture has gained in popularity, its environmental and ecological influences have also been paid more attention, including both negative and positive aspects. In most cases, mariculture is better known for its negative environmental impacts and socio-economic conflicts (Alleway et al., 2019), such as water pollution (Islam, 2005), biodiversity reduction (Diana, 2009), coastal wetlands destruction (Richards & Friess, 2016), alien species invasion (Naylor et al., 2005), disease or parasite outbreak (Krkosek et al., 2007), etc. In addition, fed mariculture relies on large amounts of feed input such as fish meal, fish oil and forage fish. As these feed materials are mainly obtained from wild fishing, the rapid growth of mariculture may lead to the depletion of wild fish resources (Cao et al., 2015; Naylor et al., 2000). In terms of socio-economic impacts, mariculture may aggravate social inequality and lead to poverty traps (Abdullah et al., 2017). Sometimes the economic losses caused by unsustainable mariculture even exceed the economic incomes (Malik et al., 2015).
Recently, however, environmental and social benefits of mariculture have been identified and pointed out, and researchers are committed to maximizing benefits through effective management (Alleway et al., 2019). Although its ultimate goal is seafood provision, mariculture is capable of providing important ecosystem services such as carbon sequestration (Tang et al., 2011), water purification (Xiao et al., 2017), coastal protection (Jackson et al., 2020), tourism and leisure (Liu et al., 2019), habitat provision (Theuerkauf et al., 2022), etc. In addition, employment opportunities can be offered to coastal residents to help maintain livelihoods (McCausland et al., 2006). Although mariculture is usually regarded as a food industry, mariculture activities align with a much broader spectrum of ecological concepts (Theuerkauf et al., 2022). It has been suggested that shellfish and seaweed cultivation can support the restoration of oyster reefs and seaweed forests, thus avoiding the loss of corresponding ecosystem services due to habitat degradation (Tang et al., 2011). Furthermore, mariculture may also be associated with a series of sustainable development goals (SDGs) (United Nations, 2015). For example, it helps to achieve SDG1 (no poverty) and SDG2 (zero hunger) by offering employment opportunities and ensuring seafood supply (Blanchard et al., 2017). The healthy development of mariculture can support the long-term sustainable utilization of marine resources, which is closely related to SDG12 (responsible consumption and production) and SDG14 (life below water) (Theuerkauf et al., 2022). Moreover, seafood is an important source of protein and micronutrients (SDG3: good health and well-being) (FAO, 2016) and climate-friendly seafood may contribute to greenhouse gases (GHGs) reduction and carbon sequestration (SDG13: climate action) (Jones et al., 2022).
As mentioned above, mariculture is a “double-edged sword” (Meng & Feagin, 2019), that is, the development of mariculture not only may cause ecological burdens, but also could bring ecological benefits. However, ecological benefits and burdens often operate in an overlapping or synchronous manner. Although individual benefits or burdens elicit their own suite of environmental responses, their interactions within and between may have yet-unpredictable influence on marine ecosystems. In some cases, ecological burdens can even be transferred to ecological benefits, which is beneficial to the ecosystems and the species, including humans. Therefore, one of the goals of the present study is to figure out these benefits and burdens, and the transformation potential between them.
At present, a comprehensive evaluation of mariculture's ecological performance is still lacking, which has become the core and the difficulty of current research (Weitzman, 2019). Common approaches for mariculture's environmental performance assessment mainly include three categories: Life Cycle Assessment (LCA), Ecological Footprint (EF) and Emergy Accounting (EMA). Oriented to environmental impact, LCA is often used to assess the environmental burden, and material and energy consumption of products or processes across their whole life (Pelletier & Tyedmers, 2008; Rebitzer et al., 2004), which has been widely recognized and implemented in aquaculture sector (Bohnes et al., 2019; Cao et al., 2013). The framework for LCA includes: definition of the goal and scope of the LCA, the life cycle inventory analysis (LCI), the life cycle impact assessment (LCIA), and the life cycle interpretation (ISO, 2006), among which LCIA matters the most. Common LCIA indicators of mariculture implementation are global warming, eutrophication, acidification, energy use and ecological toxicity (Cao et al., 2013). However, as a mostly anthropocentric approach, LCA focuses on the processes occurring in the technical field and the environment in which these processes are built. The resources considered in LCA are mainly non-renewable or abiotic resources, while the quantification of renewable resources supporting the production process is still lacking. In addition, LCA very seldom accounts for most of the ecosystem services that are required for emissions dissipation and impact absorption (Zhang et al., 2010). Ecological footprint (EF) reflects the areas (land or sea) needed to support the current resource consumption and waste discharge level of a specific population, product, or economic activity (Wackernagel & Rees, 1996), under the implicit assumption that all resource uses can be assessed and translated into needed areas (Zhao et al., 2005). EF transforms different land use types for both supply and demand of ecological resources into a common unit, the “global hectare,” thus comparing the discrepancy between areas needed for sustainable resource consumption and actual biological carrying capacity. At present, this approach has been applied to some extent in mariculture of different types and regions (Bala & Hossain, 2010; Folke et al., 1998). Nevertheless, ecosystems are complex systems with nonlinearities, thresholds and discontinuities (Costanza et al., 1993), while EF is a static measurement, with some difficulty to capture the dynamic characteristics of the ecosystems (Folke et al., 1998). Moreover, one ecosystem can provide several ecosystem services, while the EF concept assumes that the ecosystem is only associated to provide one service only, in so generating double counting problems in the calculation process (Roth et al., 2000). Therefore, under an eco-centric perspective, Emergy Accounting (EMA) can be used to calculate the natural capital needed to provide products and services within the evolutionary trial-and-error framework and preventing the risk for supporting areas double-counting (Odum, 1996). This approach views any given environment/system as a complex available energy (exergy) flow network, quantifies all the efforts made by nature to provide these flows, and unifies them into the (virtual) common denominator of solar emergy (Odum, 1996). The advantage of EMA lies in considering not only the non-renewable resource inputs, but also the free environmental inputs, which are also necessary for each production process. In most cases, environmental inputs have no market value and are hardly measured by money, while EMA provides a basis for quantitative evaluation (Brown & Ulgiati, 2004). Another advantage of the EMA approach is that it can help quantify a variety of ecosystem services and disservices, so as to better support discussions and proposals for more sustainable systems (David et al., 2021). At present, although some studies have applied EMA to evaluate mariculture systems such as fish (Vassallo et al., 2007), shrimp (Lima et al., 2012), shellfish (Shi et al., 2013), etc., also comparing with results from other approaches, the application of EMA to mariculture environmental performance evaluation is still in the initial stage (David et al., 2021).
Therefore, this study proposes a comprehensive “Multiple Inputs-Ecosystem Service Multifunctionality-Multiple Environmental Impacts” (MI-ESM-MEI) evaluation framework, constructs an emergy-based evaluation method, and takes the largest mariculture producer worldwide—China as a telling case study for evaluation. The goal of the present manuscript is to provide a way of comprehending the complexity of the mariculture system, and evaluate—in terms of varying environmental performances—the multifaceted responses of marine ecosystems to dynamic environmental perturbations, thus providing reference and theoretical support for the sustainable development of mariculture both in China and around the world.
2 Materials and Methods
2.1 Mariculture “MI-ESM-MEI” Framework
The normal operation of mariculture systems often involves multiple inputs (MI), which can be roughly divided into two parts: renewable environmental inputs and human inputs. Among them, renewable inputs are often associated to positive environmental benefits brought by mariculture activities, while the increase of human inputs most often leads to the aggravation of negative environmental impacts. Meanwhile, the mariculture ecosystem multifunctionality has also received increasing attention (Popp et al., 2019), in which the ecosystem service multifunctionality (ESM) represents the co-supply of multiple human-related ecosystem services (Manning et al., 2018). The assessment of ESM reveals the multidimensional nature of ecosystem services, allowing for the weighting of individual ecosystem services from distinct categories, so as to decouple the comprehensive indicator of ESM from individual services and embrace the complexity of ecosystem service trade-offs and synergies (Custer & Dini-Andreote, 2022; Power, 2010). In addition, the mariculture activities also bring multiple environmental impacts (MEI). Similar to the interactions between ecosystem services, synergies and trade-offs may exist between different types of environmental impacts and even between environmental impacts and ecosystem services. Therefore, it is of great importance to understand the interactions within and between resources input, ecosystem services and environmental impacts. Combining the assessment of MI, ESM, and MEI is an important step to maximize mariculture's social and ecological benefits.
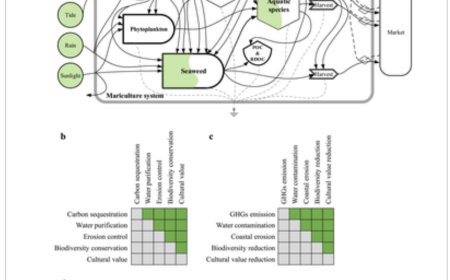
Based on this, this study proposes a comprehensive “MI-ESM-MEI” evaluation framework (Figure 1), which helps understand the complexity of marine ecosystem and its multiple responses to dynamic environmental perturbations, with focus on mariculture in China as a case study. The evaluation framework includes: (a) MI evaluation: including renewable inputs and human inputs; (b) ESM evaluation: including carbon sequestration, water purification, erosion control, biodiversity conservation and cultural value; (c) MEI evaluation: including GHGs emission, water contamination, coastal erosion, biodiversity reduction and cultural value reduction.
Conceptual diagram displaying the “MI-ESM-MEI” evaluation framework. (a) Emergy diagram of mariculture system. (b) Interactions between ecosystem services. This diagram suggests that synergy relationship mainly exists between five types of ecosystems services. (c) Interactions between environmental impacts. This diagram shows the synergy relationship existing between five types of environmental impacts. (d) Interactions between ecosystem services and environmental impacts. This diagram highlights the trade-off relationship existing between ecosystem service and corresponding environmental impact. (e) Interactions between resource inputs, ecosystem services and environmental impacts. This study points out the synergy relationship between renewable input and ecosystem service, as well as between human input and environmental impact. Further, a trade-off relationship exists between renewable input and environmental impact, as well as between human input and ecosystem service.

Although there is significant diversity in mariculture systems, all types of mariculture fall into three broad categories (Figure 2): fed mariculture (e.g., fish, most crustaceans, etc.), autotrophic mariculture (e.g., seaweed), and unfed mariculture (e.g., shellfish). Each category of mariculture interacts with the environment in different ways, both in terms of the external inputs required and the influence on the surrounding environment (Gentry, Lester, et al., 2017).
The interactions between mariculture and surrounding environment. (a) Fed mariculture. (b) Autotrophic mariculture. (c) Unfed mariculture.

For fed mariculture (Figure 2a), renewable resources drive the photosynthesis of marine phytoplankton, which later becomes a part of natural feed. The growth of cultured species mainly depends on human feed input. In order to ensure the normal progress of mariculture activities, plenty of non-renewable resources are also put into the mariculture system, and many unused feed, chemicals and generated wastes are discharged into marine environment, causing water contamination. During the production, processing and transport of feed as well as on-farm energy use, GHGs will also be emitted. In addition, if the cultivation pattern is pond mariculture, it may cause the destruction of coastal wetlands, thus leading to the aggravation of coastal erosion.
For autotrophic mariculture (Figure 2b), renewable resources such as solar, wind, rain and tidal energy drive the photosynthesis of seaweed, in which CO2 is sequestrated by plant organisms. In the meanwhile, human inputs such as infrastructure, machinery, fishing boats, fuels, fertilizers, disinfectants, labor, seeds, are also invested into the mariculture system and support the seaweed production together with renewable resources. However, during the seaweed growing process, organic carbon will be deposited and exported, thus playing the role of carbon sequestration. Furthermore, seaweed can absorb and enrich nutrients and wastes brought in by tides and runoff, contributing to water purification. Seaweed-raft mariculture can also reduce waves energy and alleviate coastal erosion by its canopy structure.
For unfed mariculture (Figure 2c), renewable resources drive the photosynthesis of marine phytoplankton, while shellfish assimilate the energy in phytoplankton and other organic substances through biological filtration process. A large number of external resources are also put into the mariculture system to jointly support the shellfish production. However, shellfish may produce feces and pseudo-feces in the growing process, and these biological sediments can be buried for a long time, contributing to carbon sequestration. Moreover, nutrients such as N and P are absorbed for the growth of shells and tissues, which will be removed from the marine ecosystem during shellfish harvest, thus playing a role of water purification. In addition, shellfish-raft and hanging cage mariculture may also rely on the physical barrier of farm facilities and the biological barrier of shellfish itself to buffer water flow and reduce the coastline retreat. However, on-farm energy use and aquatic N2O generation may lead to GHGs emission.
2.2 Mariculture's Environmental Performances Accounting Methods
Mariculture's environmental performances accounting methods is composed of the following parts: (a) Multiple inputs (MI) accounting methods; (b) Ecosystem service multifunctionality (ESM) accounting methods; (c) Multiple environmental impacts (MEI) accounting methods. Based on this, two comprehensive indicators, greenness (GN) and total ecological benefit (TEB), are also proposed for further evaluation.
In order to make the relationships of the environmental performance accounting methods easily understood, Table 1 is provided to briefly explain the meaning and calculation of each index, and the detailed description can be found in Text S1 and Table S1 of the Supporting Information S1.
| Abbreviation | Full title | Unit | Formula | Meaning |
|---|---|---|---|---|
| MI | Multiple inputs | solar equivalent joule (sej)/yr | MI = ∑(EmRi + EmHi) | MI is defined as the sum of renewable (EmRi) and human inputs (EmHi). The larger a MI index value, the more resources are needed to maintain the normal operation of the mariculture system |
| ESM | Ecosystem service multifunctionality | sej/yr | ESM = EmCS + EmWP + EmEC + EmBC + EmCV | ESM is defined as the sum of the five ecosystem services including carbon sequestration (EmCS), water purification (EmWP), erosion control (EmEC), biodiversity conservation (EmBC), and cultural value (EmCV). Higher ESM index values represent a greater capacity of the mariculture systems to provide more ecosystem services |
| MEI | Multiple environmental impacts | sej/yr | MEI = EmGE + EmWC + EmCE + EmBR + EmCR | MEI is defined as the sum of the five environmental impacts including GHGs emission (EmGE), water contamination (EmWC), coastal erosion (EmCE), biodiversity reduction (EmBR), and cultural value reduction (EmCR). Higher MEI index values represent greater negative environmental impacts caused by mariculture activities. For the sake of clarity, measuring MEI in emergy terms means to assess the minimum amount of emergy that would be needed to fix the damages caused by the different impacts |
| GN | Greenness | % | GN is defined as the proportion of renewable inputs to total resource inputs. Larger value indicates higher environmental-friendly degree | |
| TEB | Total ecological benefit | sej/yr | TEB = ESM − MEI | TEB is defined as the difference between ESM and MEI. Positive indicator value indicates that the environmental benefits of mariculture activities are relatively higher, while negative indicator value has the opposite meaning |
2.3 Constraints of Offshore Mariculture Priority Areas
The delivery of mariculture ecosystem services can be affected by biotic, abiotic and socio-economic factors, and a suitable marine spatial planning may help to release this service potential (Alleway et al., 2019). Traditionally, mariculture activities are mostly concentrated in the coastal regions with shallow water depth (<20 m). Recently, however, offshore mariculture has gradually been paid more attention due to space and resources limitation (Gentry, Froehlich, et al., 2017). Compared with nearshore and land-based mariculture, offshore mariculture has less freshwater demand, less land occupation, higher nutrient assimilation capacity, and less pollution and disease occurrence (Froehlich et al., 2018).
In order to identify the priority areas for offshore mariculture development in China, this study makes the overall assumptions: mariculture activities are not allowed in marine protected areas in most cases, so these areas are excluded. Meanwhile, since seaweed and shellfish mariculture have been proved to be more environmental-friendly and have higher environmental benefits in this study, they are regarded as the first choice for offshore mariculture development. The negative environmental impacts of nearshore and land-based fish mariculture cannot be ignored, and the development of fish offshore mariculture is equally urgent with increasing demand for fish consumption. The fish, shellfish and seaweed offshore mariculture priority areas are limited to conservative thresholds for each of the environmental variables, which are shown as follows:
For fish mariculture, water depth is limited to 30–100 m, which is based on the current practical experience of offshore mariculture (Lester et al., 2018). In addition, the seawater flow rate is limited to 10–100 cm/s, because the low flow rate leads to the weak pollutants removal capacity, while the excessive flow rate damages the farm infrastructure and affects the growth of fish (Oyinlola et al., 2018). Dissolved oxygen concentration is another key factor affecting fish survival, so fish mariculture activities are limited in areas with dissolved oxygen concentration ≥4.41 mg/kg (Gentry, Froehlich, et al., 2017).
For shellfish mariculture, water depth is limited to 20–80 m (Lester et al., 2018). Moreover, shellfish needs sufficient natural food supply for growth, and Chlorophyll a concentration is considered to be the most reliable measure of food availability. Only areas with Chlorophyll a concentration ≥2 mg/m3 can carry out shellfish mariculture activities (Gentry, Froehlich, et al., 2017).
For seaweed mariculture, water depth is also limited to 20–80 m (Lester et al., 2018). Besides, the environmental conditions with low salinity may inhibit the growth of seaweed, so it is assumed that the salinity should be ≥25‰ (Kerrison et al., 2015).
We use ArcGIS 10.2 software for data analysis. By adding data layers and performing intersection analysis, areas that meet all the constraints can be identified.
2.4 Study Areas
China is the largest mariculture producer worldwide, of which the mariculture production ranked first in 2020 (Xu et al., 2022), contributing more than 65% to the global mariculture production (Zhou et al., 2022). The main characteristics of mariculture in China are wide variety, rich diversity, low trophic levels, high ecological efficiency and large biological output (Tang et al., 2016). In addition, affected by river input, atmosphere deposition and submarine groundwater discharge, etc., China is facing a serious coastal eutrophication problem (Wang et al., 2021), but mariculture provides a solution to alleviate the effects of eutrophication on coastal ecosystems. The scale and production of seaweed mariculture in China ranks first in the world (FAO, 2022), which plays an important role in eliminating nutrients in coastal waters. It is estimated that total N removal by seaweed mariculture represents about 5.5% of N inputs to Chinese coastal waters in 2014 (Xiao et al., 2017). Therefore, China is taken as a typical case study of this investigation.
Cultured species and cultivation patterns are key factors determining the input and environmental performance of various kinds of mariculture (Alleway et al., 2019). According to the difference of cultured species, China’s mariculture can be roughly divided into five categories: shellfish, seaweed, crustaceans, fish, and others (including sea cucumber, sea urchin, jellyfish, seawater pearls, etc.). According to the difference of cultivation patterns, mariculture can be divided into six categories: raft, hanging cage, bottom sowing, common cage, deep-water cage, and pond. According to the main cultivation patterns of different mariculture species, 12 types of typical mariculture systems are divided in this study (Figure 3).
The characteristics and performance of different types of mariculture system. (a) Major characteristic of six categories of mariculture cultivation patterns. Raft mariculture sets floating rafts in shallow water or intertidal zones and hangs seedlings on the raft. Hanging cage mariculture sets floating rafts in shallow water or intertidal zones, hangs cages on the raft, and puts seedlings in the cage. Bottom sowing mariculture sows and breeds seedlings in intertidal or subtidal zones so as to make them grow naturally. Common cage mariculture sets cages in shallow water and puts seedlings in the cage. Deep-water cage mariculture sets anti-wind and wave cages in deep sea areas (usually water depth>20 m). Pond mariculture uses artificially excavated or natural ponds in intertidal or supratidal zones and makes seedlings grow in ponds. (b) The performance of mariculture systems under the “MI-ESM-MEI” framework. Note that “√” represents that the mariculture system have the corresponding environmental performance, while “*” represents the indeterminate situation.

Among 11 coastal regions in China, most regions have reported their mariculture activities except for Shanghai. The basic situation of China's mariculture in 2020 is shown in Figure 4.
China's mariculture production status in different coastal regions in 2020. Note: SW-R, Seaweed-Raft; SW-P, Seaweed-Pond; SF-BS, Shellfish-Bottom sowing; SF-R, Shellfish-Raft; SF-HC, Shellfish-Hanging cage; O-BS, Others-Bottom sowing; O-HC, Others-Hanging cage; O-P, Others-Pond; C-P, Crustacean-Pond; F-CC, Fish-Common cage; F-DC, Fish-Deep-water cage; F-P, Fish-Pond.

2.5 Data Sources
- (1)
Basic data: mariculture production, area, fishing boats and labor input data are from China Fisheries Statistical Yearbook 2021 (China Fisheries Statistical Yearbook Editing Committee, 2022).
- (2)
External input data: feed coefficient data related to feed input come from Research Report on the Utilization of Marine Fishery Resources by China’s Aquaculture provided by Greenpeace (2017); fuel and energy use data in mariculture activities are from Muir (2015); other input related data (such as infrastructure, machinery, fertilizers, disinfectants, seedlings, etc.) come from extensive literature research.
- (3)
Renewable input data: the solar radiation data come from Global Solar Atlas (2019); the precipitation data come from China Water Resources Bulletin 2020 (China Ministry of Water Resources, 2021); the wind speed data come from Global Wind Atlas (2019); the evaporation data come from Objectively Analyzed air-sea Fluxes (OAFlux) provided by Woods Hole Oceanographic Institution (WHOI) (Yu et al., 2006).
- (4)
Environmental impact related data: the GHGs emission data are from MacLeod et al. (2020); the production coefficient of pollutants in mariculture activities comes from First National Pollution Source Census Handbook of Pollution Production and Discharge Coefficient of Aquaculture (Chinese Academy of Fishery Sciences, 2010).
- (5)
Offshore mariculture related data: the water depth data are from ETOPO1 (NOAA National Centers for Environmental Information, 2022); the salinity data are from Zweng et al. (2018); the dissolved oxygen concentration data are from Garcia et al. (2018); Chlorophyll a concentration data are from Li et al. (2021).
In this study, the global emergy baseline is 1.2E + 25 sej/yr (Brown & Ulgiati, 2016). Besides, typical cases are selected to show the detailed “Multiple Inputs-Ecosystem Service Multifunctionality-Multiple Environmental Impacts” calculation process, and the results are shown in Text S2 of the Supporting Information S1.
It should be noted that although mariculture activities can bring positive or negative influences on biodiversity and cultural value, due to the lack of relevant research and the difficulty in obtaining data (Gentry et al., 2020), these two aspects will not be evaluated in this study.
3 Results
3.1 Performance of Mariculture Systems in China
Figure 5a shows the MI of different types of mariculture systems to produce seafood per ton. Among them, the MI of shellfish mariculture is obviously lower than that of the rest, followed by seaweed mariculture and crustaceans mariculture, while the MI of fish and others mariculture is relatively higher. The cultivation patterns also affect MI: for seaweed, the MI of pond mariculture is obviously higher than that of raft mariculture. The MI order of others is pond mariculture > hanging cage mariculture > bottom sowing mariculture. However, for shellfish and fish, there is no significant difference in MI between each cultivation pattern.
Comparison of different types of mariculture systems' performance (Unit: sej/t/yr). (a) Multiple inputs. (b) Ecosystem service multifunctionality. (c) Multiple environmental impacts.

As shown in Figure 5b, only seaweed and shellfish mariculture have ESM when three ecosystem services (carbon sequestration, water purification, erosion control) are evaluated, and the ESM versatility of seaweed mariculture is significantly higher than that of shellfish mariculture. The cultivation patterns also affect ESM: for seaweed, the ESM of pond mariculture is significantly higher than that of raft mariculture, but the latter provides more abundant ecosystem services. However, for shellfish, the ESM of cage and raft mariculture is higher than that of bottom sowing mariculture and provides more types of ecosystem services. In addition, cultured species is another important factor affecting ESM: water purification is the main service provided by seaweed mariculture, while both water purification and erosion control are main services provided by shellfish mariculture.
Under the condition that only three environmental impacts (GHGs emission, water contamination, coastal erosion) are evaluated (Figure 5c), the MEI of others-pond mariculture is the highest, followed by others-hanging cage mariculture and fish-pond mariculture, while that of shellfish mariculture, others-bottom sowing mariculture and fish-deep-water cage mariculture is relatively lower. Besides, seaweed-raft mariculture doesn't show MEI. What's more, the cultivation patterns affect MEI: for others, the MEI of pond mariculture is significantly higher than that of cage and bottom sowing mariculture as well as causing more types of environmental impacts. For fish, the MEI of pond and common cage mariculture is higher than that of deep-water cage mariculture, and the impact categories caused by pond mariculture is also more. In addition, the main environmental impacts differ from type to type: water pollution is the main impact of others-hanging cage, fish-common cage and fish-pond mariculture, while coastal erosion is the main impact of seaweed-pond and crustaceans-pond mariculture. Besides, water pollution and coastal erosion are two main impacts of others-pond mariculture, while GHGs emission is the main impact of shellfish-raft, shellfish-hanging cage, shellfish-bottom sowing, others-bottom sowing and fish-deep-water cage mariculture.
3.2 Performance of Mariculture Activities in China Coastal Regions
Figure 6a shows that the MI of mariculture in Hainan and Tianjin is much higher than that in other regions, while the MI of mariculture in Liaoning and Shandong is relatively lower.
Comparison of mariculture's performance in different regions (Unit: sej/t/yr). (a) Multiple inputs. (b) Ecosystem service multifunctionality. (c) Multiple environmental impacts.

When only three ecosystem services are evaluated, the ESM of mariculture in all regions shows positive values except for Tianjin (Figure 6b); Fujian has the highest ESM, while Guangxi has a relatively lower ESM. Moreover, the mariculture in Hebei keeps erosion control as its main ecosystem service, while water purification is the main ecosystem service provided in other regions.
If only three environmental impacts are considered (Figure 6c), the MEI of mariculture in Hainan records the highest value, while the MEI in Shandong and Liaoning is relatively lower. Water pollution is the main environmental impact in all regions.
3.3 Performance of Comprehensive Mariculture Indicators
If the environmental performance is compared according to the ranking of indicators, interesting results can be identified in both mariculture systems and mariculture regions. The results are summarized in Figure 7, and the indicator values are shown in Table S2 and Table S3 of the Supporting Information S2.
The scatter plot of ranking of mariculture's greenness and total ecological benefit indicators. (a) Different types of mariculture system in China. (b) Mariculture in different regions of China.

Figure 7a reveals the ranking of indicators in different types of mariculture systems in China. By comparing the greenness (GN) indicator, it can be found that others-bottom sowing and shellfish-bottom sowing mariculture rank as the two top-performing systems, with indicator values greater than 11%, suggesting that these two types of mariculture systems are more environmental-friendly. Instead, fish-common cage, deep-water cage and pond mariculture rank at the bottom with indicator values lower than 0.6%, revealing that fish mariculture generally depends on the external inputs, and the environmental protection degrees are very low. From the ranking of total ecological benefit (TEB) indicators, it can be found that seaweed-pond, seaweed-raft, shellfish-hanging cage, shellfish-raft and shellfish-bottom sowing mariculture rank in the top five, and the indicator values are greater than 0, showing their overall positive ecological benefits. The TEB indicator values of the remaining types of mariculture systems are less than 0, and others-pond, others-hanging cage and fish-pond mariculture rank at the bottom with relatively highly negative ecological impacts. Considering the overall performance, 12 types of mariculture systems can be divided into three categories: the first category includes others-bottom sowing, shellfish-raft, shellfish-hanging cage, shellfish-bottom sowing and seaweed-raft mariculture, of which both TEB and GN indicators rank in the top 50%. The second category includes seaweed-pond and others-pond mariculture with only one indicator ranking in the top 50%, among which the former performs better in TEB, while the latter performs better in GN. The third category includes others-hanging cage, crustaceans-pond and fish-common cage, fish-deep-water cage and fish-pond mariculture, with both indicators ranking much lower.
Figure 7b reflects the indicator ranking of mariculture in different China coastal regions. Based on the GN indicator, it can be found that the mariculture in Liaoning ranks first, with the indicator value greater than 14%, showing the highest environmental-friendly degree. Instead, mariculture in Hainan, Guangxi and Guangdong rank at the bottom with indicator values less than 1.3%, reflecting their high dependence on external inputs. When the comparison is based on the TEB indicator, it can be noticed that mariculture systems in Fujian, Liaoning, Shandong, Zhejiang and Jiangsu rank among the top five, with indicator values greater than 0, confirming that mariculture activities in these regions provide positive ecological benefits. Nonetheless, the indicator values in the remaining regions are less than 0, with Hainan and Tianjin ranking at the bottom, revealing that mariculture in these two regions has caused serious negative ecological impacts. Considering the overall performance, 10 mariculture regions can be divided into three categories: the first category includes Liaoning, Shandong, Jiangsu and Zhejiang with two indicators ranking in the top 50% group. The second category includes Hebei and Fujian, among which only the former ranks in the top 50% in terms of GN, while the latter only ranks in the top 50% in terms of TEB. The third category includes Tianjin, Guangdong, Guangxi, and Hainan, which perform poorly in both indicators ranking.
3.4 Priority Areas for Offshore Mariculture Development
The priority areas for offshore mariculture in China are shown in Figure 8, of which the areas for fish, seaweed and shellfish are 1.31E + 07, 5.65E + 07, 1.10E + 07 ha, respectively, covering about 4.37%, 18.84%, 3.65% of China's territorial sea area. In addition, the overlapping area of fish and seaweed is 7.91E + 06 ha, and that of fish, shellfish and seaweed is 1.11E + 05 ha, indicating that these areas may have the potential for integrated multi-trophic aquaculture (IMTA) development.
The distribution of priority areas for offshore mariculture in China.

For seaweed and shellfish, if these regions can be developed in the future, by multiplying the priority area data and the ESM per area (3.05E + 15 sej/ha/yr for seaweed; 1.77E + 14 sej/ha/yr for shellfish), it can be preliminarily estimated that the ESM increase potential of seaweed and shellfish may be 1.73E + 23 and 1.94E + 21 sej/yr, equivalent to about 398 times and 16 times of the ESM of current seaweed and shellfish mariculture. For fish, as the development of offshore mariculture may reduce the impact of water contamination, by multiplying the priority area data and the impact of water contamination per area (3.42E + 16 sej/ha/yr for fish), it can be estimated that the impact reducing potential of water contamination will be 4.49E + 23 sej/yr, which is capable of counteracting the impact of water contamination caused by 1,758 times expansion of current fish mariculture. However, since the offshore farm is always far away from the land and the cultivation environmental conditions are relatively poor, the impact of GHGs emissions related to transport fuel use and on-farm energy consumption may greatly rise (Holmer, 2010). This impact cannot be quantitatively assessed at present due to data limitations, which may lead to the underestimation of the environmental impact of offshore mariculture, requiring further investigation. In addition, we have not estimated the role of IMTA system in increasing ESM and reducing water contamination for the time being, which needs to be considered in the future.
Although our preliminary assessment results show that there are still large potential areas for offshore mariculture, some important environmental and socio-economic factors are still not considered, which may contribute to the exclusion of more seemingly suitable mariculture spaces. For example, the distance-related cost-effectiveness of offshore mariculture needs to be taken into account, so areas that are far away from ports or shoreside infrastructure should be excluded. Offshore regions for shipping, industry, mineral development, military and other purposes also need to be excluded. In addition, areas with high environmental sensitivity and biodiversity (such as coral reefs and seagrass beds) may not be suitable for large-scale mariculture. Therefore, the actual potential areas would result definitely to be smaller than the above-mentioned evaluation areas.
4 Discussion
4.1 Transformation Potential of Mariculture From Ecological Burden to Ecological Benefit
Our study shows that water contamination is one of the most severe negative environmental impacts caused by mariculture. The main reason lies in excessive feed input and high cultivation density, which makes a large number of wastes enter the water body, translating into an “ecological burden” to the marine environment (Cao et al., 2007). On the other side, seaweed and shellfish can improve the water quality by absorbing Nitrogen (N) and Phosphorus (P) during their growth (Gentry et al., 2020), thus providing an “ecological benefit.” In this study, it is found that the impact of water contamination (i.e., the environmental cost of this damage) caused by mariculture activities in China is about 3.04E + 20 sej/yr, while the water purification service (i.e., the increased environmental support to water quality) provided by seaweed and shellfish mariculture is about 4.84E + 20 sej/yr. If an integrated multi-trophic aquaculture (IMTA) mode can be vigorously developed, it is possible to turn the ecological burden into ecological benefit. Typical IMTA systems include fish-seaweed, fish-shellfish-seaweed, shellfish-seaweed-sea cucumber, etc. IMTA can transform the inedible feed and waste of one species into feed, fertilizer and energy for another species, by making full way to the material utilization capacity of species with different trophic levels, so as to reduce waste discharge (Buck et al., 2018). Jiang et al. (2010) showed that fish-seaweed co-cultivation is an effective way to alleviate the eutrophication in Nansha Bay. In order to balance the N absorption of seaweed mariculture and the N emission of fish mariculture, harvesting 1 kg of fish will also yield 8.28–10.08 kg of seaweed. Huo et al. (2012) also estimated that in order to maintain the N balance of fish-seaweed IMTA system in Xiangshan Harbor, the optimal co-cultivation proportion was 1 kg fish to 7.27 kg seaweed. Stemming from such results, this study also takes N flows as an example to preliminary illustrate the transformation potential from ecological burden to ecological benefits through IMTA in different regions.
In addition to solve the water contamination problem mentioned above, mariculture activities especially seaweed mariculture can also alleviate the effects of eutrophication on coastal ecosystems. Although the N inputs to seas are affected by multiple sources such as river export, atmospheric deposition, submarine fresh groundwater discharge and mariculture, river export is the largest source, constituting over 80% of the total N inputs to Chinese coastal waters (Wang et al., 2021). Therefore, this study also preliminary estimate the role of seaweed mariculture in removing river N export.
As shown in Table 2, the mariculture N emissions in Hebei, Liaoning, Jiangsu, Zhejiang, Fujian and Shandong are lower than mariculture N absorption, indicating that if these regions can promote IMTA and reasonably match the types of local mariculture species, the ecological burdens can be reduced and transformed into ecological benefits. In addition to eliminating the nitrogen emission from mariculture, mariculture activities in these regions can also help absorb the river N export, thus alleviating eutrophication. However, the complete removal of river N export in these regions requires the seaweed production to be expanded to 2.94–2,261.83 times of the original production. For Guangxi, it can be found that the mariculture N absorption is greater than the sum of mariculture N emission and river N export, meaning that mariculture activities may be limited by the background nutrient pools, but artificial upwelling has been proposed as a possible solution to overcome this limitation (Duarte et al., 2021).
| Mariculture N absorptiona (t/yr) | Mariculture N emissionb (t/yr) | River N exportc (t/yr) | N net budgetd (t/yr) | |
|---|---|---|---|---|
| Tianjin | 0.00E + 00 | 1.90E + 01 | 1.05E + 04 | 1.05E + 04 |
| Hebei | 2.20E + 03 | 3.39E + 02 | 4.31E + 04 | 4.13E + 04 |
| Liaoning | 2.79E + 04 | 7.30E + 02 | 1.53E + 05 | 1.26E + 05 |
| Jiangsu | 5.38E + 03 | 8.93E + 02 | 8.24E + 04 | 7.79E + 04 |
| Zhejiang | 9.91E + 03 | 1.23E + 03 | 1.01E + 05 | 9.28E + 04 |
| Fujian | 5.69E + 04 | 1.60E + 04 | 1.14E + 05 | 7.29E + 04 |
| Shandong | 4.38E + 04 | 2.11E + 03 | 1.61E + 05 | 1.19E + 05 |
| Guangdong | 1.30E + 04 | 1.49E + 04 | 1.65E + 04 | 1.84E + 04 |
| Guangxi | 6.25E + 03 | 2.25E + 03 | 3.17E + 03 | −8.38E + 02 |
| Hainan | 1.97E + 02 | 1.53E + 03 | 1.00E + 04 | 1.14E + 04 |
- a Shellfish and seaweed mariculture have the capacity of N absorption. Based on the N content of shellfish and seaweed biomass, this study calculates that the N absorption capacity of seaweed is about 30.43 g N/kg dry weight, while that of shellfish is about 5.94 g N/kg.
- b Fish, crustaceans and others mariculture generate N emissions. Based on the pollution production coefficient of different types of cultured species, this study calculates that the N emissions of fish-cage and fish-pond mariculture are 75.68 and 9.71 g N/kg respectively. N emission of crustacean mariculture is 2.30 g N/kg, while that of others-cage and others-pond mariculture is 4.66 g N/kg.
- c This study converts the published inventory of riverine N export to Chinese seas from Wang et al. (2021) into N flux (t/km2/yr), and then multiply N flux by the coastal water areas (km2) of different coastal regions as river N export. For Tianjin, Hebei, Liaoning, Shandong and Jiangsu, the N flux in the Yellow sea and Bohai Sea (6.64 t/km2/yr) are used for Calculation; For Zhejiang and Fujian, the N flux in the East China Sea (5.74 t/km2/yr) are used for Calculation; For Guangdong, Guangxi and Hainan, the N flux in the South China Sea (0.597 t/km2/yr) are used for Calculation.
- d N net budget = (Mariculture N emission) + (River N export) − (mariculture N absorption).
However, for Tianjin, Guangdong and Hainan, the mariculture N emissions are relatively higher, indicating that mariculture can cause overall negative impacts on the local marine environment. Even if IMTA is fully applied in these regions, other measures must be taken. In order to balance the mariculture N absorption and emission, it is necessary to expand the seaweed production in Guangdong and Hainan to 1.93 times and 10.31 times of the original production, and increase the seaweed production in Tianjin to 6.23E + 02 t/yr (currently there is no seaweed production in Tianjin). Furthermore, in order to remove river N export, the seaweed production in Guangdong and Hainan should be expanded to 9.95 times and 80.38 times of the original production, and the seaweed production in Tianjin should be increased to 3.47E + 05 t/yr.
At present, China is at the forefront of IMTA development, and this mode has been practiced in some regions: fish-shellfish-seaweed and fish-seaweed IMTA are popular in Zhejiang, Fujian, Guangdong; shrimp-shellfish IMTA is popular in Shandong and Jiangsu; shellfish-seaweed IMTA has been deployed in almost all coastal regions of China; mangrove-restoration-based IMTA has been developed in Guangxi (Zhou et al., 2022). On this basis, some studies have estimated the ecological benefits of the IMTA system based on ecosystem services evaluation: Tang et al. (2013) investigated the service value of food provision and climate regulation under different mariculture modes in Sanggou Bay, and their results showed that the service value provided by IMTA was much higher than that of single mariculture mode. Zhang et al. (2007) showed that the provision, regulating and cultural service value of mariculture in Sanggou Bay was 607 million yuan, and the mariculture activities made great contributions to local social economy and environmental regulation. However, although IMTA mode can bring plenty of benefits, it is still in the initial stage of development. The reasons mainly lie in that the related theory is still insufficient and the management is difficult with high cost, indicating the urgency of further research on IMTA mode (Ma et al., 2016).
In addition, mariculture may also bring some negative impacts (Bath et al., 2023; Krkosek et al., 2007), such as entanglement risk to marine wildlife, obstacles to marine animal migration, and disease spread, etc. These negative impacts can hardly be converted into positive benefits, so it is necessary to construct responsible mariculture policies and strictly supervise and regulate mariculture activities, so as to promote the development of ocean-friendly mariculture (Naylor et al., 2023). For example, mariculture facilities should be set up outside sensitive areas and wildlife migration corridors, in order to reduce entanglement and maintain animal migration. The use of antibiotics, pesticides and harmful chemicals should be strictly supervised, so as to avoid their risks to the ocean and human health, etc.
4.2 Interaction Between Climate Change and Mariculture Activities
Climate change is affecting the production and development of mariculture, of which the influence can be divided into direct and indirect aspects (Maulu et al., 2021): Direct influence refers to the impact of climate change on the metabolism, growth rate, resistance to diseases and toxins and other biophysical characteristics of mariculture species, while indirect influence means that climate change first alters the marine primary productivity, feed supply and the normal mariculture operations, and then affects the mariculture production. Shellfish and seaweed are main providers of mariculture ecosystem services, but climate change has brought a series of impacts on them. The growth of shellfish may be threatened by temperature change, primary production fluctuation, ocean acidification and other multiple threats (Froehlich et al., 2017), and these threats may hinder shellfish's filtering, calcification and other behaviors, thus affecting its water purification and carbon sequestration services. What's more, the growth of seaweed can also be affected by climate change. For example, ocean acidification may lead to the descent of calcified macroalgae's growth rate, but this view has not been appeared as a unified conclusion at present (Kroeker et al., 2010). Seawater temperature change has direct impacts on the metabolism of seaweed, and related phenomenon of seawater stratification can limit the supply of nutrients required for seaweed growth (Chung et al., 2017).
However, mariculture systems are not only victims of climate change, but also potential contributors to climate mitigation. Krause-Jensen and Duarte (2016) figured out that although the carbon sequestration capacity of global cultured seaweed (0.68 TgC/yr) is only 0.4% of wild seaweed (173 TgC/yr), the current area of cultured seaweed is only 0.04% of the wild seaweed and 0.004% of the coastal regions, indicating the great potential to expand seaweed mariculture. Mongin et al. (2016) showed that seaweed mariculture help reduce the impact of ocean acidification on coral reef ecosystems by reducing CO2 concentration in seawater and increasing aragonite saturation (used to describe coral calcification capacity). In addition, ocean warming and stratification caused by global climate change may also lead to ocean deoxidation (Keeling et al., 2010), but seaweed cultivation contributes to oxygen content improvement, thus reducing the impact of anoxia and eutrophication (Duarte et al., 2017). Moreover, seaweed mariculture can also contribute to indirect carbon reduction. On one hand, seaweed converted into biofuels or biogas can be treated as a substitute for fossil fuels (Sondak et al., 2017), and later by combining with the technology of bioenergy with carbon capture and storage (BECCS), it is possible to realize the negative emission of CO2 (Moreira & Pires, 2016). On the other hand, methane emissions can be inhibited by adding certain seaweed into ruminant feed, of which the effectiveness has been proved in some in vitro experiments (Machado et al., 2016). Intergovernmental Panel on Climate Change (IPCC) proposed to include seaweed mariculture in the international carbon accounting framework (IPCC, 2019), and the High-level Panel for a Sustainable Ocean Economy also adopted seaweed mariculture as an ocean-based climate change mitigation strategy (Hoegh-Guldberg et al., 2019). Moreover, seaweed mariculture can also be combined with artificial upwelling, as an ecological-engineering-based climate change adaptation scheme: artificial upwelling driven by green energy such as tidal and wave energy can pump deep nutritious seawater to photic zone, which can not only meet the nutrient and dissolved inorganic carbon need of seaweed photosynthesis, but also alleviate the acidification and anoxia occurring in natural upwelling system (IPCC, 2019).
Shellfish mariculture is also able to contribute to climate change mitigation. Shellfish can sequester carbon in organisms, but the carbon storage cycle depends on how carbon is processed afterward: the biomass carbon for edible purpose will be quickly converted into CO2 (Zhang et al., 2017). However, if shells can be used as building materials, the contained carbon can be stored for a long time, and they can also be used as a substitute for limestone to reduce the carbon emissions associated with limestone mining (Jones et al., 2022). In addition, biodeposition during shellfish growth is more likely to contribute to long-term carbon sequestration (Smaal et al., 2019). However, the respiration and calcification of shellfish will release CO2, which is one of the important reasons why the function of shellfish carbon sink is questioned at present (Zhang et al., 2017). Co-cultivation of shellfish and seaweed helps to reduce CO2 emission in a single shellfish system: seaweed can utilize CO2 released by shellfish through photosynthesis, and its released oxygen can improve the environmental conditions for shellfish growth (Han et al., 2017).
In conclusion, mariculture systems and their services can support climate mitigation and adaptation, but they will also be affected by climate change. However, since many unknowns and uncertainties still lie in their interactions, when it comes to incorporating mariculture and its services into climate mitigation practices, the pace is still slow (Druckenmiller, 2022). Scaling up mariculture activities and enhancing corresponding ecosystem services will not come without costs, and poorly designed plans or assessments can pose a threat to local ecosystems. Therefore, it is necessary to ensure that mariculture-based climate actions are consistent with broader social and ecological goals, and the involved ecosystems must remain healthy and resilient (Fankhauser et al., 2022).
5 Conclusion
- (1)
In terms of different types of mariculture systems in China, the multiple input (MI) performance of shellfish mariculture is obviously lower, while the MI of fish and others mariculture are relatively higher. Under the condition that three ecosystem services (carbon sequestration, water purification and erosion control) are evaluated, only seaweed and shellfish mariculture show ecosystem service multifunctionality (ESM), and the former has a significantly higher ESM value. When only three environmental impacts (GHGs emission, water contamination and coastal erosion) are considered, others-pond mariculture has the highest multiple environmental impacts (MEI), while the MEI of shellfish-raft, shellfish-hanging cage, shellfish-bottom sowing, others-bottom sowing, and fish-deep-water cage mariculture is relatively lower. Besides, seaweed-raft mariculture doesn't show MEI.
- (2)
In terms of mariculture activities in different China coastal regions, the MI of mariculture in Hainan and Tianjin is significantly higher than that in other regions, while that in Liaoning and Shandong is relatively lower. The ESM of mariculture in all regions has positive values except for Tianjin, among which Fujian and Guangxi get the highest and lowest ESM respectively. The MEI of mariculture in Hainan is quite higher than that in other regions, while the MEI in Shandong and Liaoning is lower.
- (3)
By analyzing the performance of two comprehensive mariculture indicators, it can be found that the mariculture systems in China with both total ecological benefit (TEB) and greenness (GN) indicator ranking in the top 50% include others-bottom sowing, seaweed-raft, and shellfish-raft, shellfish-hanging cage, and shellfish-bottom sowing mariculture. The mariculture regions in China with two indicators ranking in the top 50% include Liaoning, Shandong, Jiangsu, and Zhejiang.
- (4)
Offshore mariculture will be paid more attention in the future. By identifying priority areas for offshore mariculture development, ecological benefits can be significantly improved and the environmental impacts can be reduced, using about 27% of China's territorial sea area.
- (5)
Water contamination is one of the most severe negative environmental impacts caused by mariculture activities. However, for most China coastal regions, if integrated multi-trophic aquaculture (IMTA) mode can be promoted and the local cultured species can be properly matched, this ecological burden can be reduced and even converted into ecological benefit. In addition, expanding the scale of seaweed mariculture can also eliminate river N export, thus alleviating coastal eutrophication.
- (6)
Mariculture activities such as seaweed and shellfish mariculture can contribute to climate mitigation, but they will also be affected by climate change. It is necessary to ensure that mariculture-based climate actions are corresponding to broader social and ecological goals, and the involved ecosystems must remain healthy and resilient.
Compared with previous studies, this study comprehensively considered the resource input and associated environmental benefits and impacts in different regions, of different cultured species and cultivation patterns, by means of the Emergy Accounting approach applied to different dimensions of mariculture performance. However, some limitations still exist in this study: due to the lack of basic data and insufficient research, some positive ecosystem services (such as acidification regulation, biodiversity conservation, cultural values, etc.) and negative environmental impacts (such as disease outbreak, benthic environment degradation, biological invasion, etc.) are not yet considered, which may affect the overall benefits of mariculture. In addition, industrial mariculture is another common form, but it was excluded from this study, which may also lead to the underestimation of resource consumption and negative environmental impacts. Moreover, cross-scale issues have not been well discussed in this study, such as regional impacts caused by local systems, and these issues should be carefully considered in the future.
All in all, this study strives to provide new methods and ideas for the overall assessment of mariculture. In the future research, multi-channel data should be combined to make the assessment results refined and dynamic, so as to promote the healthy development of mariculture and the sustainable utilization of marine resources.
Acknowledgments
This paper is supported by the National Natural Science Foundation of China (No. 52070021) and the Fundamental Research Funds for the Central Universities.
What is Your Reaction?
 Like
0
Like
0
 Dislike
0
Dislike
0
 Love
0
Love
0
 Funny
0
Funny
0
 Angry
0
Angry
0
 Sad
0
Sad
0
 Wow
0
Wow
0