


Application of smart technologies for predicting soil erosion patterns – Nature

Executive Summary
This report details a study on the application of advanced data-driven technologies for assessing soil erosion susceptibility, a critical issue directly impacting the achievement of several United Nations Sustainable Development Goals (SDGs). Soil degradation through erosion threatens food security (SDG 2), water quality (SDG 6), and terrestrial ecosystems (SDG 15). By leveraging innovative machine learning models (SDG 9), this research provides a highly accurate and efficient methodology for identifying erosion-prone areas. Four hybrid Artificial Neural Network (ANN) models, optimized with Biogeography-Based Optimization (BBO), Earthworm Optimization Algorithm (EWA), Symbiotic Organisms Search (SOS), and Whale Optimization Algorithm (WOA), were evaluated. The results demonstrate exceptional predictive accuracy, with all models achieving Area Under the Curve (AUC) values exceeding 0.92. The BBO-MLP model proved most effective, with an AUC of 0.999. These findings confirm that optimized ANN models are powerful tools for creating precise erosion susceptibility maps, enabling targeted interventions to combat land degradation and support the goal of a land degradation-neutral world (SDG 15.3).
1.0 Introduction: Soil Erosion and the Sustainable Development Goals
Soil erosion is a significant global environmental challenge that undermines sustainable development. The detachment and movement of soil particles by water and wind lead to land degradation, which has profound consequences for human well-being and planetary health. This report frames the issue of soil erosion and its assessment within the context of the UN Sustainable Development Goals.
1.1 Impact on Key SDGs
- SDG 15 (Life on Land): Soil erosion is a primary driver of land degradation and desertification. Accurate erosion susceptibility mapping is fundamental to achieving Target 15.3, which aims to combat desertification and restore degraded land to achieve a land degradation-neutral world.
- SDG 2 (Zero Hunger): The loss of fertile topsoil reduces agricultural productivity, threatening food security and sustainable farming practices. Protecting soil resources is essential for ending hunger and promoting sustainable agriculture.
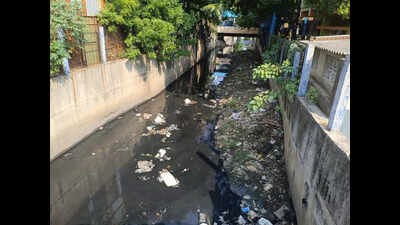
- SDG 6 (Clean Water and Sanitation): Eroded sediment pollutes water bodies, impairs water quality, blocks channels, and harms aquatic ecosystems. Managing erosion is crucial for protecting freshwater resources.
- SDG 9 (Industry, Innovation, and Infrastructure): This study utilizes innovative technologies, specifically advanced machine learning and optimization algorithms, to create resilient and effective environmental management tools, aligning with the goal of fostering innovation.
Traditional methods for assessing erosion are often costly and time-consuming over large areas. Therefore, this study evaluates the efficacy of four novel, data-driven hybrid models to provide an efficient and accurate solution for erosion susceptibility mapping, thereby supporting evidence-based policymaking for sustainable land management.
2.0 Methodology and Data
The study was conducted in Kermanshah Province, Iran, a region susceptible to erosion due to its geography and climate. A robust methodology was employed, integrating geospatial data with advanced computational models to generate high-precision erosion susceptibility maps.
2.1 Database Establishment and Conditioning Factors
Fourteen environmental and geographic criteria, identified as key drivers of soil erosion, were compiled to create a comprehensive database. These factors are crucial for understanding and modeling the physical processes that contribute to land degradation.
- Topographic Factors: Elevation, Slope Degree, Aspect, Plan Curvature, Profile Curvature, Terrain Roughness Index (TRI), Topographic Wetness Index (TWI).
- Hydrological Factors: Rainfall, Distance to River.
- Geological Factors: Geology, Distance from Fault.
- Land Cover & Use Factors: Land Use, Normalized Difference Vegetation Index (NDVI).
- Infrastructural Factors: Distance to Road.
Data was sourced from ASTER DEM, Landsat satellite imagery, and geological maps, and processed using ArcGIS. A balanced inventory of 542 points (271 erosion, 271 non-erosion) was created and split into 70% for training and 30% for testing the models.
2.2 Hybrid Artificial Intelligence Models
The core of this study involved combining an Artificial Neural Network (ANN), specifically a Multi-Layer Perceptron (MLP), with four different metaheuristic optimization algorithms. This approach aims to enhance the predictive accuracy of the ANN by optimizing its internal parameters (weights and biases).
- Biogeography-Based Optimization (BBO-MLP): Inspired by the migration of species between habitats.
- Earthworm Optimization Algorithm (EWA-MLP): Mimics the burrowing and reproduction behavior of earthworms.
- Symbiotic Organisms Search (SOS-MLP): Models the mutualistic, commensal, and parasitic relationships between organisms.
- Whale Optimization Algorithm (WOA-MLP): Based on the bubble-net hunting strategy of humpback whales.
2.3 Performance Evaluation
The performance of each hybrid model was rigorously evaluated using standard statistical metrics to ensure reliability and accuracy, directly supporting the development of credible tools for achieving SDG targets.
- Area Under the ROC Curve (AUC): The primary metric for assessing the model’s ability to distinguish between erosion and non-erosion classes. An AUC value of 1.0 indicates a perfect model, while 0.5 represents random chance.
- Mean Squared Error (MSE) and Mean Absolute Error (MAE): Used to quantify the error between predicted and actual outcomes during model training.
- Taylor Diagrams: Utilized to visually compare the correlation and standard deviation of model outputs against observed data.
3.0 Results and Analysis
The evaluation of the four hybrid models yielded compelling results, demonstrating their high capability in accurately mapping soil erosion susceptibility. The findings underscore the potential of these technologies to support land management decisions aligned with SDG 15.
3.1 Model Performance and Accuracy
All four models performed exceptionally well, with AUC values greater than 0.92 for the testing datasets, indicating a high degree of predictive accuracy. The performance highlights are summarized below:
- BBO-MLP: Emerged as the most accurate model, achieving the highest AUC values of 0.999 in the training phase and 0.9327 in the testing phase.
- SOS-MLP: Demonstrated strong performance with AUC values of 0.9973 (test) and 0.9296 (train).
- WOA-MLP: Showed notable accuracy, with AUC values of 0.9809 (test) and 0.959 (train).
- EWA-MLP: Also proved effective, with AUC values of 0.9304 (train) and 0.9296 (test).
The Taylor diagrams confirmed that the BBO-MLP model had the highest correlation with the observed data, reinforcing its superior performance. The high accuracy across all models validates the use of optimized ANNs for creating reliable erosion susceptibility maps.
3.2 Erosion Susceptibility Mapping
Using the best-performing models, erosion susceptibility maps for the Kermanshah province were generated. These maps classify the region into five risk categories: very low, low, medium, high, and very high. The results identified significant portions of the eastern, northeastern, central, and southern regions as high-risk zones. This spatial identification is a critical first step for prioritizing conservation efforts and implementing targeted land management strategies to prevent further degradation, directly contributing to SDG 15.3.
4.0 Conclusion and Policy Implications for Sustainable Development
This study successfully demonstrated that hybrid artificial intelligence models, particularly the BBO-MLP, are highly effective and reliable tools for predicting soil erosion susceptibility. The high accuracy (AUC > 0.92) of these models provides a significant advancement over traditional assessment methods.
The findings have direct and actionable implications for achieving the Sustainable Development Goals:
- Informing Land Management (SDG 15): The generated susceptibility maps empower policymakers, land managers, and conservationists to identify erosion hotspots with high precision. This allows for the strategic allocation of resources to implement protective measures such as reforestation, terracing, and sustainable agricultural practices, thereby combating desertification and halting land degradation.
- Enhancing Food and Water Security (SDG 2 & SDG 6): By protecting soil in high-risk agricultural areas, these models help maintain soil fertility and productivity, securing food supplies. Concurrently, preventing sediment runoff protects water quality in rivers and reservoirs, ensuring cleaner water for communities and ecosystems.
- Promoting Technological Innovation (SDG 9): This research showcases the successful application of smart technologies to address complex environmental problems. It encourages further investment in AI-driven solutions for environmental monitoring and management, fostering a culture of innovation for sustainability.
In conclusion, the integration of optimization algorithms with Artificial Neural Networks offers a powerful, cost-effective, and scalable framework for soil erosion assessment. Adopting these technologies is a critical step towards achieving a land degradation-neutral world and ensuring a sustainable future for all.
Analysis of Sustainable Development Goals (SDGs) in the Article
Which SDGs are addressed or connected to the issues highlighted in the article?
-
SDG 2: Zero Hunger
The article connects soil erosion directly to agricultural productivity. It states that “Soil erosion poses a significant environmental problem that negatively affects agricultural output” and leads to the “loss of nutrients and organic matter in the soil, ultimately reducing soil fertility.” By developing methods to assess and manage soil erosion, the study contributes to maintaining soil quality, which is essential for sustainable agriculture and food security.
-
SDG 6: Clean Water and Sanitation
The article highlights the impact of soil erosion on water resources. It mentions that “soil erosion increases water contamination levels, blocks water channels, and jeopardizes wildlife habitats.” The research on predicting erosion susceptibility helps in identifying high-risk areas, which is a crucial first step in implementing measures to prevent soil runoff into water bodies, thereby protecting water quality.
-
SDG 9: Industry, Innovation, and Infrastructure
This goal is addressed through the article’s core methodology. The study focuses on applying “smart technologies” and “advanced computational intelligence models” such as Artificial Neural Networks (ANN) combined with optimization algorithms (BBO, EWA, SOS, WOA) to solve a complex environmental problem. This represents an enhancement of “scientific research” and an upgrade of “technological capabilities” for better natural resource management, which is central to SDG 9.
-
SDG 15: Life on Land
This is the most directly relevant SDG. The entire article is focused on “soil erosion susceptibility assessment” to combat “land degradation.” It explicitly states that soil is a “critical natural resource” and that accurate assessment is “vital for the optimal management and development of soil resources” and for creating “long-term conservation plans.” The study aims to protect terrestrial ecosystems by providing tools to halt and reverse land degradation.
What specific targets under those SDGs can be identified based on the article’s content?
-
SDG 15: Life on Land
-
Target 15.3: By 2030, combat desertification, restore degraded land and soil, including land affected by desertification, drought and floods, and strive to achieve a land degradation-neutral world.
Explanation: The study’s primary objective is to assess “erosion susceptibility” to prevent “land degradation.” The development of “erosion susceptibility mapping” is a direct tool to help achieve a land degradation-neutral world by identifying areas needing intervention and conservation efforts.
-
Target 15.9: By 2020, integrate ecosystem and biodiversity values into national and local planning, development processes, poverty reduction strategies and accounts.
Explanation: The creation of an “erosion susceptibility map (ESM)” is a practical method for integrating environmental data into regional planning. The article notes that “zoning and management of soil resources are essential,” especially for provinces dependent on agriculture, demonstrating how such tools can be used in local development planning.
-
Target 15.3: By 2030, combat desertification, restore degraded land and soil, including land affected by desertification, drought and floods, and strive to achieve a land degradation-neutral world.
-
SDG 2: Zero Hunger
-
Target 2.4: By 2030, ensure sustainable food production systems and implement resilient agricultural practices that increase productivity and production, that help maintain ecosystems… and that progressively improve land and soil quality.
Explanation: The article emphasizes that soil erosion “negatively affects agricultural output” and “reduc[es] soil fertility.” By providing a method to manage erosion, the research supports the implementation of practices that improve soil quality, which is fundamental for sustainable food production.
-
Target 2.4: By 2030, ensure sustainable food production systems and implement resilient agricultural practices that increase productivity and production, that help maintain ecosystems… and that progressively improve land and soil quality.
-
SDG 6: Clean Water and Sanitation
-
Target 6.3: By 2030, improve water quality by reducing pollution…
Explanation: The article states that soil erosion “increases water contamination levels.” The models developed in the study can identify areas with high erosion potential, which are the primary sources of sediment pollution in rivers. Managing these areas helps reduce non-point source pollution and improve water quality.
-
Target 6.3: By 2030, improve water quality by reducing pollution…
-
SDG 9: Industry, Innovation, and Infrastructure
-
Target 9.5: Enhance scientific research, upgrade the technological capabilities of industrial sectors in all countries, in particular developing countries…
Explanation: The research is a clear example of enhancing scientific research by applying “four advanced computational intelligence models” and “machine learning algorithms” to environmental management. The study, conducted in Iran, demonstrates the use of innovative technology to address a local and global challenge, directly aligning with this target.
-
Target 9.5: Enhance scientific research, upgrade the technological capabilities of industrial sectors in all countries, in particular developing countries…
Are there any indicators mentioned or implied in the article that can be used to measure progress towards the identified targets?
-
Indicators for SDG 15 (Target 15.3)
The official indicator is 15.3.1 (Proportion of land that is degraded over total land area). The article provides direct inputs and data for this indicator:
- Erosion Susceptibility Maps (ESMs): The final output of the study is a set of maps that classify land into five categories of erosion risk (“very low, low, medium, high, and very high”). These maps are a direct tool for quantifying the proportion of degraded or at-risk land.
- Rate of Soil Loss: The article mentions a specific quantitative measure for the study area: “Kermanshah province… loses 12 tons per hectare of soil annually in erosion.” This is a direct indicator of the severity of land degradation.
-
Indicators for SDG 2 (Target 2.4)
The article uses input factors that serve as proxies for agricultural health and soil quality:
- Normalized Difference Vegetation Index (NDVI): This is one of the fourteen key factors used in the models. The article states that “The NDVI provides a quantitative measure of vegetation density and health.” NDVI is a widely used proxy indicator for agricultural productivity and land quality.
-
Indicators for SDG 6 (Target 6.3)
The article implies indicators related to water pollution from non-point sources:
- Sediment Yield and Suspended Materials: While not directly measured, the article’s literature review mentions the use of ANN models for “sediment transport prediction” and estimating “suspended materials.” The erosion models presented are designed to predict the source of these pollutants, which are key indicators of water quality.
-
Indicators for SDG 9 (Target 9.5)
The study itself and its performance metrics serve as indicators of technological advancement:
- Model Performance Metrics: The article extensively uses metrics like “Area Under the ROC Curve (AUC),” “mean square error (MSE),” and “mean absolute error (MAE)” to evaluate the accuracy of the new technologies. The high AUC values (e.g., “exceeding 0.92 to 0.99 percent”) serve as a quantitative indicator of the effectiveness and advancement of the proposed innovative models.
- Application of Advanced Algorithms: The use and successful application of “optimized artificial neural network” models (BBO-MLP, EWA-MLP, SOS-MLP, WOA-MLP) is an indicator of upgraded technological capability in the field of environmental science.
Table of SDGs, Targets, and Indicators
| SDGs | Targets | Indicators Identified in the Article |
|---|---|---|
| SDG 15: Life on Land | 15.3: Combat desertification, restore degraded land and soil… and strive to achieve a land degradation-neutral world. | Erosion susceptibility maps classifying land into risk zones; Quantitative rate of soil loss (e.g., “12 tons per hectare of soil annually”). |
| SDG 2: Zero Hunger | 2.4: Ensure sustainable food production systems and implement resilient agricultural practices… that progressively improve land and soil quality. | Normalized Difference Vegetation Index (NDVI) used as an input factor to measure vegetation health, a proxy for soil quality and agricultural productivity. |
| SDG 6: Clean Water and Sanitation | 6.3: Improve water quality by reducing pollution… | Modeling of erosion as the source of water contamination; Implied indicators of sediment yield and suspended materials. |
| SDG 9: Industry, Innovation, and Infrastructure | 9.5: Enhance scientific research, upgrade the technological capabilities… | Development and application of advanced computational models (ANN, BBO-MLP, etc.); Model performance metrics (AUC, MSE, MAE) as a measure of technological efficacy. |
Source: nature.com

What is Your Reaction?
 Like
0
Like
0
 Dislike
0
Dislike
0
 Love
0
Love
0
 Funny
0
Funny
0
 Angry
0
Angry
0
 Sad
0
Sad
0
 Wow
0
Wow
0