


:focal(1500,1000)/https://media.globalcitizen.org/a6/9a/a69a4720-d8a1-4715-b596-18738d03c05c/rotary_polio_hero_image.jpg?#)


/countries/sri-lanka/photo-credit---dmc-sri-lanka.tmb-1200v.jpg?sfvrsn=dc298bcc_1#)


Where America’s CO emissions come from – what you need to know, in charts – The Conversation

Report on Carbon Dioxide Emissions and Alignment with Sustainable Development Goals
Introduction
Atmospheric carbon dioxide (CO2) is essential for life, facilitating photosynthesis and maintaining a habitable global temperature. However, since the industrial revolution, anthropogenic activities have increased atmospheric CO2 concentrations by over 50%, reaching levels unprecedented in at least a million years. This rapid increase poses a significant threat to global environmental stability and directly challenges the achievement of the United Nations Sustainable Development Goals (SDGs), particularly SDG 13 (Climate Action).
Impact of Elevated CO2 Concentrations on Sustainable Development
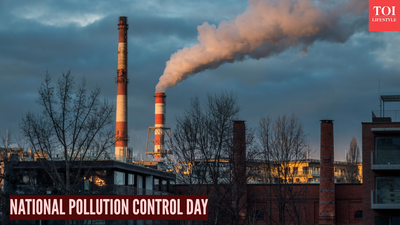
The accumulation of excess CO2 in the atmosphere is the primary driver of global warming. This phenomenon triggers a cascade of environmental changes that undermine progress across multiple SDGs.
Threats to Key SDGs
- SDG 13 (Climate Action): Rising temperatures accelerate the water cycle, leading to an increased frequency and intensity of extreme weather events such as floods, droughts, heat waves, and hurricanes.
- SDG 14 (Life Below Water): The ocean absorbs a significant portion of atmospheric CO2, causing ocean acidification. This process harms marine organisms, including species vital to the marine food web, thereby threatening marine biodiversity and ecosystems.
- SDG 15 (Life on Land): Climate change contributes to conditions conducive to wildfires and disrupts terrestrial ecosystems. While forests act as carbon sinks, their capacity is insufficient to offset current emission levels.
- SDG 11 (Sustainable Cities and Communities): Sea-level rise, resulting from melting glaciers and the thermal expansion of ocean water, poses a direct threat to coastal communities and infrastructure.
Analysis of Anthropogenic CO2 Emission Sources in the United States
The primary source of additional CO2 is the combustion of fossil fuels, an activity fundamentally at odds with the objectives of SDG 7 (Affordable and Clean Energy) and SDG 12 (Responsible Consumption and Production). In 2022, the U.S. emitted 5,053 million metric tons of CO2, with fossil fuel combustion accounting for 93% of this total.
Sectoral Breakdown of U.S. CO2 Emissions (2022 Data)
- Transportation: 35%
- Electric Power Generation: 30%
- Industrial Sector: 16%
- Residential Buildings: 7%
- Commercial Buildings: 5%
Fossil Fuel Consumption by Sector
- Transportation: This sector is overwhelmingly dependent on petroleum products such as gasoline and diesel fuel.
- Power Generation: This sector utilizes a combination of coal and natural gas. A recent trend shows a shift from coal to natural gas, driven by the expansion of the shale gas industry. This transition has implications for the clean energy targets outlined in SDG 7.
Trends in U.S. Emissions and Progress Towards SDG 7 and SDG 13
Emission Reduction and Decoupling from Economic Growth
U.S. CO2 emissions peaked in 2005 at 6,217 million metric tons and have since shown a slow decline. This trend is partially attributable to the replacement of coal with natural gas and improvements in energy efficiency, which aligns with a key target of SDG 7. The U.S. economy has demonstrated an increased ability to grow while decreasing emissions. Furthermore, U.S. forests contribute to climate mitigation by removing approximately 920 million metric tons of CO2 in 2022, supporting SDG 15 (Life on Land).
The Role of Renewable Energy
The expansion of solar and wind energy generation represents significant progress towards SDG 7 (Affordable and Clean Energy). These sources have become cost-competitive with fossil fuels and produce virtually no CO2 emissions. However, future progress is subject to challenges, including shifting federal policies on energy subsidies and increasing electricity demand from new sources like data centers. How this new demand is met will be critical for future progress on SDG 13.
Global Context and International Responsibility
Comparative Emissions Analysis
A global perspective is essential for addressing climate change, a core principle of SDG 13.
- In 2022, the U.S. was the world’s second-largest emitter of CO2, following China.
- Cumulatively, the U.S. has emitted more CO2 into the atmosphere than any other nation in history.
- On a per capita basis, U.S. emissions remain significantly higher than those of most other industrialized nations, including China and European countries.
The global distribution of greenhouse gases means that emissions from industrialized nations have a worldwide climate impact, affecting developing countries that have contributed least to the problem.
Conclusion and Recommendations for SDG Alignment
While the U.S. has demonstrated some positive trends in emission reduction and the adoption of renewable energy, substantial and accelerated action is required across all sectors to meet the goals of SDG 13 (Climate Action). The long atmospheric lifetime of CO2 means that current emissions will influence the global climate for centuries. Therefore, immediate and decisive policy and technological shifts towards sustainable energy systems, as envisioned in SDG 7, are imperative to mitigate the long-term impacts of climate change and ensure a sustainable future for all.
Analysis of SDGs, Targets, and Indicators
1. Which SDGs are addressed or connected to the issues highlighted in the article?
- SDG 13: Climate Action: The entire article is centered on the causes and effects of increased atmospheric CO2, the primary driver of climate change. It discusses rising temperatures, extreme weather events (floods, droughts, wildfires, hurricanes), and the urgent need to reduce emissions.
- SDG 7: Affordable and Clean Energy: The article explicitly identifies the combustion of fossil fuels (coal, oil, natural gas) for electricity generation and transportation as the main source of CO2 emissions. It contrasts this with the growth of clean, renewable energy sources like solar and wind.
- SDG 14: Life Below Water: The text directly mentions the impact of CO2 on marine ecosystems, stating that the ocean absorbs CO2, “making the water increasingly acidic, which can harm species crucial to the marine food chain.”
- SDG 15: Life on Land: The article highlights the role of forests in mitigating climate change by mentioning that “U.S. forests are removing CO2 from the atmosphere.” It also notes the increasing frequency of wildfires, which impacts terrestrial ecosystems.
- SDG 12: Responsible Consumption and Production: The article touches upon this goal by discussing the high per capita CO2 emissions in the U.S. compared to other nations, reflecting consumption patterns. It also notes that the U.S. economy has become more energy-efficient, which is a key aspect of sustainable production.
- SDG 11: Sustainable Cities and Communities: By identifying transportation as the largest source of CO2 emissions in the U.S. (35%), the article implicitly addresses the need for sustainable transportation systems within communities and cities.
2. What specific targets under those SDGs can be identified based on the article’s content?
- Target 13.2: Integrate climate change measures into national policies, strategies and planning. The article discusses U.S. national trends in emissions, the policy-driven shift from coal to natural gas, and the impact of federal support (or lack thereof) for renewable energy, all of which are components of national climate strategy.
- Target 7.2: By 2030, increase substantially the share of renewable energy in the global energy mix. The article directly addresses this by highlighting that solar and wind energy generation has “grown steadily in recent years” and that increasing reliance on these sources will “dramatically reduce its CO2 emissions.”
- Target 7.3: By 2030, double the global rate of improvement in energy efficiency. This target is reflected in the statement that “the U.S. economy has become more energy efficient over time, increasing productivity while decreasing emissions.”
- Target 14.3: Minimize and address the impacts of ocean acidification. The article directly identifies the problem this target aims to solve by stating that ocean absorption of CO2 leads to the water becoming “increasingly acidic.”
- Target 15.2: Promote the implementation of sustainable management of all types of forests… and substantially increase afforestation and reforestation. The article’s mention of U.S. forests removing and storing significant amounts of CO2 relates to the goal of managing forests for their carbon sequestration benefits.
3. Are there any indicators mentioned or implied in the article that can be used to measure progress towards the identified targets?
- Atmospheric CO2 concentration: The article states that the concentration has “risen by more than 50% since industries began burning coal” and “continues to rise.” This is a primary indicator of climate change.
- Total greenhouse gas emissions: The article provides precise data, such as the U.S. emitting “5,053 million metric tons of CO2… in 2022″ and China emitting “about 12,000 million metric tons.” This directly corresponds to official indicators for tracking national emissions.
- CO2 emissions per capita: The analysis points out that the U.S. “still emit more CO2 per person than most other industrialized nations,” which is a key comparative indicator for consumption patterns.
- Share of renewable energy: The article mentions that solar and wind are a “modest fraction of total energy production” but have “grown steadily.” This implies the use of renewable energy share as a metric for progress in clean energy transition.
- CO2 emissions by economic sector: The article provides a detailed breakdown of U.S. emissions: “35%… from transportation, 30% from the generation of electric power, and 16%… from industrial.” This sectoral data is crucial for targeted emission reduction policies.
- Carbon sequestration by forests: A specific figure is given: “U.S. forests removed and stored about 920 million metric tons of CO2 in 2022.” This quantifies the role of forests in the national carbon budget.
- Ocean acidification: While not providing a specific pH value, the article’s mention of the ocean becoming “increasingly acidic” implies the measurement of marine acidity as an indicator of environmental health.
Summary Table of SDGs, Targets, and Indicators
| SDGs | Targets | Indicators |
|---|---|---|
| SDG 13: Climate Action | 13.2: Integrate climate change measures into national policies, strategies and planning. |
|
| SDG 7: Affordable and Clean Energy |
7.2: Increase substantially the share of renewable energy. 7.3: Double the global rate of improvement in energy efficiency. |
|
| SDG 14: Life Below Water | 14.3: Minimize and address the impacts of ocean acidification. |
|
| SDG 15: Life on Land | 15.2: Promote the implementation of sustainable management of all types of forests. |
|
| SDG 12: Responsible Consumption and Production | (Implied) Targets related to resource efficiency and decoupling economic growth from environmental degradation. |
|
| SDG 11: Sustainable Cities and Communities | (Implied) 11.2: Provide access to safe, affordable, accessible and sustainable transport systems for all. |
|
Source: theconversation.com

What is Your Reaction?
 Like
0
Like
0
 Dislike
0
Dislike
0
 Love
0
Love
0
 Funny
0
Funny
0
 Angry
0
Angry
0
 Sad
0
Sad
0
 Wow
0
Wow
0