


Kauai beaches among hardest hit by marine debris crisis – The Garden Island Newspaper
Report on Marine Debris Crisis in Kauai and its Implications for Sustainable Development Goals
Executive Summary
In 2024, the island of Kauai experienced an unprecedented influx of marine debris, accounting for over 44% of all trash collected by the Surfrider Foundation nationwide. This report analyzes the scale of the crisis, its primary causes, and its severe impact on marine ecosystems, framing the issue within the context of the United Nations Sustainable Development Goals (SDGs). The findings underscore an urgent need for systemic policy changes and international cooperation to address marine pollution at its source, aligning with SDG 14 (Life Below Water), SDG 12 (Responsible Consumption and Production), and SDG 17 (Partnerships for the Goals).
I. Scale of the Marine Debris Crisis: A Challenge to SDG 14
A. National and State-Level Data
Data from the Surfrider Foundation’s 2024 beach cleanups reveal a significant environmental challenge, directly undermining efforts to achieve SDG 14 (Life Below Water), particularly Target 14.1, which aims to prevent and significantly reduce marine pollution. Of the 365,000 pounds of trash collected nationally, Hawaii accounted for a disproportionate share.
- Total U.S. Collection: 365,000 pounds
- Total Hawaii Collection: 172,564 pounds (47% of national total)
- Total Kauai Collection: 162,000 pounds (94% of Hawaii total)
B. Top Heaviest Cleanup Sites
Kauai’s beaches featured prominently among the most polluted sites in the nation, indicating localized hotspots of severe debris accumulation.
- Ocean Shores, WA: 65,343 lbs
- Ormond Beach, CA: 6,000 lbs
- Kitchens Beach, Kauai: 3,715 lbs
- Mahaulepu Beach, Kauai: 3,600 lbs
- Damariscove Island, ME: 3,220 lbs
- Twin Harbors State Park, WA: 3,153 lbs
- Little Damariscove Island, ME: 2,931 lbs
- Little Drisko Island, ME: 2,523 lbs
- Adam’s St., Long Beach, CA: 2,331 lbs
- Anahola Net Cove, Kauai: 2,190 lbs
II. Causal Factors: Unsustainable Production and Consumption (SDG 12)
A. Geographic and Oceanographic Drivers
Kauai’s position as the northernmost major Hawaiian island places it in the direct path of ocean currents, including those carrying debris from the Great Pacific Garbage Patch. This geographic vulnerability highlights how failures in global waste management directly impact local ecosystems.
B. Composition and Origin of Debris
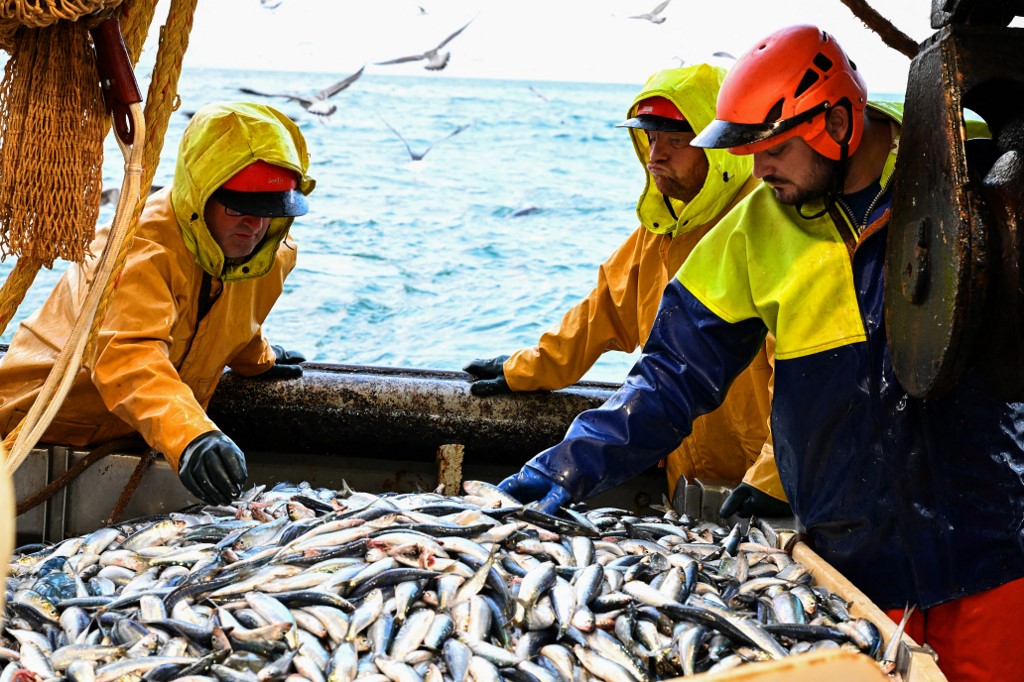
The nature of the debris underscores a global failure in achieving SDG 12 (Responsible Consumption and Production). Over 75% of the debris by weight on Kauai is derelict fishing gear, or “ghost nets,” originating primarily from large-scale international fisheries in Asia. This points to unsustainable production patterns and a lack of producer responsibility in the global fishing industry. The prevalence of plastic fragments, which constitute 83% of all items collected by Surfrider nationally, further demonstrates the global overreliance on unsustainable materials.
III. Impacts on Marine Ecosystems and Biodiversity (SDG 14)
The influx of marine debris poses a direct and lethal threat to marine life, representing a critical failure to protect ocean health as mandated by SDG 14. The International Whaling Commission estimates that 300,000 marine mammals die annually from entanglement in ghost fishing gear.
- Entanglement and Ingestion: Large net masses entangle on coral reefs and threaten endangered species, including Hawaiian monk seals and honu (green sea turtles).
- Documented Fatalities: In 2023, a deceased sperm whale washed ashore on Kauai with fishing nets and eel traps in its stomach.
- Specific Threats: The North Pacific Hagfish/Eel Trap Project was launched to address thousands of plastic trap entrances washing ashore, which pose a specific threat to monk seal pups.
IV. Community Action and Partnerships for the Goals (SDG 11 & SDG 17)
A. Volunteer-Driven Cleanup Efforts
Despite the scale of the problem, cleanup efforts on Kauai remain primarily volunteer-driven, demonstrating a powerful commitment to SDG 11 (Sustainable Cities and Communities) by fostering local environmental stewardship. In 2024, 5,615 volunteers, including 444 local children, dedicated 6,424 hours to beach cleanups.
B. Strategic Community Programs
Local initiatives exemplify the power of SDG 17 (Partnerships for the Goals), where community groups collaborate to create targeted solutions.
- Net Patrol: Established in 2006, this program focuses on the rapid removal of derelict fishing nets before they are washed back out to sea.
- North Pacific Hagfish/Eel Trap Project: A partnership with University of Hawaii at Hilo students to trace the origins of fishing traps, combining community action with academic research.
V. Statewide Perspectives and Contributing Factors
A. Debris Patterns on Other Islands
While Kauai faces a crisis driven by international fishing gear, other islands grapple with pollution linked more closely to local and tourism-related activities, highlighting different facets of the challenge to SDG 11 and SDG 12.
- Maui: Debris is dominated by plastic fragments, cigarette butts, and food wrappers. Volunteerism is rising, but some cleanup sites are inaccessible due to social issues.
- Oahu: The most common items are cigarette butts. Pollution is exacerbated by urban runoff and high tourism levels, with waterways like the Ala Wai Canal acting as major conduits for pollution.
VI. Policy Recommendations for Systemic Change
A. Moving Beyond Cleanups
Stakeholders emphasize that cleanups are a temporary solution and that achieving long-term sustainability requires addressing the root causes of pollution. This aligns with the preventative principles of the SDGs.
B. Advocating for Source Reduction Policies
Surfrider Foundation advocates for policy solutions that advance SDG 12 by fundamentally altering production and consumption patterns.
- Extended Producer Responsibility (EPR): Legislation to make manufacturers financially responsible for the lifecycle of their products, including cleanup costs.
- Plastic Reduction Laws: Policies such as “Skip the Stuff” to reduce single-use plastic items and strengthening bans on plastic bags.
- International Cooperation: A call for state, federal, and international collaboration, essential for fulfilling the vision of SDG 17, to stop transboundary plastic pollution at its source.
Which SDGs are addressed or connected to the issues highlighted in the article?
-
SDG 14: Life Below Water
This is the most prominent SDG in the article. The entire text focuses on the marine debris crisis, its impact on ocean ecosystems, the threat to marine wildlife like whales, turtles, and seals, and the efforts to clean up coastlines and protect coral reefs.
-
SDG 12: Responsible Consumption and Production
The article connects the debris problem to its source, highlighting that 83% of collected items are plastic. It discusses policy solutions like Extended Producer Responsibility (EPR), plastic reduction laws (“Skip the Stuff”), and plastic bag bans, which directly target production and consumption patterns to reduce waste generation.
-
SDG 17: Partnerships for the Goals
The article emphasizes the collaborative nature of the cleanup efforts. It details the work of the Surfrider Foundation, a civil society organization, and its partnerships with community volunteers, school groups, university students (University of Hawaii at Hilo), and other NGOs (Malama Maui Nui, Pacific Whale Foundation). It also calls for state, federal, and international cooperation.
-
SDG 11: Sustainable Cities and Communities
The article links marine debris to land-based activities in populated areas. It mentions that tourism and urban development contribute to pollution through commercial runoff, citing the Ala Wai Canal on Oahu as an example. This relates to managing waste and the environmental impact of cities and communities.
What specific targets under those SDGs can be identified based on the article’s content?
-
SDG 14: Life Below Water
-
Target 14.1: By 2025, prevent and significantly reduce marine pollution of all kinds, in particular from land-based activities, including marine debris and nutrient pollution.
The article is centered on this target. It extensively documents the problem of marine debris, particularly plastics and derelict fishing gear, on Kauai’s beaches. The cleanup efforts by the Surfrider Foundation and volunteers are a direct action towards reducing existing marine pollution.
-
Target 14.2: By 2020, sustainably manage and protect marine and coastal ecosystems to avoid significant adverse impacts…
The article highlights the goal of the Net Patrol program to remove nets “before tides could sweep them back into the ocean, where they threaten marine life and coral reefs.” This shows a clear intent to protect coastal ecosystems from the adverse impacts of debris.
-
Target 14.c: Enhance the conservation and sustainable use of oceans and their resources by implementing international law…
The article implies the need for this target by stating that the derelict fishing nets are not local but come from Asia and that debris from the Great Pacific Garbage Patch is pushed towards Hawaii. The call for “state, federal, and international cooperation to stop plastic pollution at the source” directly supports the implementation of broader, international solutions.
-
-
SDG 12: Responsible Consumption and Production
-
Target 12.5: By 2030, substantially reduce waste generation through prevention, reduction, recycling and reuse.
This target is addressed through the article’s discussion of policy solutions beyond cleanups. Surfrider’s advocacy for “Extended Producer Responsibility legislation,” “plastic reduction laws like ‘Skip the Stuff,’ strengthening plastic bag bans, and passing balloon release prohibitions” are all measures aimed at preventing waste at its source.
-
-
SDG 11: Sustainable Cities and Communities
-
Target 11.6: By 2030, reduce the adverse per capita environmental impact of cities, including by paying special attention to… municipal and other waste management.
The article connects increased visitor activity and urban development on Oahu to more pollution entering waterways, specifically mentioning the Ala Wai Canal. This points to the challenge of managing waste generated by urban and tourist activities to reduce the environmental impact on surrounding marine environments.
-
-
SDG 17: Partnerships for the Goals
-
Target 17.17: Encourage and promote effective public, public-private and civil society partnerships…
The entire cleanup effort described is a model of this target. The article details the work of the Surfrider Foundation (civil society) mobilizing volunteers (public), partnering with schools, and collaborating with the University of Hawaii at Hilo (public-private/academic) on a data project. The mention of working with other groups like Malama Maui Nui and Pacific Whale Foundation further exemplifies these partnerships.
-
Are there any indicators mentioned or implied in the article that can be used to measure progress towards the identified targets?
-
For SDG 14 (Life Below Water)
-
Indicator 14.1.1b (Plastics debris density):
The article is rich with quantitative data that serves as a direct measure for this indicator. Specific examples include:
- Total weight of trash collected by Surfrider in 2024: 365,000 pounds nationally, 172,564 pounds in Hawaii, and over 162,000 pounds from Kauai.
- Weight from specific cleanups: 3,715 pounds at Kitchens Beach, 3,600 pounds at Mahaulepu Beach.
- Debris composition: “more than 75% of the debris by weight on Kauai consists of derelict fishing gear,” and “83% of items collected during Surfrider beach cleanups were plastic.”
- Number of specific items removed: 6,400 hagfish/eel trap entrances removed in 2021.
-
Wildlife Impact Data:
The article provides data on the impact on marine life, which can serve as an indicator of ecosystem health. This includes the estimate that “300,000 marine mammals die annually from entanglement” and specific local incidents like the “dead sperm whale washed ashore at Lydgate Park with nets and eel traps in its stomach.” Tracking the frequency of such events can measure the severity of the problem.
-
-
For SDG 17 (Partnerships for the Goals)
-
Volunteer Engagement Metrics:
The article provides specific numbers that measure the scale of civil society participation, a key component of partnerships. These include:
- Kauai in 2024: 5,615 volunteers and 6,424 person-hours.
- Maui from 2019 to mid-2025: 2,326 volunteers participating in 48 cleanups.
-
-
For SDG 12 (Responsible Consumption and Production)
-
Policy Implementation and Enforcement:
While not a quantitative metric, the article implies an indicator by mentioning “enforcement gaps in policies like Bill 40 — which restricts polystyrene and disposable plastics.” The successful implementation and enforcement of such source-reduction policies would be a key indicator of progress toward Target 12.5.
-
SDGs, Targets, and Indicators from the Article
| SDGs | Targets | Indicators Mentioned or Implied in the Article |
|---|---|---|
| SDG 14: Life Below Water | 14.1: Reduce marine pollution of all kinds, especially from land-based activities and marine debris. |
|
| 14.2: Protect and restore marine and coastal ecosystems. |
|
|
| SDG 12: Responsible Consumption and Production | 12.5: Substantially reduce waste generation through prevention and reduction. |
|
| SDG 11: Sustainable Cities and Communities | 11.6: Reduce the adverse per capita environmental impact of cities, including waste management. |
|
| SDG 17: Partnerships for the Goals | 17.17: Encourage and promote effective public, public-private and civil society partnerships. |
|
Source: thegardenisland.com

What is Your Reaction?
 Like
0
Like
0
 Dislike
0
Dislike
0
 Love
0
Love
0
 Funny
0
Funny
0
 Angry
0
Angry
0
 Sad
0
Sad
0
 Wow
0
Wow
0