


Managing nitrogen for sustainable development
Improvements in nitrogen use efficiency in crop production are critical for addressing the triple challenges of food security, environmental degradation and climate change. Such improvements are conditional not only on technological innovation, but also on socio-economic factors that are at present poorly understood. Here we examine historical patterns of agricultural nitrogen-use efficiency and find a broad range of national approaches to agricultural development and related pollution. We analyse examples of nitrogen use and propose targets, by geographic region and crop type, to meet the 2050 global food demand projected by the Food and Agriculture Organization while also meeting the Sustainable Development Goals pertaining to agriculture recently adopted by the United Nations General Assembly. Furthermore, we discuss socio-economic policies and technological innovations that may help achieve them.
Main
More than half the world’s people are nourished by crops grown with synthetic nitrogen (N) fertilizers, which were made possible in the early twentieth century by the invention of the Haber–Bosch process, which reduces atmospheric nitrogen gas (N2) to reactive forms of N (ref. 1). A reliable supply of N and other nutrients essential for plant growth has allowed farmers to increase crop production per unit land greatly over the past century, thus promoting economic development, allowing larger populations, and sparing forests that would probably otherwise have been converted to agriculture to meet food demand2. Despite this progress, nearly one billion people remain undernourished3. In addition, the global population will increase by two to three billion by 2050, implying that demands for N fertilizers and agricultural land are likely to grow substantially2,4. Although there are many causes of undernourishment and poverty, careful N management will be needed to nourish a growing population while minimizing adverse environmental and health impacts.
Unfortunately, unintended adverse environmental and human health impacts result from the escape of reactive N from agricultural soils, including groundwater contamination, eutrophication of freshwater and estuarine ecosystems, tropospheric pollution related to emissions of nitrogen oxides and ammonia gas, and accumulation of nitrous oxide, a potent greenhouse gas that depletes stratospheric ozone5,6,7,8,9 (Fig. 1). Some of these environmental consequences, such as climate change and tropospheric ozone pollution, can also negatively affect crop yields10,11 and human health12. Hence, too little N means lower crop productivity, poor human nutrition and soil degradation13, but too much N leads to environmental pollution and its concomitant threats to agricultural productivity, food security, ecosystem health, human health and economic prosperity.

Inputs to agriculture are shown as blue arrows and harvest output as a green arrow. NUE is defined as the ratio of outputs (green) to inputs (blue) (i.e. NUE = Nyield/Ninput). The difference between inputs and outputs is defined as Nsur, which is shown here as orange arrows for N losses to the environment and as N recycling within the soil (grey box) (that is, Nsur = Ninput − Nyield). Abbreviations: ammonia (NH3), nitrogen oxides (NOx), nitrous oxide (N2O), dinitrogen gas (N2), ammonium (NH4+), nitrate (NO3−), dissolved organic nitrogen (DON) and particulate organic nitrogen (PON).
Improving nitrogen-use efficiency (NUE)—that is, the fraction of N input harvested as product—is one of the most effective means of increasing crop productivity while decreasing environmental degradation14,15. Indeed, NUE has been proposed as an indicator for assessing progress in achieving the Sustainable Development Goals recently accepted by 193 countries of the United Nations General Assembly16. Fortunately, we have a large and growing knowledge base and technological capacity for managing N in agriculture17, and awareness is growing among both agricultural and environmental stakeholder groups that N use is both essential and problematic15. This growing awareness, combined with ongoing advances in agricultural technology, is creating a possible turning point at which knowledge-based N management could advance substantially throughout the world. However, improving NUE requires more than technical knowledge. The cultural, social and economic incentives for and impediments to farmer adoption of NUE technologies and best management practices need to be better understood15.
Here we analyse historical patterns (1961–2011) of agricultural N use in 113 countries to demonstrate a broad range of pathways of socio-economic development and related N pollution. Our analysis suggests that many countries show a pattern similar to an environmental Kuznets curve (EKC), in which N pollution first increases and then decreases with economic growth18,19,20,21. So far, most EKC analyses have focused on pollution from industrial and transportation sectors19,22,23; the present study is one of a few that consider agricultural N pollution in the EKC context24,25, and apply it globally. However, patterns of N pollution are neither automatic nor inevitable. Socio-economic circumstances and policies vary widely among countries, affecting factors such as fertilizer to crop price ratios and crop mixes, which, as our analysis shows, influence the turning points of the EKC. Although technological and socio-economic opportunities for NUE improvement vary regionally, our analysis shows that average global NUE in crop production needs to improve from ~0.4 to ~0.7 to meet the dual goals of food security and environmental stewardship in 2050.
Patterns of nitrogen pollution
As a useful indicator of potential losses of N to the environment from agricultural soils26,27, N surplus (Nsur; in units of kg N ha−1 yr−1) is defined as the sum of N inputs (fertilizer, manure, biologically fixed N, and N deposition) minus N outputs28,29 (the N removed within the harvested crop products, Nyield; Fig. 1). Some of the Nsur recycles within the soil, but most Nsur is lost to the environment over the long term, because the difference between annual inputs and outputs is usually large relative to changes in soil N stocks. The related term of NUE, also called the output–input ratio of N, is mathematically defined as the dimensionless ratio of the sum of all N removed in harvest crop products (outputs or Nyield) divided by the sum of all N inputs to a cropland30,31 (Fig. 1). The Nsur, NUE and Nyield terms can serve as environmental pollution, agricultural efficiency, and food security targets32,33, respectively, which are inherently interconnected through their mathematical definitions33 (that is, 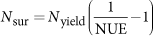 , see Supplementary Information section 1 for more information) and their real-world consequences (Fig. 1).
Variable turning points on the EKC
As an indicator of the extent of environmental degradation, Nsur aggregated to a national average for all crops is closely related to income growth, mainly in two contrasting pathways as follows. On the one hand, increasing income enables demand for more food consumption33, which can increase both the land area devoted to agriculture and the intensity of agricultural production and consequently results in more N lost to the environment. On the other hand, increasing income is often accompanied by a societal demand for improved environmental quality, such as clean water and clean air, and is also accompanied by access to advanced technology18,19. Consequently, governments may impose regulatory policies or offer subsidies and incentives targeted at reducing local or regional N pollution, and farmers may adopt more efficient technologies.
Therefore, we hypothesize that Nsur follows a pattern similar to the EKC: Nsur increases with income growth and the quest for food security at early stages of national agricultural development (first phase), but then decreases with further income growth during a more affluent stage (second phase), eventually approaching an asymptote determined by the theoretical limit of the NUE of the crop system (third phase, Fig. 2). Sustainable intensification of agriculture has been advanced as the key to achieving the second phase of the EKC, including use of cultivars best adapted to the local soil and climate conditions, improved water management, balancing N application with other nutrient amendments, precision timing and placement of fertilizer and manure applications to meet crop demands, the use of enhanced-efficiency fertilizers, and support tools to calculate proper dosing14,17,34. While Nsur is the EKC environmental degradation indicator, the mathematical relationship between Nsur and NUE results in nearly mirror images in Fig. 2 (although see Supplementary Information section 1 for a discussion of situations in which Nsur and NUE can both increase simultaneously).

a, The EKC for Nsur. b, The curve for NUE, which is related to the EKC for Nsur. The theoretical limit for NUE (assuming no soil mining of nutrients) is unknown, but no biological system is 100% efficient, so the hypothetical NUE limit is shown as close to but less than unity.
Of the three phases of the Nsur trend, it is the second phase of sustainable intensification with increasing affluence that is of greatest contemporary interest. The first phase of agricultural expansion is well documented30,31, and the third phase cannot yet be evaluated. So far, no country has yet approached the third phase, nor do we know how close to 100% efficiency the use of N inputs could become. For the first phase, as incomes rise, virtually all countries initially increase fertilizer use, Nyield, and Nsur while NUE decreases30,31. To test the existence of the second phase, we examine whether the relationship between gross domestic product (GDP) per capita and Nsur breaks away from the linearly (or exponentially) increasing trend and follows more of a bell-shaped pattern over the long term.
We tested the existence of a sustainable intensification phase (or an EKC pattern) with a five-decade record (1961–2011) of Nsur and GDP per capita28,35,36,37,38,39,40 with a fixed effects model41,42,43 across 113 countries for which sufficient data were available and a regression model for each individual country18,44,45,46 (see sections 1 and 2 in the Supplementary Information). The fixed effects model shows a significant quadratic relationship between GDP per capita and Nsur (P < 0.001, Supplementary Table 9). Regressions between GDP per capita and Nsur for each individual country fall into five response types (examples of each group are shown in Fig. 3). Of the 113 countries, 56 countries (group 1) show bell-shaped relationships between Nsur and GDP per capita, indicating that Nsur increased and then levelled off or decreased as economic development proceeded, as expected for an EKC (two examples are illustrated in Fig. 3a). Those 56 countries account for about 87% of N fertilizer consumption and about 70% of harvested area of all 113 countries. These data provide support for an EKC pattern for N pollution from agriculture, although as we show below, the potential causes of EKC shapes and turning points are complex. Furthermore, for 28 of the 56 countries, by 2011 the rate of increase in Nsur had only slowed or levelled off and had not yet actually decreased, indicating likely but still uncertain conformance with an EKC (Supplementary Tables 5 and 6).

The observations are the record of annual Nsur smoothed using a ten-year window for each country; the model results are the outcome of the regression using the following model: Y = a + bX + cX2, where the dependent variable Y is the country’s Nsur and the independent variable X is the country’s GDP per capita. We categorized the 113 countries into five groups, based on the significance (that is, P value) and sign of the regression coefficients b and c (see Supplementary Information sections 2.1 and 3.1). a, France and USA are examples of group 1, which have significantly negative c (Pc < 0.05 and c < 0), thus indicating that Nsur has started to level off or has declined; b, Brazil, Thailand, Malawi and Algeria are examples of groups 2–5, which increase nonlinearly, increase linearly, have no significant correlation (Pb > 0.05 and Pc > 0.05), or have a negative surplus in 2007–2011, respectively (see Supplementary Tables 5 and 6). The results for all countries can be found in the figures in the Supplementary Information.
Countries with a linear or accelerating increase in Nsur (group 3 and most countries in group 2) as GDP per capita grew have not yet approached an EKC turning point (for example, Fig. 3b), but could still follow an EKC in the future as their N input growth slows and NUE increases. Most countries showing an insignificant (P > 0.05) relationship between Nsur and GDP per capita (group 4) or with a negative Nsur (group 5) have had such little income growth and use so little N that the EKC concept cannot be evaluated yet owing to limited change in the country’s GDP per capita (for example, Fig. 3b).
Classic empirical studies on EKC, such as Grossman and Krueger (ref. 19), have been criticized because of concerns regarding statistical analyses of time series data that may be non-stationary47,48,49. Therefore, we examined the stationarity of our data (Supplementary Table 7) and used the Autoregressive Distributed Lag modelling approach (ARDL)50, which is the most frequently used method for the co-integration test in EKC empirical studies published in the last decade43, to test co-integration on a subset of the data. The ARDL regression models showed the same long-term relationships between Nsur and GDP per capita as presented above for all tested countries (Supplementary Table 8). The application of the ARDL method in EKC studies has also been criticized recently for including the quadratic term in the co-integration test, and some new methods have been proposed51,52. Further evaluation is needed on the limitations and performance of the ARDL and newly proposed methods for EKC analyses.
Another common criticism of the EKC concept is that the turning point for transitioning to declining environmental degradation is highly variable among pollutants and among countries18,53,54. Consistent with those observations, no specific value of GDP per capita was a good predictor of turning points for Nsur on the EKC among countries in the present study. For example, Nsur in Germany and France started to decline when GDP per capita reached about US$25,000 in the 1980s, while Nsur in the USA levelled off and started to decline more recently when GDP per capita reached about US$40,000. Our analysis also shows that countries have widely differing values of NUE and Nsur even when yields are similar. Some of this variation is probably due to underlying biophysical conditions, such as rainfall variability and soil quality, which influence crop choices, yield responses, and NUE. However, cultural, social, technological, economic and policy factors also probably affect the turning points on the EKC trajectory of each country.
The turning point in European Union (EU) countries appears to have been reached at least in part owing to policies55. Beginning in the late 1980s and through the early 2000s, increases in NUE and decreases in Nsur in several EU countries coincided with changes in the EU Common Agricultural Policy, which reduced crop subsidies, and adoption of the EU Nitrates Directive, which limited manure application rates on cropland56,57. Relying mostly on volunteer approaches in the USA, the levelling off and modest decrease in Nsur since the 1990s is largely the result of increasing crop yields while holding N inputs steady (Fig. 4a), which has resulted from improved crop varieties, increased irrigation and other technological improvements57,58. A few state regulatory programmes have required nutrient management plans, placed limitations on fertilizer application dates and amounts, and required soil and plant testing, with varying degrees of success58,59,60. Concerns about water and air quality, estuarine hypoxic zones, stratospheric ozone depletion, and climate change have also stimulated many outreach efforts by governments, fertilizer industry groups, retailers, and environmental organizations to provide farmers with information, training and innovative financial incentives to improve NUE voluntarily15,59,61,62.

a, Nationally averaged annual fertilization rates and yields of maize in China and the USA. b, NUE averaged across crops in China and the USA. c, Fertilizer to crop price ratios for China, India, USA and France. The dashed blue line in a shows a typical yield response function for maize based on fertilizer response trials33,63, which demonstrates diminishing return in yield as N inputs increase. Note that the historical trend for China follows a pattern similar to a typical yield response function, indicating that further increases in N application rates will result in diminishing yield returns in China. In contrast, maize yield has increased in the USA since 2001 without increasing nationally averaged N input rates, suggesting that the yield improvement has been achieved by adopting more efficient technologies or management practices that shift the yield response curve upwards33. The dashed pink line in b shows what the NUE in China would be if it achieved NUE values realized in the USA for all crops, but with the crop mix of China. The gap between the dashed pink line and the black line (USA record) is the difference in NUE between countries that is attributable to the differences in crop mixes. The fertilizer to crop price ratio shown in c is determined by the N price of urea divided by the N price of maize product (see section 1.6 in Supplementary Information for data sources and methodologies). The data are smoothed using a ten-year window.
Fertilizer to crop price ratios
Policy can affect NUE not only through regulation and outreach, but also by affecting prices at the farm gate. The ratio of fertilizer to crop prices, Rfc, has been widely used in combination with data on yield responses to fertilizer application to advise farmers on fertilizer application rates that yield optimal economic returns63,64,65. In addition to influencing fertilizer application rates, Rfc also affects farmer decisions regarding their choice of technologies and practices for nutrient management, all of which affect NUE and Nsur (ref. 33). We tested whether the influence of Rfc appears at the national level using two methods: one examines the correlation coefficient of Rfc and NUE for individual countries, and the other applies a fixed effects model to all data to test the correlation between Rfc and NUE with and without including GDP per capita and crop mix (see section 2.3 in Supplementary Information). Because both the fertilizer and crop prices are ‘at the farm gate’, they include the effects of government subsidies35. The results for maize, for which the most data are available, indicate that the fertilizer to maize price ratio is positively correlated with NUE using both statistical approaches (Supplementary Table 12). We also found that maize prices are linearly correlated with the prices of most major crops, so we infer that the fertilizer to maize price ratio is likely to be a good index for the long-term trend of Rfc for all crops. Indeed, we found a statistically significant (P < 0.001) positive correlation between historical values of Rfc for maize and the NUE aggregated for all other crops. Moreover, this correlation is still statistically significant (P < 0.001) after adjusting for the effect of GDP per capita and crop mix (Supplementary Table 11).
Increases in Rfc since the 1990s, in both France and the USA (Fig. 4c), coincided with increases in NUE (ref. 57) and may have affected the EKC turning point. At the other extreme, both China and India have had declining values of Rfc (Fig. 4c), owing to heavily subsidized fertilizer prices25,66. Fertilizer subsidies reached US$18 billion in China in 2010 (ref. 66). Rates of N inputs have now reached levels of diminishing returns for crop yield in China (Fig. 4a), and China has the largest Nsur and one of the lowest nationally averaged NUE values in the world (Table 1). The very low Rfc in China incentivizes farmers to attempt to increase crop yield by simply adding more N or by choosing more N-demanding cropping systems (for example, change from cereal production to greenhouse vegetable production67) instead of adopting more N-efficient technologies and management practices.
Not all fertilizer subsidies are inappropriate. Where infrastructure for producing and transporting fertilizers is poor, as is the case for most of Africa, the cost can be so high that fertilizer use is prohibitively expensive for smallholder farmers, resulting in low yield and small, even negative Nsur (soil mining). In these cases, there is room for fertilizer subsidies to increase N inputs, because significant increases in N inputs could be absorbed and greatly increase crop yields without much immediate risk of N pollution68,69,70. When properly designed, temporary fertilizer subsidies structured to build up the private delivery network and with a built-in exit strategy can be an appropriate step71. The longer-term question for these countries will be whether they can ‘tunnel through’ the EKC by shifting crop production directly from a low-yield, high-NUE status to a high-yield, high-NUE status. This shift will require leapfrogging over the historical evolution of agricultural management practices by employing technologies and management practices that promote high NUE before Nsur grows to environmentally degrading levels. Acquiring and deploying such technologies, such as improved seed, balanced nutrient amendments, and water management, will require investments in technology transfer and capacity building.
Importance of crop mix
Another factor that may confound EKC trajectories is the mix of crops countries grow over time, which is affected by both demand and trade policies72. For example, changing patterns of crop mixes help to explain some of the differences between China and the USA. Since the 1990s an increasing percentage of agricultural land in China has been devoted to fruit and vegetable production, and N application to fruits and vegetables now accounts for about 30% of total fertilizer consumption38,73, with an average NUE of only about 0.10 (which is below the globally averaged NUE for fruits and vegetables of 0.14, and well below the global averages for other major crops; Table 1)74,75. At the same time, China has been increasingly relying on imported soybeans, an N-fixing crop that has very low Nsur (Table 1)76. In contrast, US soybean production has been growing and now accounts for about 30% of the harvested area for crop production (excluding land devoted to production of grasses or crops for feeding livestock) in the USA. While fertilizer subsidies in China probably account for much of the low NUE there, our analysis shows that the difference in crop mix also accounts for nearly half of the NUE difference between China and USA (Fig. 4b).
To address this issue globally, we tested the relationship between NUE and the fraction of harvested area for fruits and vegetables with a fixed effects model for the 113 countries (Supplementary Table 11). The fraction of harvested area for fruit and vegetable production negatively correlates with NUE, and that relationship is still significant (P < 0.001) even after adjusting for the effect of GDP per capita.
Meeting the growing challenge
Agriculture is currently facing unprecedented challenges globally. On one hand, crop production needs to increase by about 60%–100% from 2007 to 2050 to meet global food demand3,77,78,79. On the other hand, anthropogenic reactive N input to the biosphere has already exceeded a proposed planetary boundary5,80, and the increasing demand for food and biofuel is likely to drive up N inputs even further. Therefore, it is critical to establish global and national goals for N use in crop production and to use those goals as reference points to evaluate progress made and guide NUE improvement.
Global and national goals
The planetary boundary for human use of reactive N that can be tolerated without causing unsustainable air and water pollution has been defined in mainly two ways: (1) as the maximum allowable amount of anthropogenic newly fixed N in agriculture that can be introduced into the earth system (62–82 Tg N yr−1)5,80, and (2) as the maximum allowable Nsur released from agricultural production to the environment.
Calculations of planetary boundaries according to the first definition require assumptions about nutrient-use efficiency in agriculture. As NUE increases, more N inputs would be manageable while still remaining within air and water pollution limits because more applied N would be taken up by harvested crops. Therefore, rather than focusing on a planetary boundary of allowable newly fixed N, which varies depending on the NUE assumption, we follow the second approach, by estimating what NUE would be needed to produce the food demand projected for 2050 (ref. 3; Table 1) while keeping Nsur within the bounds estimated for acceptable air and water quality. Over 60% of N pollution is estimated to originate from crop production78, so this is the primary sector that must be addressed to reduce N pollution. From an analysis of the implications of N cycling in several “shared socio-economic pathways”81, Bodirsky et al. (ref. 78) calculated that global agricultural Nsur should not exceed about 50–100 Tg N yr−1. Therefore, we use 50 Tg N yr−1 as an estimate of the global limit of Nsur from crop production.
Meeting the 2050 food demand of 107 Tg N yr−1 projected by the Food and Agriculture Organization (FAO, ref. 3) while reducing Nsur from the current 100 Tg N yr−1 to a global limit of 50 Tg N yr−1 (ref. 78) requires very large across-the-board increases in NUE. Globally, NUE would increase from ~0.4 to ~0.7, while the crop yield would increase from 74 Tg N yr−1 to 107 Tg N yr−1 (Table 1). Recognizing regional differences in crop production and development stage, this average could be achieved if average NUE rose to 0.75 in the EU and USA, to 0.60 in China and the rest of Asia (assuming they continue to have a high proportion of fruits and vegetables in their crop mix), and to 0.70 in other countries, including not dropping below 0.70 in sub-Saharan Africa as it develops (Table 1). Similarly, NUE targets could be established for individual crops, such as improving the global average from 0.14 to 0.40 for fruits and vegetables, and increasing the global average NUE for maize from 0.50 to 0.70 (Table 1).
The challenges in achieving these ambitious goals differ among countries. Figure 5 shows the trajectories of major crop producing countries on the yield–NUE map for the last five decades. The x and y axes show the two efficiency terms in crop production, NUE and Nyield, while the greyscale displays Nsur. To compare the nationally averaged field-scale (in units of kg N ha−1 yr−1) Nsur in Fig. 5 to a global limit of 50–100 Tg N yr−1, the global average Nsur target would need to be 39–78 kg N ha−1 yr−1 across the 2010 harvested area of 1.3 billion hectares. For the examples shown, the USA, France, and Brazil appear to be on this trajectory, although further progress is still needed. In contrast, China and India not only have not yet found an EKC turning point, but also have much ground to make up to reduce their Nsur once they turn the corner on their EKC. Although a great challenge, this could also be seen as an opportunity to reduce fertilizer expenditures while increasing agricultural productivity. Malawi, like many sub-Saharan African countries and other least developed countries, has been on a classic downward trajectory of decreasing NUE as it has started to increase N inputs, although evidence from recent years suggests that this decline may have reversed, which would be a necessary first step to tunnelling through the EKC (Fig. 5).

The greyscale shows the level of Nsur. The area covered in red indicates negative Nsur, where the crop production is mining soil N. The data have been smoothed by ten years to limit the impact of year-to-year variation in weather conditions. Curves moving towards the lower right indicate that those countries are achieving yield increases by sacrificing NUE and increasing Nsur, whereas curves moving towards the upper right indicate countries achieving yield increases by increasing NUE and resulting in steady or decreasing Nsur.
Achieving NUE targets
Achieving ambitious NUE targets while also increasing yields to meet future food demands requires implementation of technologies and management practices at the farm scale, which has been described widely and in considerable detail in the agricultural, environmental, and development literature17. Some common principles include the ‘4Rs’ approach of applying the right source, at the right rate, at the right time, in the right place34. However, the technologies and management practices needed to achieve the 4Rs vary regionally depending on the local cropping systems, soil types, climate and socio-economic situations. Where improvements in plant breeding, irrigation, and application of available 4R technologies have already made large gains, new technological developments may be needed to achieve further gains, such as more affordable slow-release fertilizers, nitrification and urease inhibitors, fertigation (that is, applying fertilizer via irrigation water), and high-tech approaches to precision agriculture58.
It is promising that the development and the combination of information technology, remote sensing, and ground measurements will make information about precision farming more readily available, accessible, affordable and site-specific82. In many cases, large gains could still be made with more widespread adoption of existing technologies, but a myriad of social and economic factors affecting farmer decision-making regarding nutrient management have only recently begun to receive attention and are critical in improving NUE (ref. 15). Socio-economic impediments, often related to cost and perceived risk, as well as lack of trust in recommendations by agricultural extension agents, often discourage farmers from adopting improved nutrient management practices59,60,83,84. Experience has shown that tailoring regulations, incentives, and outreach to local conditions, administered and enforced by local entities, and supported by trust established among local stakeholders improve the success of efforts designed to increase NUE (ref. 15).
Although much of the work must be done at the farm scale, there are important policies that should be implemented on national and multi-national scales. First, improving NUE should be adopted as one of the indicators of the Sustainable Development Goals16 and should be used in conjunction with crop yield and perhaps other soil health parameters to measure the sustainability of agricultural development. To report reliably on a NUE indicator, countries should be strongly encouraged to collect data routinely on their N management in crop and livestock production. These data should be used to trace trajectories of the three indices of agricultural N pollution, agricultural efficiency and food security targets (that is, Nsur, NUE and Nyield), as we have done here (Fig. 5) to demonstrate where progress is being made and where stronger local efforts are needed. The data used to construct Fig. 5 have served to demonstrate trends, but both improved data quality and international harmonization of data standards are needed. Regular attention should be given to these trends to establish national and local targets and policies. Just as protocols established by the Intergovernmental Panel on Climate Change permit nations to gauge their progress and commitment for reducing greenhouse gas emissions, protocols for measuring and reporting on a Sustainable Development Goal pertaining to NUE could enable governments to assess their progress in achieving food security goals while maintaining environmental quality.
Second, nutrient management in livestock operations and human dietary choices needs more attention. Here we have focused entirely on crop production, largely because of availability of data, but the Nsur, NUE and Nyield indices are equally important in livestock management85. Indeed, soybeans and some cereals have high NUE as crops, but when fed to livestock, efficient recycling of the N in manure is challenging, resulting in lower integrated NUE for the crop–livestock production system86. The crop production scenario used here for 2050 (Table 1) makes assumptions about future dietary choices3, which are beyond the scope of this study, but we note that future trends in diet will affect the demand for crop and livestock products, the crop mixes grown, and hence the NUE and Nsur of future agricultural systems72.
Third, a similar approach to efficiency analysis would also be valuable for phosphorus (P) fertilizer management, interactions of N and P management, and reducing both N and P loading into aquatic ecosystems87,88,89,90.
Fourth, national and international communities should facilitate technology transfer and promote agricultural innovation. Stronger international collaborations and investments in research, extension and human resources are urgently needed so that knowledge and experience can be shared, creating political and market environments that help to incentivize the development and implementation of more efficient technologies. Technology transfer and capacity building will be needed to enable sub-Saharan African countries to tunnel through the EKC (Fig. 5).
These solutions to improving NUE will require cross-disciplinary and cross-sectorial partnerships, such as: (1) integrating research and development of innovative agricultural technology and management systems with socio-economic research and the outreach needed for such innovations to be socially and economically viable and readily adopted by farmers; (2) analysing the nexus of food, water, nutrients and energy management to avoid pollution swapping (a measure designed to address one pollution problem leads to another; for example, retaining crop residues can reduce nitrogen runoff, but may lead to higher N2O emission91) and to optimize the net benefits to farmers, the environment and society; (3) promoting knowledge and data sharing among private and public sectors to advance science-based nutrient management; and (4) training the next generation of interdisciplinary agronomic and environmental scientists equipped with broad perspectives and skills pertaining to food, water, energy and environment issues.
The EKC has often been described as an optimist’s view of a world with declining environmental degradation. Here we have shown that there is evidence—indeed, there is hope—for the EKC pattern of declining N pollution with improving efficiencies in agriculture. However, we have also shown that continuation of the progress made so far is neither inevitable nor is it sufficient to achieve the projected 2050 goals of both food security and environmental stewardship. Turning points and trajectories of national agricultural EKCs will depend largely on agricultural, economic, environmental, educational and trade policies, and these will largely dictate the food and pollution outputs of future agriculture.
What is Your Reaction?
 Like
0
Like
0
 Dislike
0
Dislike
0
 Love
0
Love
0
 Funny
0
Funny
0
 Angry
0
Angry
0
 Sad
0
Sad
0
 Wow
0
Wow
0