


Mapped: The stark north-south divide in British life expectancy – and where men and women are dying younger – AOL.com

Report on Life Expectancy Disparities in Great Britain and Alignment with Sustainable Development Goals
A recent analysis conducted by the Centre for Ageing Better reveals significant disparities in life expectancy across Great Britain, highlighting critical challenges to achieving key Sustainable Development Goals (SDGs), particularly SDG 3 (Good Health and Well-being) and SDG 10 (Reduced Inequalities).
Executive Summary of Findings
The 2025 State of Ageing report indicates that national life expectancy averages are not reflective of the lived experience across different regions and socio-economic groups. The data from 2021-2023 shows a persistent gender gap and a widening chasm in health outcomes based on wealth and geography, undermining the principle of ensuring healthy lives and promoting well-being for all at all ages.
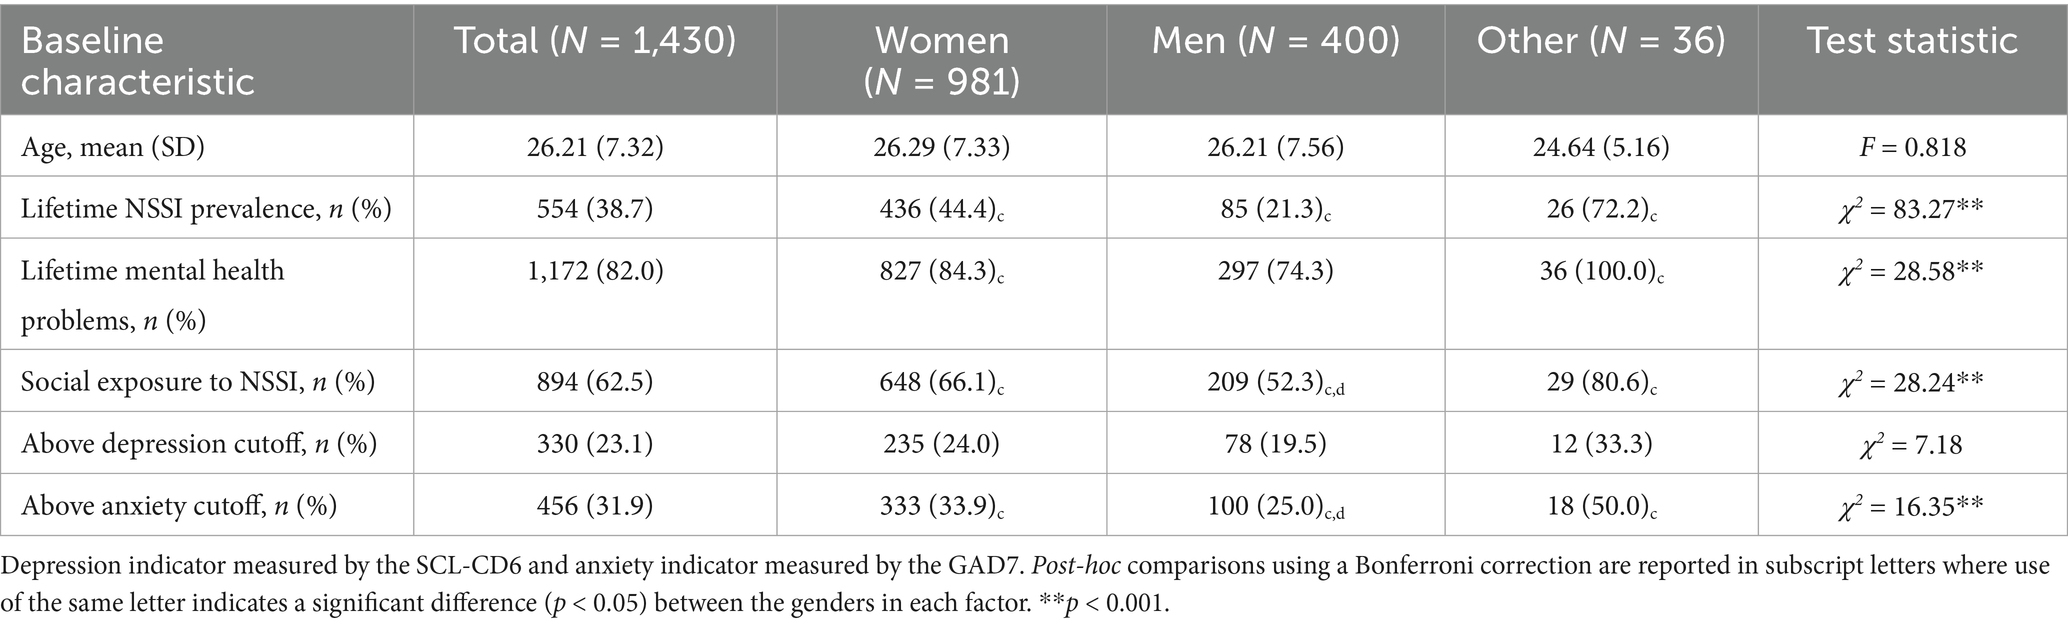
- National Average Life Expectancy (2021-2023):
- Men: 79 years
- Women: 83 years
- Gender Gap: Men, on average, live four fewer years than women.
Socio-Economic Disparities and SDG 10: Reduced Inequalities
The report underscores a direct correlation between wealth and longevity, a critical concern for SDG 10. The inequality in health outcomes between the most and least affluent areas is stark and growing.
- Men in the bottom quintile of areas by wealth are expected to live 4.4 fewer years than those in the top quintile.
- Women in the bottom quintile of areas by wealth are expected to live 3.7 fewer years than their counterparts in the wealthiest areas.
These figures demonstrate a failure to reduce inequality and ensure equal opportunity for health outcomes, a core target of the SDGs. Dr. Carole Easton OBE of the Centre for Ageing Better noted that financial insecurity and poverty are directly impacting health in later life.
Geographical Divides and SDG 3: Good Health and Well-being
A pronounced north-south divide in life expectancy presents a major obstacle to achieving universal health coverage and well-being as outlined in SDG 3. The data reveals a pattern where health outcomes are heavily influenced by location.
Regional Life Expectancy Averages
- Lowest Region (North East):
- Men: 77.4 years
- Women: 81.4 years
- Highest Region (South East):
- Men: 80.3 years
- Women: 84.1 years
Local Authority Extremes
The disparities are most extreme at the local authority level, with a difference of over a decade in life expectancy for men between the highest and lowest areas.
- Lowest Life Expectancy (Blackpool):
- Men: 73.1 years
- Women: 78.9 years
- Highest Life Expectancy for Men (Hart, Hampshire): 83.4 years
- Highest Life Expectancy for Women (Kensington and Chelsea): 86.5 years
The report confirms that the 10 local authorities with the lowest life expectancies are all located in the north of England and the Midlands, while the 10 highest are in the south. This geographical inequality directly contravenes the ambition of SDG 3 to reduce premature mortality.
Implications and Recommendations for SDG Advancement
The findings indicate that progress towards a more equitable and healthy society is stalling. Dr. Easton described the situation as a “matter of life and death,” attributing the growing inequality to the compounded effects of austerity, the COVID-19 pandemic, and the cost-of-living crisis.
Achieving the SDGs requires a concerted effort to address these deep-seated inequalities. Key recommendations and governmental responses include:
- Call for Systemic Action: A call for urgent action across government and society, including the proposed appointment of a Commissioner for Older People and Ageing to champion the creation of age-friendly societies, which aligns with SDG 11 (Sustainable Cities and Communities).
- Governmental Response: A spokesperson for the Department of Health and Social Care affirmed that “life expectancy should not be determined by your postcode” and highlighted a strategic shift towards prevention to target the drivers of ill health, a measure that supports the preventative targets within SDG 3.
Analysis of Sustainable Development Goals (SDGs) in the Article
1. Which SDGs are addressed or connected to the issues highlighted in the article?
The article on life expectancy disparities in Great Britain touches upon several interconnected Sustainable Development Goals. The primary issues of health outcomes, inequality, and the socio-economic factors influencing them are central to the 2030 Agenda for Sustainable Development.
-
SDG 3: Good Health and Well-being
This is the most prominent SDG in the article. The entire analysis revolves around life expectancy, which is a key indicator of a population’s overall health and well-being. The article discusses differences in health outcomes, factors contributing to ill health (“drivers of ill health”), and the need for prevention-focused healthcare.
-
SDG 10: Reduced Inequalities
The article’s core theme is inequality. It explicitly details disparities in life expectancy based on several factors:
- Economic Status: It highlights a significant gap in life expectancy between people living in the wealthiest and poorest areas of England.
- Geographic Location: The “north-south divide” is a central point, showing how life expectancy varies dramatically between regions and local authorities.
- Sex: The article begins by stating that men, on average, live four fewer years than women, addressing gender-based inequality in health outcomes.
-
SDG 1: No Poverty
This goal is directly linked as a root cause of the health disparities discussed. The article quotes Dr. Carole Easton, who states that “financial insecurity and poverty is rife” in areas with lower life expectancy, directly connecting poverty to poor health outcomes and reduced years of life.
-
SDG 11: Sustainable Cities and Communities
The analysis drills down to the “local authority” level, comparing places like Blackpool, Hart, and Kensington. This highlights that the quality of life and health outcomes are tied to the specific community or settlement where people live. The call for “age-friendly societies” further connects to the goal of making cities and human settlements inclusive, safe, resilient, and sustainable for all, including older people.
2. What specific targets under those SDGs can be identified based on the article’s content?
Based on the issues discussed, several specific SDG targets can be identified:
-
Target 3.4: Reduce premature mortality from non-communicable diseases
The article’s focus on increasing life expectancy directly relates to reducing premature mortality. The disparities shown between regions and wealth quintiles indicate varying levels of success in preventing early deaths. The Department of Health and Social Care’s statement about shifting focus “from sickness to prevention, targeting the drivers of ill health and catching the biggest killers earlier” aligns perfectly with this target.
-
Target 10.2: Empower and promote the social, economic and political inclusion of all
This target aims to ensure inclusion irrespective of age, sex, or economic status. The article provides clear evidence of a lack of inclusion in health outcomes. The data showing that people in poorer areas and certain geographic regions have significantly shorter lives demonstrates a failure to achieve equal opportunities for well-being for all citizens.
-
Target 1.2: Reduce at least by half the proportion of men, women and children of all ages living in poverty
The article implies that progress on this target is crucial for achieving health equity. It identifies “poverty” and “financial insecurity” as key factors that are “robbing people of their health in later life.” This suggests that reducing poverty is a necessary step to close the life expectancy gap.
-
Target 11.1: Ensure access for all to adequate, safe and affordable housing and basic services
While not explicitly about housing, the vast differences in life expectancy between local authorities like Blackpool and Hart point to disparities in the “basic services” and overall living conditions that support a healthy life. The call for creating “age-friendly societies” also supports the goal of making communities inclusive and supportive for all residents, which is a component of this target.
3. Are there any indicators mentioned or implied in the article that can be used to measure progress towards the identified targets?
Yes, the article is rich with quantitative and qualitative data that serve as direct or implied indicators for measuring progress.
-
Indicators for Target 3.4:
The primary indicator used throughout the article is Life expectancy at birth. Specific data points provided include:
- Average life expectancy for men (79 years) and women (83 years).
- Life expectancy in the North East (77.4 for men, 81.4 for women) versus the South East (80.3 for men, 84.1 for women).
- Lowest life expectancy in Blackpool (73.1 for men, 78.9 for women).
- Highest life expectancy for men in Hart (83.4 years) and for women in Kensington and Chelsea (86.5 years).
-
Indicators for Target 10.2:
The indicators are the disparities or gaps in life expectancy between different population groups. These measure the extent of inequality:
- The 4.4-year difference in life expectancy for men between the wealthiest and poorest areas.
- The 3.7-year difference for women between the same groups.
- The 10-year gap in life expectancy for men between Hart and Blackpool.
- The “north-south divide” itself is a qualitative indicator of regional inequality.
-
Indicators for Target 1.2:
The article provides a qualitative indicator by stating that “financial insecurity and poverty is rife” in areas with lower life expectancy. This implies that the prevalence of poverty in specific geographic areas is an indicator linked to health outcomes, even if a specific poverty rate is not given.
-
Indicators for Target 11.1:
The disparity in life expectancy at the local authority level serves as an indicator of how well different communities support the health and well-being of their residents. The call to create “age-friendly societies” is a qualitative policy goal that can be measured by the implementation of specific age-friendly policies and programs within communities.
4. Table of SDGs, Targets, and Indicators
| SDGs | Targets | Indicators Identified in the Article |
|---|---|---|
| SDG 3: Good Health and Well-being | Target 3.4: By 2030, reduce by one third premature mortality from non-communicable diseases through prevention and treatment and promote mental health and well-being. |
|
| SDG 10: Reduced Inequalities | Target 10.2: By 2030, empower and promote the social, economic and political inclusion of all, irrespective of age, sex, disability, race, ethnicity, origin, religion or economic or other status. |
|
| SDG 1: No Poverty | Target 1.2: By 2030, reduce at least by half the proportion of men, women and children of all ages living in poverty in all its dimensions according to national definitions. |
|
| SDG 11: Sustainable Cities and Communities | Target 11.1: By 2030, ensure access for all to adequate, safe and affordable housing and basic services and upgrade slums. |
|
Source: aol.com

What is Your Reaction?
 Like
0
Like
0
 Dislike
0
Dislike
0
 Love
0
Love
0
 Funny
0
Funny
0
 Angry
0
Angry
0
 Sad
0
Sad
0
 Wow
0
Wow
0