


Seattle has 12th-longest commute, 5th-worst congestion in nation – MyNorthwest.com
2025 Urban Mobility Report: An Analysis of U.S. Metropolitan Traffic in the Context of Sustainable Development Goals
Executive Summary
A 2025 analysis of traffic in the 50 most populous U.S. metropolitan areas reveals significant challenges to achieving key Sustainable Development Goals (SDGs), particularly SDG 11 (Sustainable Cities and Communities) and SDG 3 (Good Health and Well-being). While the Seattle metropolitan area has shown improvement by moving from the third to the eighth position for worst traffic, persistent issues with commute times and congestion underscore the need for continued focus on sustainable urban transport systems. This report details the national rankings and provides a specific analysis of Seattle’s performance against critical sustainability benchmarks.
National Traffic Rankings and Alignment with SDG 11
The study evaluates urban mobility based on metrics that directly correlate with the objectives of SDG 11, which aims to make cities inclusive, safe, resilient, and sustainable. Long commute times and high congestion levels are indicators of unsustainable transport systems, failing to meet SDG Target 11.2 regarding access to safe, affordable, and sustainable transport.
Cities with the Most Significant Challenges to Sustainable Transport
The following cities rank highest for traffic congestion, indicating substantial hurdles in achieving sustainable urban mobility and community well-being.
- Washington, D.C.
- Los Angeles, CA
- Miami, FL
- San Francisco, CA
- Atlanta, GA
- New York, NY
- Houston, TX
- Seattle, WA
- Baltimore, MD
- San Jose, CA
Cities Demonstrating Progress Toward Sustainable Mobility
Conversely, several cities exhibit traffic conditions more aligned with the principles of SDG 11, characterized by shorter commute times and lower congestion.
- Rochester, NY
- Salt Lake City, UT
- Cleveland, OH
- Hartford, CT
- St. Louis, MO
- Milwaukee, WI
- Columbus, OH
- Fresno, CA
- Kansas City, MO
- Buffalo, NY
Notably, Columbus, Ohio, demonstrated a nearly 40% year-over-year reduction in congestion time, serving as a model for effective traffic management strategies that support sustainable urban development.
Analysis Methodology and Connection to SDG Targets
The rankings were determined by a weighted analysis of three core metrics, each reflecting progress toward specific SDG targets.
- Average travel time to work: A direct measure of transportation efficiency and a key performance indicator for SDG Target 11.2 (Sustainable Transport Systems).
- Hours of congestion: High congestion contributes to air pollution and economic losses, impacting SDG Target 11.6 (Reduce Environmental Impact of Cities) and SDG 8 (Decent Work and Economic Growth).
- Fatal car crashes per 100,000 people: This metric is a direct measure of road safety, aligning with SDG Target 3.6 (Halve Global Deaths and Injuries from Road Traffic Accidents).
Seattle Case Study: Performance Against SDG Benchmarks
Despite an improved overall ranking, Seattle’s specific traffic statistics highlight ongoing challenges in its journey toward becoming a fully sustainable city as envisioned by the SDGs.
Key Performance Indicators for Seattle
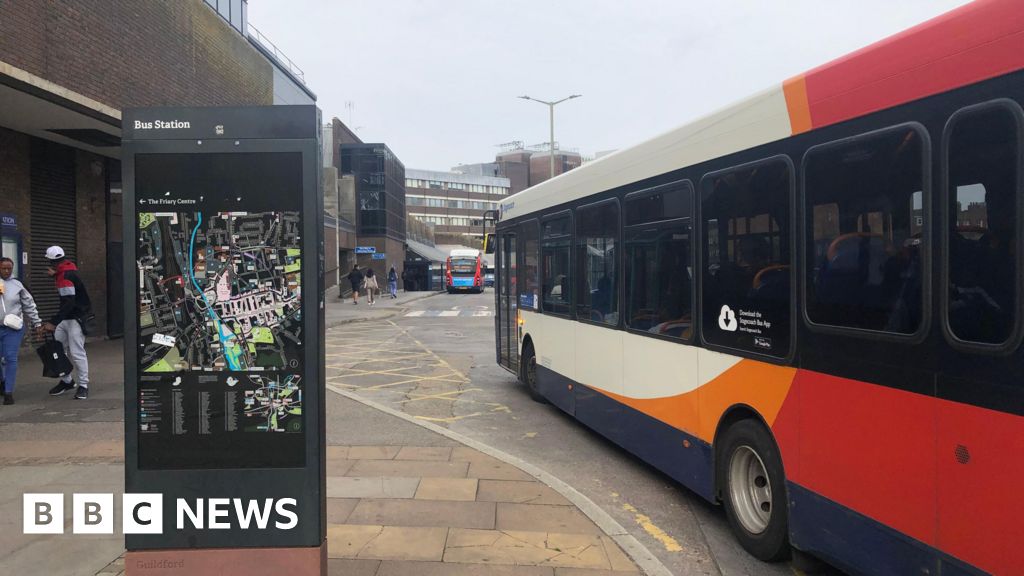
- Commute Time and Congestion (SDG 11.2): Seattle’s average commute time is 29.2 minutes, with a 3.2% year-over-year increase. The city also experiences an average of six hours and five minutes of weekday congestion, the fifth-longest duration among the cities studied. These figures indicate that the region’s transport systems are under strain and not fully meeting the accessibility and sustainability goals of SDG 11.
- Road Safety (SDG 3.6): The city averages 7.14 fatal car crashes per 100,000 people. While this is the 14th-lowest rate among the 50 cities analyzed, it represents a critical area for improvement to fully achieve the road safety targets outlined in SDG 3. Continuous efforts are required to reduce traffic-related fatalities and enhance the well-being of all citizens.
1. Which SDGs are addressed or connected to the issues highlighted in the article?
The article’s discussion on traffic congestion, commute times, and road safety connects to the following Sustainable Development Goals (SDGs):
-
SDG 3: Good Health and Well-being
This goal aims to ensure healthy lives and promote well-being. The article directly connects to this SDG by using “fatal car crashes per 100,000 people” as a key metric for ranking city traffic. Road safety is a critical component of public health.
-
SDG 11: Sustainable Cities and Communities
This goal focuses on making cities inclusive, safe, resilient, and sustainable. The article’s core subject—urban traffic, commute times, and congestion—is central to the sustainability of transport systems within cities. Long commute times and high congestion levels, as detailed for Seattle, indicate challenges in achieving a sustainable urban environment.
-
SDG 9: Industry, Innovation and Infrastructure
This goal includes the development of quality, reliable, sustainable, and resilient infrastructure. Traffic systems are a fundamental part of a region’s infrastructure. The article’s data on congestion and travel times serve as a performance report on the existing transport infrastructure’s ability to support its population, highlighting issues of reliability and sustainability.
2. What specific targets under those SDGs can be identified based on the article’s content?
Based on the issues discussed, the following specific SDG targets can be identified:
-
Target 3.6: Halve the number of global deaths and injuries from road traffic accidents.
The article directly relates to this target by analyzing and quantifying “fatal car crashes per 100,000 people.” It provides a specific figure for Seattle (7.14), which is a direct measure of performance against this road safety target.
-
Target 11.2: Provide access to safe, affordable, accessible and sustainable transport systems for all.
The article’s focus on “Average travel time to work” and “hours of congestion” points directly to the efficiency and sustainability of transport systems. The long commute times (29.2 minutes) and congestion (six hours and five minutes) in Seattle indicate a lack of efficient and sustainable transport options, which this target aims to address.
-
Target 9.1: Develop quality, reliable, sustainable and resilient infrastructure… to support economic development and human well-being.
The problems of severe traffic congestion and increasing commute times described in the article are symptoms of an infrastructure system that is struggling to meet demand. This indicates a gap in the quality, reliability, and sustainability of the transport infrastructure, which is the focus of Target 9.1.
3. Are there any indicators mentioned or implied in the article that can be used to measure progress towards the identified targets?
Yes, the article mentions specific metrics that serve as direct or proxy indicators for measuring progress towards the identified targets:
-
Indicator for Target 3.6
The article explicitly uses a metric that aligns with official SDG indicator 3.6.1 (Death rate due to road traffic injuries).
Metric from article: “fatal car crashes per 100,000 people.” This is used to compare different cities and provides a quantifiable measure of road safety. -
Indicators for Target 11.2 and Target 9.1
The article provides data points that function as proxy indicators to assess the quality, sustainability, and efficiency of transport systems and infrastructure.
- Metric from article: “Average travel time to work.” The article states Seattle’s average is 29.2 minutes. A reduction in this time would signify progress towards a more efficient transport system (Target 11.2).
- Metric from article: “Hours of congestion.” The article notes Seattle’s “fifth-longest weekday congestion time, averaging six hours and five minutes.” Tracking this metric over time, as was done for Columbus which saw a 40% improvement, measures progress in creating more reliable and sustainable infrastructure (Targets 9.1 and 11.2).
- Metric from article: “Year-over-year increase in commuting times.” The article mentions a “3.2% year-over-year” increase for Seattle, which indicates a negative trend away from the goal. Reversing this trend would be a key indicator of progress.
4. Table of SDGs, Targets, and Indicators
| SDGs | Targets | Indicators (as mentioned or implied in the article) |
|---|---|---|
| SDG 3: Good Health and Well-being | Target 3.6: Halve the number of global deaths and injuries from road traffic accidents. | Fatal car crashes per 100,000 people. |
| SDG 11: Sustainable Cities and Communities | Target 11.2: Provide access to safe, affordable, accessible and sustainable transport systems for all. |
|
| SDG 9: Industry, Innovation and Infrastructure | Target 9.1: Develop quality, reliable, sustainable and resilient infrastructure. |
|
Source: mynorthwest.com

What is Your Reaction?
 Like
0
Like
0
 Dislike
0
Dislike
0
 Love
0
Love
0
 Funny
0
Funny
0
 Angry
0
Angry
0
 Sad
0
Sad
0
 Wow
0
Wow
0