


Coastal Area Storm Intensification
This study investigates global nearshore tropical cyclone intensification and its response to climate change using observations, numerical simulations, and climate models. It finds a historical increase in nearshore TC intensification rates due to decreased wind shear and increased humidity near coastlines, with projections indicating continued intensification under global warming.
Tropical cyclones (TCs) that intensify close to the coast pose a major socio-economic threat and are a substantial challenge from an operational standpoint. Therefore understanding historical trends in nearshore storm intensification and how they may change in future is of considerable significance. Despite this, few studies examined this key aspect of TCs at the global scale. Here we show, using an analysis of observations and atmospheric reanalyses, that the mean TC intensification rate has increased significantly over the period 1979–2020 primarily aided by increases in relative humidity and decreases in vertical wind shear. Further, high-resolution climate models, which explicitly resolve TCs, suggest that nearshore TC intensification will continue to increase in future. These increases in coastal TC intensification rates can mainly be attributed to stronger projected decreases in vertical wind shear. To better understand wind shear projections, a suite of idealized numerical experiments with an intermediate complexity model were conducted. The experiments indicate that enhanced warming in the upper-troposphere and changing heating patterns are likely responsible.
Abstract
Tropical Cyclones (TCs) inflict substantial coastal damages, making it pertinent to understand changing storm characteristics in the important nearshore region. Past work examined several aspects of TCs relevant for impacts in coastal regions. However, few studies explored nearshore storm intensification and its response to climate change at the global scale. Here, we address this using a suite of observations and numerical model simulations. Over the historical period 1979–2020, observations reveal a global mean TC intensification rate increase of about 3 kt per 24-hr in regions close to the coast. Analysis of the observed large-scale environment shows that stronger decreases in vertical wind shear and larger increases in relative humidity relative to the open oceans are responsible. Further, high-resolution climate model simulations suggest that nearshore TC intensification will continue to rise under global warming. Idealized numerical experiments with an intermediate complexity model reveal that decreasing shear near coastlines, driven by amplified warming in the upper troposphere and changes in heating patterns, is the major pathway for these projected increases in nearshore TC intensification.
Key Points
-
Tropical cyclone (TC) intensification rates have increased in near coastal regions over the 42-year period 1979-2020
-
Increases in relative humidity along with decreases in vertical wind shear are responsible
-
Climate models project a continued increase in nearshore TC intensification rates with decreasing wind shear playing a crucial role
Plain Language Summary
Tropical cyclones (TCs) that intensify close to the coast pose a major socio-economic threat and are a substantial challenge from an operational standpoint. Therefore understanding historical trends in nearshore storm intensification and how they may change in future is of considerable significance. Despite this, few studies examined this key aspect of TCs at the global scale. Here we show, using an analysis of observations and atmospheric reanalyses, that the mean TC intensification rate has increased significantly over the period 1979–2020 primarily aided by increases in relative humidity and decreases in vertical wind shear. Further, high-resolution climate models, which explicitly resolve TCs, suggest that nearshore TC intensification will continue to increase in future. These increases in coastal TC intensification rates can mainly be attributed to stronger projected decreases in vertical wind shear. To better understand wind shear projections, a suite of idealized numerical experiments with an intermediate complexity model were conducted. The experiments indicate that enhanced warming in the upper-troposphere and changing heating patterns are likely responsible.
1 Introduction
Tropical Cyclones (TCs) rank among the most destructive natural hazards, causing considerable socio-economic damages annually worldwide (Cerveny et al., 2017; K. Emanuel, 2003; Noy, 2016). With studies suggesting that the impacts from TCs will rise under climate change (Gettelman et al., 2018; Mendelsohn et al., 2012; Peduzzi et al., 2012), it is pertinent to understand how TCs may change close to the coast, where their societal influence is most profound. Recent studies have shown that under global warming, several aspects of TCs relevant for impacts upon landfall will likely change. For instance, TCs may traverse more slowly and cause more flooding (Hall & Kossin, 2019; Kossin, 2018), increase in strength and produce more rainfall (Patricola & Wehner, 2018; Scoccimarro et al., 2017; Wright et al., 2015), achieve their lifetime maximum intensity closer to the coast (S. Wang & Toumi, 2021) and decay more slowly over land (L. Li & Chakraborty, 2020). Further, the ocean surface has warmed more over the past century along the western boundaries of the global ocean basins near major coastlines (Wu et al., 2012). However, it remains unclear how storm intensification may change in the important nearshore region.
TCs that undergo rapid intensification shortly before landfall pose a major threat to coastal communities, and theory suggests such events are expected to become more frequent and severe as the climate continues to warm (K. Emanuel, 2017). For example, Typhoon Rai (2021) intensified rapidly to Category five strength just before making landfall over the southern islands of Philippines with devastating impacts, including hundreds of fatalities (Mata et al., 2023). In May 2023, Cyclone Mocha intensified rapidly in the Bay of Bengal to become the strongest cyclone on record in the North Indian Ocean and caused severe human losses in Bangladesh and Myanmar (World Health Organization, 2023). Similarly, Hurricanes Ida (2021) and Ian (2022) underwent phases of rapid intensification before striking the coasts of Louisiana and Florida, respectively, resulting in catastrophic damage (Reinhart, 2023; Zhu et al., 2022). Studies have shown that the magnitude and frequency of TC rapid intensification have increased in the Atlantic (Balaguru et al., 2018; K. T. Bhatia et al., 2019; K. Bhatia et al., 2022) and the northwestern Pacific (K. Bhatia et al., 2022; Song et al., 2020). Furthermore, it was found that during the past 40 years TCs approaching the US Atlantic coast and the East Asian coast have experienced stronger intensification (Balaguru et al., 2022; Garner, 2023; X. Li et al., 2023; R. C. Li et al., 2017; Mei & Xie, 2016; Park et al., 2014). In a recent study, Y. Li et al. (2023) conducted a global analysis, revealing a notable rise in the frequency of rapid intensification events within coastal regions. Nevertheless, a comprehensive examination of TC intensity changes in the critical nearshore region has not been conducted at the global scale. Additionally, the majority of these studies concentrated on historical observations, without taking into account future projections of TCs. In this study, we examine observed changes in nearshore TC intensification and the large-scale environment over the historical period, project changes into the future using climate model simulations and delve into the responsible mechanisms using idealized numerical model experiments.
2 Data, Model, and Methods
2.1 Data
TC track data obtained from the International Best Track Archive for Climate Stewardship (IBTrACS) (Knapp et al., 2010) are used to estimate 24-hr TC intensification rates for the 42-year period 1979–2020. Similarly, TC track data based on the Advanced Dvorak Technique-Hurricane Satellite record (ADT-HURSAT) (Kossin et al., 2020) are also used to compute TC intensification rates and validate the signal based on IBTrACS. ADT-HURSAT data are available for the 40-year period 1978–2017 (Kossin et al., 2020). We obtain monthly mean sea surface temperature (SST) from the UK Met Office's Hadley Center (Rayner et al., 2003) for the period 1979–2020. We also obtain monthly mean winds, relative humidity (RH), sea-level pressure and air temperature for the same period from NCEP-DOE II reanalysis (Kanamitsu et al., 2002). These data are used to understand changes in various TC environmental parameters, including SST, vertical wind shear (VWS), RH and potential intensity. Monthly mean SST, winds and RH are also obtained from ERA5 reanalysis (Hersbach et al., 2020) to further support our main findings based on Hadley SST and NCEP-DOE II reanalysis.
2.2 Model
TC track data are obtained for five fully coupled climate models belonging to the High Resolution Model Intercomparison Project (HighResMIP) and used to compute projected changes in TC intensification rates. The various models, including the number of ensembles (shown in brackets), are: CNRM-CM6-1-HR (1), EC-Earth3P-HR (2), HadGEM3-GC31-HH (1), HadGEM3-GC31-HM (3) and MPI-ESM1-2-XR (1). The models selected have an atmospheric spatial resolution of about 50 km or higher (Roberts et al., 2020). Tracks from the “hist-1950” simulations covering the 36-year period 1979–2014, and tracks from the “highres-future” simulations covering the 36-year period 2015–2050 are used. The TC tracks from HighResMIP that we use in this study are based on TempestExtremes (Ullrich & Zarzycki, 2017), a scale-aware feature tracking software that operates on the model's native grid. Projections of TC activity using TempestExtremes, which tracks TC vortices based on sea-level pressure anomalies, are broadly consistent with those using a tracker that operates on vorticity anomalies (Roberts et al., 2020), suggesting that our results may not be overly sensitive to the choice of the TC tracking algorithm. Monthly mean data from a single ensemble member realization of these five models are also employed to analyze trends in the TC environment over the 72-year period spanning from 1979 to 2050. Furthermore, monthly mean data from 15 climate models, which are part of the Scenario Model Intercomparison Project (ScenarioMIP)—a subset of the Coupled Model Intercomparison Project phase 6 (CMIP6), are utilized to project future trends in VWS. This data is assessed for the 86-year timeframe from 2015 to 2100, considering the “SSP585” emissions scenario. The various models used are: ACCESS-CM2, BCC-CSM2-MR, CESM2, CMCC-CM2-SR5, CNRM-ESM2-1, CanESM5, E3SM-1-1, EC-Earth3, GFDL-CM4, INM-CM5-0, IPSL-CM6A-LR, MIROC6, MPI-ESM1-2-LR, MRI-ESM2.0, and UKESM1-0-LL. Further details regarding the various CMIP6 and HighResMIP models used in this study have been provided previously (Balaguru et al., 2022).
To better understand projected VWS changes in the nearshore regions of the Northern Hemisphere, we apply a time-dependent, primitive equation anomaly model to conduct numerical sensitivity experiments. The Stationary Wave Model (SWM) (Ting & Yu, 1998) used in this study is the dry dynamical core of the NOAA/GFDL spectral model, with R30 horizontal resolution (roughly 2.25° latitude × 3.75° longitude) and 24 vertical sigma layers. Furthermore, various damping terms including Rayleigh friction, Newtonian cooling, and biharmonic diffusion are used in the SWM to prevent model-generated baroclinic instability and obtain a quasi-steady solution. The damping coefficients used here are the same as those employed by previous studies (Chang et al., 2023; Held et al., 2002; Ting et al., 2001). More details about the model equations can be found in the appendix of Ting and Yu (1998). All SWM simulations are run for 100 days, and a quasi-steady state is reached by day 30. The average from days 31 to 100 is presented for the following results.
Following a previously used experimental design (Balaguru et al., 2023a), here we perform five independent integrations using the SWM. Our control experiment (CTRL) solves deviations in surface pressure, three-dimensional temperature, and winds from the zonally symmetric climate during the near-future period of 2015–2034. In the SWM, zonally asymmetric circulation features arise due to longitudinal asymmetries in topography, diabatic heating, and transient eddies. It is worth noting that synoptic eddies cannot be explicitly simulated by the SWM, and their aggregated effects are considered as a fixed forcing term (see Text S1 in Supporting Information S1 for more details). The experiment that simulates the steady, zonally asymmetric circulation response to the imposed forcings superimposed on a zonal-mean basic state during the late 21st century (2081–2100) is referred to as “Future.” Additionally, we investigate the individual contributions of the anomalous basic state, diabatic heating, and transient forcing to the projected response in VWS through a series of sensitivity runs, labeled as: CTRL + ΔBS, CTRL + ΔDH, and CTRL + ΔTranF, respectively. In each sensitivity experiment, only the Future input of interest is used, and all other inputs remain the same as those in the CTRL run. Table S1 in Supporting Information S1 provides a summary of the various experiments performed in this study. Equations used to calculate the imposed forcing terms, including diabatic heating and transient momentum fluxes, are shown in Text S1 in Supporting Information S1.
2.3 Methods
The TC intensification rate is estimated as the linear regression coefficient of the storm maximum wind speed over five successive 6-hr track locations, including the current location. Locations where the center of the TC crosses land at any point during this period are excluded from our analysis. Also, we only consider TC track locations that are at least 18 hr apart to ensure that they are independent (Kossin et al., 2020). In this study, we define “nearshore” as a distance within approximately 3° or about 200 nautical miles of the coastline (Balaguru et al., 2022). Besides being a definition adopted by the United Nations for economic reasons, this is the approximate distance traveled by a TC in a day, based on the global mean translation speed of about 4.8 m s−1 (Yamaguchi et al., 2020). In addition to using a “distance from the coast threshold,” we also use thresholds for wind and translation speeds to sub-sample data. This is to ensure that distributions of storm state for the two comparative periods are statistically similar. For the global observational and HighResMIP TC intensification analysis, the distance from coast (d), wind speed (w) and translation speed (t) thresholds used to identify “nearshore” TC track locations are as follows: d ≤ 3.0°, 35 kt ≤ w ≤ 75 kt, 3 ms−1 ≤ t ≤ 10 ms−1. On the other hand, “offshore” is simply everywhere else in the basin where the distance threshold is not satisfied. Note that the corresponding wind speed and translation speed thresholds are also applied to subsample the offshore data in various basins. For all probability distributions of TC intensification rates, uncertainty or error bars are estimated based on the “Monte Carlo” method of repeated random sampling (Balaguru et al., 2022). From a given distribution, we randomly select approximately half of the samples to generate a Probability Distribution Function (PDF), a process that is repeated a thousand times. Following this, the mean and standard deviation estimated across the PDFs produced yield the corresponding mean PDF and error bar magnitudes, respectively.
For computing trends in environmental parameters, the domains used for the various coastlines are as follows: US East and Gulf coasts (10°N–45°N, 100°W–20°W), Mexican west coast (10°N–45°N, 140°W–100°W), East Asian coast (10°N–45°N, 100°E−180°E), South Asian coast (10°N–30°N, 50°E−100°E), Southeast African coast (30°S–10°S, 30°E−80°E) and Australian coast (30°S–10°S, 80°E−160°W). In each domain, locations that are within 3° of the coastline are considered “nearshore” and the other locations are treated as “offshore.” On the other hand, note that terms such as “North Atlantic” or “Northwest Pacific” refer more generally to the various ocean regions, which include the nearshore and offshore regions. VWS is estimated as the magnitude of the vector difference in horizontal winds between 200 and 850 hPa. All parameters are averaged over the months of Jun–October in the Northern Hemisphere and December-April in the Southern Hemisphere when 90% of TCs tend to occur. Finally, thermodynamic potential intensity (K. A. Emanuel, 1999) is used to support results based on SST.
3 Results
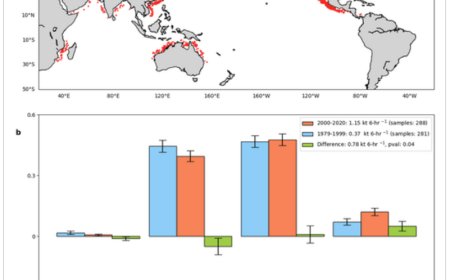
We begin by analyzing observed changes in global 24-hr TC intensification rates (see “Methods”) in the nearshore region over the period 1979–2020 (Figure 1). This coincides with the satellite era, when TC data is more reliable (Moon et al., 2019), and with modern reanalyses that resolve the ambient environment with higher fidelity (Gerber & Martineau, 2018). Probability distributions of nearshore TC intensification rates reveal a noticeable shift toward higher values of intensification for the second half of the 42-year period (Figure 1b). The global mean TC intensification rate for 1979–1999 is 0.37 kt 6-hr−1. However, for the later period of 2000–2020, the intensification rate is 1.15 kt 6-hr−1, which roughly translates to a 3 kt increase in intensity over a 24-hr interval. This increase in nearshore TC intensification, statistically significant at the 5% level, indicates that storms have intensified more quickly in the later period close to the coast. Over the same period, the mean offshore TC intensification rate has not increased significantly (Figure S1 in Supporting Information S1). These results are in good agreement with those of Y. Li et al. (2023) who showed a larger increase in instances of TC rapid intensification in coastal regions relative to offshore regions over a similar period. Note that the results are not contaminated by variations in storm state, since the TC data have been subsampled so that the distributions of storm initial intensity and translation speed are statistically similar for the two periods (Balaguru et al., 2018, 2022). While these are results based on best track data from IBTrACS (Knapp et al., 2010), similar results are obtained (Figure S2 in Supporting Information S1) when using TC track data derived from a homogenized record of geostationary satellite images (Kossin et al., 2020), highlighting their robustness.
(a) Nearshore TC track locations used in this analysis. (b) Probability distributions of 24-hr TC intensification rates for the initial period (1979–1999) in blue, later period (2000–2020) in orange and the difference in green. The mean TC intensification rates for the two periods and the corresponding sample sizes, and the mean difference including the p-value, are shown in the figure legend. A Student's t-test for difference of means is used to ascertain statistical significance. The error bars have been estimated using the Monte Carlo method of repeated random sampling. Note that the data have been sub-sampled to ensure that distributions of storm state are statistically similar for the two periods (see “Methods”). TC track data are based on IBTrACS (Knapp et al., 2010).

The results for individual basins (Table 1) are broadly consistent with global mean changes. For all regions except the west coast of Mexico, the change in nearshore intensification rate is larger than the change over the rest of the corresponding basin. However, changes for the Mexican west coast, which has the least number of landfalls among all major TC basins (Weinkle et al., 2012), are not statistically significant. Changes are also insignificant for the South Asian coast, likely due to the limited number of TCs in the North Indian Ocean (Weinkle et al., 2012). For the US East and Gulf coasts, Southeast African coast and Australian coast, the changes in the nearshore TC intensification rates are about 1–3 kt 6-hr−1 larger than in the corresponding offshore regions. Despite a smaller difference in the northwestern Pacific (0.5 kt 6-hr−1), the nearshore TC intensification rate still shows a stronger increase compared to regions away from the coast (Table 1). To better understand these changes in TC intensification rates, we now examine the evolution of certain large-scale environmental parameters that play critical roles in storm intensification (Tao & Zhang, 2014).
| US East and Gulf coasts | Mexican West coast | East Asian coast | South Asian coast | Southeast African coast | Australian coast | |
|---|---|---|---|---|---|---|
| Nearshore Intensification rate (kt 6-hr−1) | 2.72 | −0.73 | 1.03 | 1.44 | 1.88 | 1.69 |
| Offshore intensification rate (kt 6-hr−1) | −0.35 | −0.24 | 0.53 | 0.60 | 0.58 | 0.83 |
- Note. TC track data from IBTrACS (Knapp et al., 2010) are used for the analysis. The values in bold indicate that the change in the mean intensification rate is statistically significant at the 95% level based on a Student's t-test for difference of means. Note that the global thresholds for sub-sampling provided in “Methods” have been slightly modified in each basin to account for regional variations in storm state.
Trends in observed SST, based on data from the UK Met Office's Hadley Center (Rayner et al., 2003), indicate that a broad warming of the upper ocean has occurred over the North Atlantic, northern and southwestern Pacific, and tropical Indian Ocean regions (Figure 2a) from 1979 to 2020. In the eastern tropical Pacific, however, there is a La Niña-like cooling trend (Kohyama et al., 2017; Zhang et al., 2011). Next we evaluate trends in VWS and 600-hPa RH derived from the NCEP-DOE atmospheric reanalysis II (Kanamitsu et al., 2002). Over the period of 1979–2020, VWS decreased broadly in the tropical Indian Ocean, near the US coast and over the subtropical North Pacific, including the coastal regions of East Asia (Figure 2b). On the other hand, strong increases in VWS are visible over the central and eastern tropical Pacific. RH shows a decrease in the tropics, particularly south of the equator and across the subtropical North Pacific (Figure 2c). Conversely, positive RH trends are observed near the US Atlantic and Gulf coasts, the northeastern tropical Pacific, the Mexican west coast, parts of the East Asian coast, the northwestern Arabian Sea coast, near Madagascar, and over the Maritime Continent near the Australian coast. To discern the role of these environmental changes in TC intensification noted earlier (Figure 1 and Table 1), we computed their global mean nearshore and offshore trends (Figure 3).
Spatial pattern of trends in (a) SST (°C year−1), (b) VWS (m s−1 year−1) and (c) RH (% year−1) for the 42-year period 1979–2020. The parameters have been averaged over the months of June-October in the Northern Hemisphere and December-April in the Southern Hemisphere. While the SST data are from the UK Met Office's Hadley Center, atmospheric winds and humidity are from NCEP-DOE II reanalysis. Stippling indicates that trends are statistically significant at the 5% level.
Coastal and offshore trends in (a) SST (°C year−1), (b) Vertical Wind Shear (m s−1 year−1), and (c) Relative Humidity at 600 hPa (% year−1). The parameters have been averaged over the months of June–October in the Northern Hemisphere and December–April in the Southern Hemisphere. The trend values and the p-values for statistical significance, based on the Student's t-test, are shown in the figure legends. For further details regarding the domains used for averaging, please see “Methods.” Trends are based on Hadley SST (Rayner et al., 2003) and NCEP-DOE II atmospheric reanalysis (Kanamitsu et al., 2002). In each panel, shading represents the 95% confidence intervals.


Globally, nearshore SST keeps pace with offshore SST. The rate of SST warming in both the nearshore and offshore regions is about 0.014°C year−1 (Figure 3a). The use of Potential Intensity, an estimate of the maximum intensity that a TC can attain under the given ocean-atmosphere conditions (K. A. Emanuel, 1999), yields consistent results (Figure S3 in Supporting Information S1). These results are in good agreement with (Y. Li et al., 2023) who showed similar rates of increase for maximum potential intensity near coastal and offshore regions. Trends in VWS are negative for both the nearshore and offshore regions, with the magnitude of the nearshore trend (−0.026 m s−1 year−1) considerably larger than the offshore trend (−0.011 m s−1 year−1). A stronger weakening of global nearshore VWS is primarily driven by substantial decreases of VWS near the East Asian and Australian coasts (Table S2 in Supporting Information S1). In addition, for the nearshore region, the RH trend is positive and significant (0.057% year−1), in contrast to the offshore region where the trend is positive but weak. The nearshore RH trend is dominated by increases near the US and Australian coasts (Table S2 in Supporting Information S1). These results, which imply that the large-scale environment has become more favorable for storm development in the nearshore region compared to the offshore region, are in excellent agreement with those of Y. Li et al. (2023). Despite the initial use of Hadley SST and NCEP-DOE Reanalysis II for the storm environment analysis, substituting ERA5 reanalysis data (Hersbach et al., 2020) leads to consistent conclusions. This indicates that our findings are not sensitive to specific data sources (Figure S4 in Supporting Information S1).
We have shown a significant rise in the average intensification rate of nearshore TCs on a global scale during 1979–2020, and this increase is likely driven by an interplay of various environmental changes occurring over the same time frame. The findings raise questions about the probability that the trends will persist into the future and the possible contribution of anthropogenic forcing. To address this, we computed changes in TC intensification based on simulations from HighResMIP (Haarsma et al., 2016). In HighResMIP, a subset of CMIP6 (Eyring et al., 2016), climate models are run at a spatial resolution that is high enough to allow explicit simulation of TCs (Roberts et al., 2020). See “Methods” for further information related to the various models used in our analysis. It's noteworthy that the HighResMIP models, despite their high resolution, simulate weaker changes in TC intensity compared to the best track data (Figure S5 in Supporting Information S1). Therefore, we only use HighResMIP in this study for a qualitative assessment of the impacts of climate change on TC intensification but not for a direct comparison with observations. Again, TC track locations near all major coastlines are considered in our analysis (Figure 4a). Locations where the intensity of the TC is below “Tropical Storm” strength (34 kt) are excluded from our analysis. The historical period covers the years 1979–2014, while the future period spans 2015–2050. The future climate is based on the “SSP585” emissions scenario in which the radiative forcing of greenhouse gases is expected to reach 8.5 W m−2 by the end of 21st century (O’Neill et al., 2016). Also, TC track data is subsampled to ensure that the distributions of TC initial intensity and translation speed are statistically similar for the two comparative periods and that any two track locations are at least 18 hr apart for sample independence.
(a) Nearshore TC track locations used in this analysis. (b) Probability distributions of 24-hr TC intensification rates for the historical period (1979–2014) in blue, later period (2015–2050) in orange and the difference in green. The mean TC intensification rates for the two periods and the corresponding sample sizes, and the mean difference including the p-value, are shown in the figure legend. The error bars have been estimated using the Monte Carlo method of repeated random sampling. Note that the data have been sub-sampled to ensure that distributions of storm state are statistically similar for the two periods (see “Methods”). TC track data are obtained from five fully coupled climate models belonging to HighResMIP (Haarsma et al., 2016). See “Methods” for more details regarding the various models and simulations used.

Probability distributions of TC intensification rates based on HighResMIP suggest that in the nearshore region TCs will continue to strengthen faster in the future climate (Figure 4b). The mean intensification rate for the historical period of 1979–2014 is −0.07 kt 6-hr−1, and it increases to 0.03 kt 6-hr−1 for the future period of 2015–2050. Note that the mean intensification rate is weaker in HighResMIP relative to observations, likely because of limitations simulating intense storms. Further, there are increases in mean intensification rate in all coastal areas except near the west coast of Mexico and the Australian coast, and in those basins where there is an increase, the change in the nearshore region is greater than in the offshore region (Table 2). For the Mexican west and Australian coasts, the changes in nearshore TC intensification rates are insignificant. Throughout the study, we used a distance threshold of ∼3° to identify “nearshore” regions. Further sensitivity analysis with a varying distance threshold (Figure S6 in Supporting Information S1) shows that our results are not overly dependent on the exact choice of the threshold. Furthermore, the analysis demonstrates that the most significant increase in TC intensification occurs in proximity to the coastline, with a diminishing effect as one moves away from it, reinforcing the notion that the signal is predominantly coastal in nature and does not represent a basin-wide shift.
| US east and Gulf coasts | Mexican West coast | East Asian coast | South Asian coast | Southeast African coast | Australian coast | |
|---|---|---|---|---|---|---|
| Nearshore Intensification rate (kt 6-hr−1) | 0.27 | −0.11 | 0.21 | 0.14 | 0.10 | 0.02 |
| Offshore Intensification (kt 6-hr−1) | 0.00 | 0.03 | 0.02 | −0.08 | −0.02 | −0.00 |
- Note. TC track data are based on 5 fully coupled climate models from HighResMIP (Haarsma et al., 2016). See “Methods” for further details regarding the various models used. While data for the period 1979–2014 are from the “hist-1950” simulations, data for the period 2015–2050 are from the “highres-future” simulations. The values in bold indicate that the change in the mean intensification rate is statistically significant at the 95% level based on a Student's t-test for difference of means. Note that the global thresholds for sub-sampling provided in “Methods” have been slightly modified in each basin to account for regional variations in storm state.
To better understand these projections of TC intensification rate, we computed multi-model ensemble mean trends in SST, VWS and RH based on the same HighResMIP models (see “Methods”). Trends are computed over the 72-year period 1979–2050 and under the SSP585 emissions scenario. Again, as in observations, the trend in global mean nearshore SST aligns with the offshore SST trend (Figure S7 in Supporting Information S1). While VWS exhibits a decreasing trend in the nearshore region, the corresponding trend for the offshore region is insignificant. Similarly, a stronger increasing RH trend is obtained for the nearshore region compared to the offshore region. These results are in line with those of Y. Li et al. (2023), who showed that increasing anthropogenic forcing is likely contributing to a relatively more favorable nearshore environment for TC intensification. Thus far, our analysis of multiple observations and multi-model ensembles indicates that a stronger decrease in VWS and a larger increase in RH near the coast relative to offshore regions are responsible for the greater increase in nearshore TC intensification. Several prior studies have suggested that RH will rise in oceanic regions owing to enhanced surface evaporation as the climate warms (Laîné et al., 2014; Lorenz et al., 2010; Schneider et al., 2010; Zhou et al., 2023). Based on energetic and hydrological balances, global-mean precipitation and oceanic evaporation must increase at a similar pace, approximately 2% per K, in response to global warming. Further, when it comes to a larger increase in coastal RH, increasing land-sea thermal contrast, and the consequent enhancement of lower-level cyclonic vorticity near the land-sea boundary, may play a role in some regions (Balaguru et al., 2022). However, in contrast to the extensively studied RH response in a warmer world, how VWS will change at the global scale and the underlying physical rationales have not been systematically investigated.
To address this, we examine projected long-term trends in VWS using a larger multi-model ensemble including 15 CMIP6 models under the SSP585 emissions scenario (Figure S8 in Supporting Information S1). Consistent with previous findings, the CMIP6 multi-model projects significant decreasing and increasing trends in VWS for nearshore and offshore regions, respectively (Figure S8a in Supporting Information S1). A closer examination of future trends in VWS for different coastal regions reveals that the global mean decrease is primarily due to changes in the Northern Hemisphere (Figure S8b in Supporting Information S1). More specifically, near the US, East Asian and South Asian coasts, there are substantial decreasing trends in VWS of about −0.01 to −0.02 m s−1 year−1. Therefore, to explain the observed and projected changes in nearshore TC intensification, we need to understand the physical mechanisms driving changes in atmospheric circulation and how they affect VWS. To answer this, we performed a set of idealized numerical sensitivity experiments with a nonlinear SWM (Ting & Yu, 1998). The SWM computes deviations from a zonally symmetric mean state when forced with asymmetric forcings, such as diabatic heating (see “Methods” for further details). Here we force the SWM with projected changes in zonal mean basic state, diabatic heating, and transient momentum forcings derived from CMIP6 models.
When all changes are applied simultaneously, the SWM broadly replicates the shear response of CMIP6 models to anthropogenic forcing (Figures 5a and 5b). The SWM successfully captures the broad decline in VWS across various regions, including over the continental US (including near the US East and Gulf coasts) (Balaguru et al., 2022; Kossin, 2017; Ting et al., 2019), and along the East Asian coast between 20°N and 40°N (Hsu et al., 2021; Lee et al., 2019). However, deviations emerge in regions where the SWM either underestimates or overestimates the magnitude of changes. For example, it simulates a weaker decrease in VWS near the central Pacific Ocean around 20°N and a more pronounced increase in VWS over regions including northern Eurasia, the tropical northeast Pacific, and the northern parts of the Bay of Bengal and the South China Sea (Figure 5b). On the other hand, CMIP6 models project a weak increase in shear (Figure 5a and Figure S7b in Supporting Information S1) and decreasing 600-hPa RH (not shown) over the northern parts of the Bay of Bengal and the South China Sea. In other words, the nearshore environment will not become more favorable for TC intensification over these regions. A plausible explanation for these discrepancies is that zonal-mean flows, transient eddies, and diabatic heating are coupled together and interact with each other in the full-physics CMIP6 models, but such interaction is prohibited in the SWM. Additionally, inaccuracy of the dissipation parameterization (Held et al., 2002) or other missing physical processes, such as nonlinear interactions between land and atmosphere (Douville, 2010; Koster et al., 2016; Teng et al., 2019), could contribute to disparities in the shear response. Nevertheless, regions where the SWM overestimates the shear increase, such as the central-to-eastern tropical Pacific and northern Eurasia, are far away from our region of interest (i.e., the coastal areas of the US and Asia). Therefore, the driving mechanisms responsible for shear changes over these regions are not the main focus of this study. Furthermore, despite the biases, the pattern correlation coefficient of VWS changes between the CMIP6 ensemble mean (Figure 5a) and the SWM's solution (Figure 5b) is 0.63 over the northern tropical-extratropical (0°–60°N) oceans. Given the SWM's ability to reproduce the overall spatial pattern of VWS changes, particularly over the coastal areas characterized by decreasing VWS, we can further decompose the effect of each forcing mechanism and investigate their relative importance.
(a) Changes in VWS between the near-future (2015–2034) and late 21st century (2081–2100) periods based on 15 CMIP6 models. White stippling denotes the areas where the changes in are statistically significant at 95% level based on the Student's t-test. (b) Same as (a), but for changes simulated by the Stationary Wave Model (SWM). (c) Contribution from the anomalous heating to changes in the VWS. (d) and (e) are same as (c), but for contributions from the anomalous zonal-mean basic state and transient forcing, respectively. The future climate is based on the “SSP585” emissions scenario. See “Methods” for further details regarding the various models used in this analysis and the various experiments performed with the SWM.

Examining the effects of individual forcings (Figures 5c–5e), it is clear that changes in diabatic heating (Figure 5c) and basic state (Figure 5d) are dominant in shaping the spatial pattern of shear response over the Northern Hemisphere, whereas the contribution of anomalous transient forcing is small (Figure 5e). Much of the shear response along the US coast and Mexican west coast is linked to anomalous heating forced by anthropogenic warming (Figure 5c). The meridional dipole-like response of VWS over the Central and North American region is mainly excited by enhanced heating over the tropical eastern Pacific, with a secondary contribution from anomalous diabatic cooling over the tropical North Atlantic (Figure S9a in Supporting Information S1) (Balaguru et al., 2023a). Circulation responses at different levels are largely consistent with Gill's model solution (Gill, 1980). Furthermore, the projected changes in heating patterns over the tropical Pacific and Atlantic are predominantly governed by the spatial distribution of future SST warming (Chadwick et al., 2014; Kent et al., 2015; Xie et al., 2010). On the other hand, climate change-induced anomalous heating has contrasting effects on the VWS in various regions of Asia. It contributes to a decrease in VWS near Taiwan and the southeastern coast of China, but tends to strengthen VWS over northeast Asia and the northern Indian Ocean (Figure 5c). Further investigation reveals that the meridional tripole-like pattern of VWS change over the Asian continent and the western North Pacific (Figure 5c) is mainly driven by the formation of a heat-induced stationary baroclinic Rossby wave (Figure S10 in Supporting Information S1). The circulation response exhibits a phase reversal in its vertical structure (Figure S10 in Supporting Information S1) and is likely reinforced by intensified heat sources over the western North Pacific and the Indian sub-continent (Figure S9a in Supporting Information S1) (Ting, 1994), consistent with the projected increases of monsoon precipitation over these regions (B. Wang et al., 2020; Z. Chen et al., 2020; He et al., 2020; Seo et al., 2013; Sun & Ding, 2010). At 200 hPa, the anomalous high contributes to an acceleration of the jet on its northern and southern flanks (Figure S10a in Supporting Information S1), which causes the VWS to increase between 40°N and 50°N and above the northern Indian Ocean (Figures 5b and 5c). On the other hand, the strengthened easterly wind between 20°N and 30°N (Figure S10a in Supporting Information S1) counteracts the weak westerlies above Taiwan and the coastal region of southeastern China, reducing the shear over these regions (Figure 5c).
An altered zonal mean basic state is acting to decrease the VWS over Northeast Asia and the North Indian Ocean, while simultaneously causing a slight increase in shear near 40°N over North America (Figure 5d). In accordance with the anomalous cyclone centered near the Tibetan Plateau, the westerly jet near Korea and Japan, as well as the upper-level easterlies on the southern side of the Asian monsoon anticyclone both weaken (Figure S11 in Supporting Information S1). Meanwhile, anomalous anticyclones above Hawaii and the tropical-subtropical North Atlantic result in a slight enhancement of extratropical westerlies over the northern US (Figure S11 in Supporting Information S1). These upper-level circulation changes are consistent with the observed reductions in VWS over Northeast Asia and the North Indian Ocean, as well as the slight enhancement of shear near 40°N over North America (Figure 5d). Upon closer examination, it is observed that the changes in basic states cause an overall weakening in stationary wave circulations, especially south of 40°N (Figure S11 in Supporting Information S1). This outcome aligns with the slowdown of tropical convective circulations that is anticipated to occur in a warmer climate (Held & Soden, 2006; Vecchi & Soden, 2007). The coupling between vertical motion and rotational winds occurs through Sverdrup balance (Wills et al., 2019; T.-C. Chen, 2003). Alternatively, the upper tropospheric vorticity can be altered by the divergent winds through vortex stretching and vorticity advection, and one may interpret convectively forced upper-level divergence as a source for Rossby waves (Sardeshmukh & Hoskins, 1988). Decreased convective mass fluxes in the tropics, along with the slower overturning circulation, can be primarily attributed to the heightened static stability of the tropical-subtropical troposphere (Figure S9b in Supporting Information S1), which is a robust consequence of the quasi-moist adiabatic adjustment to surface warming (Held, 1993; Knutson & Manabe, 1995; Manabe & Wetherald, 1975). From the perspective of energy balance, the strength of the atmospheric overturning circulation must decrease as the climate warms because precipitation changes are constrained by small variations in radiative fluxes and cannot increase as fast as lower tropospheric moisture content (Betts, 1998; Held & Soden, 2006; Vecchi & Soden, 2007). An additional sensitivity experiment was conducted to further investigate the impact of increased warming in the upper troposphere on shear changes. The experiment only retains the enhanced upper-level warming (not shown). Interestingly, as compared to Figure 5d, the spatial pattern of VWS response over the Northern Hemisphere remains largely unchanged (not shown). Thus, we conclude that the enhanced static stability plays a crucial role in reducing the VWS across Northeast Asia and the North Indian Ocean.
4 Discussion
The results from our study have profound implications for populations living in coastal regions, operational forecasters, and decision makers. Under global warming, a heightened nearshore intensification rate implies a potential strengthening of landfalling TCs' destructive capacity, primarily determined by their maximum intensity and inner-core precipitation (Hsu et al., 2021). Changes in these factors are closely associated with the intensification rate of TCs within coastal regions (Chih et al., 2023; Hsu et al., 2021; R. C. Li et al., 2017; Park et al., 2014). The stronger winds and heavier precipitation produced by landfalling TCs can exacerbate the impacts of storm surge and increase the risk of coastal flooding (Timmermans et al., 2017, 2018; Woodruff et al., 2013). Combined with anticipated growth of coastal population and wealth, TCs striking coastal areas are likely to result in more substantial economic losses, fatalities, and property damages during the late 21st century (Hu et al., 2023; Huang et al., 2022). In our study, we only considered the coastlines of major continental landmasses affected by TCs as “nearshore.” However, several island regions across the world remain vulnerable to the disastrous effects of landfalling TCs. For instance, an examination of observed TC data for Philippines and Madagascar indicates that the mean nearshore TC intensification rate may also have increased for those regions (Figure S12 in Supporting Information S1). Future studies focusing on changing nearshore TC intensification for such regions, including the responsible mechanisms, are needed.
In examining the large-scale circulation changes contributing to enhanced TC intensification, we observe a significant role played by the decrease in VWS near coastal areas, both over the historical period as well as in future projections (Figure 3 and Figure S7 in Supporting Information S1). This is partly because the US coastlines are situated in the subtropics (about 20°N–45°N) where changes in diabatic heating act to reduce VWS. Also, the nearshore regions over the Northwest Pacific and the North Indian Ocean are located on the eastern and southern flanks of the Asian monsoon anticyclone, respectively. Here, the weakening of the anticyclonic circulation near the Tibetan Plateau (Figure S11 in Supporting Information S1) can effectively reduce VWS (Ma & Yu, 2014; C. Wang & Wang, 2021; Zang et al., 2023). Past studies suggested that a poleward shift of the extratropical westerlies could decrease VWS and potentially increase TC risk near the populated midlatitude regions in Asia and North America (Kossin et al., 2014; Lee et al., 2019). Nevertheless, our SWM experiments reveal that the primary factor responsible for reducing shear over Northeast Asia is the enhanced tropical upper-level warming (Figure 5d and Figure S9b in Supporting Information S1). Additionally, inter-basin changes in diabatic heating are shown to play a critical role in contributing to the weakened VWS along the US coastlines (Figure 5c and Figure S9a in Supporting Information S1).
Satellite measurements have revealed that the upper atmosphere has been warming at a faster rate than the surface since the year 2000, and the observed tropical tropospheric temperature trends have been accurately captured by current CMIP6 models (Vergados et al., 2021). The faster warming in the tropical upper troposphere is expected to continue during the late 21st century and is regarded as a robust climate projection across different models (Kumar et al., 2022). Therefore, to improve our confidence in future VWS projections, it is essential to understand the uncertainty of projected heating trends, which is closely related to inter-model spread in SST warming pattern (Chadwick et al., 2014; Kent et al., 2015; Xie et al., 2010). Previously, CMIP5 models did not have consensus regarding an El Niño-like warming pattern in the future (Dong et al., 2021). Although the potential for enhanced future warming in the eastern Pacific has emerged more clearly in the CMIP6 multi-model ensemble, considerable inter-model spread remains (Balaguru et al., 2023a; Dong et al., 2021). Further work is needed to reduce uncertainty in model projections of the tropical ocean-atmosphere mean state.
Acknowledgments
This research was supported by the U.S. Department of Energy (DOE) Office of Science Biological and Environmental Research as part of the Regional and Global Model Analysis (RGMA) program area through the Water Cycle and Climate Extremes Modeling (WACCEM) project and the collaborative, multiprogram Integrated Coastal Modeling (ICoM) project. The research used computational resources from the National Energy Research Scientific Computing Center (NERSC), a U.S. DOE User Facility supported by the Office of Science under contract DE-AC02-05CH11231. The Pacific Northwest National Laboratory is operated for U.S. DOE by Battelle Memorial Institute under contract DE-AC05-76RL01830. For CMIP5 and CMIP6, the U.S. DOE's Program for Climate Model Diagnostics and Intercomparison provides coordinating support and led the development of software infrastructure in partnership with the Global Organization for Earth System Science Portals. We acknowledge the World Climate Research Program's Working Group on Coupled Modeling, which is responsible for CMIP5 and CMIP6, and thank the climate modeling groups for producing and making available the model output. G.R.F. was funded by base funds to NOAA/AOML's Physical Oceanography Division.
What is Your Reaction?
 Like
0
Like
0
 Dislike
0
Dislike
0
 Love
0
Love
0
 Funny
0
Funny
0
 Angry
0
Angry
0
 Sad
0
Sad
0
 Wow
0
Wow
0