


Increases in Italian Landslides
This study examines the relationship between temporal clustering of precipitation, North Atlantic Oscillation (NAO), Mediterranean Oscillation Index (MOI), synoptic conditions, and landslides in Italy. It finds that below-average NAO and MOI increase clustered precipitation probability, influencing various landslide types, with additional links to temperature fluctuations for rock falls.
Most natural catastrophic events are caused by a sequence in time of multiple not-independent precipitation events, also called temporal clustering of precipitation. This is related to the process of saturation of the soil that in most cases is not saturated by a single precipitation event. For example, soil moisture is important in the occurrence of landslides, since it causes instability of the slope, or in floods, since it prevents water from infiltrating. When an extreme event is caused or amplified by the occurrence of multiple meteorological events in time or space we talk about climate-related compound events. In this work we look at the characteristics of temporal clustering of precipitation in Italy, where and when it occurs and its relation with large scale circulations. Then, we investigate its role, together with the role of single intense precipitation events and temperature, as a trigger of different landslide types (complex, debris flow, fall, flow, and sliding). In this work we bring a clearer understanding of the trigger of landslides in Italy, and we highlight the role of temporal clustering of precipitation for hazards related with a saturation process.
Abstract
The occurrence of multiple precipitation events not-independent in time, that is, a temporal clustering, is an example of a temporal compounding event. This type of forcing is of great relevance for the occurrence of different natural hazards, like floods and deep-seated landslides, for which previous soil saturation plays an important role in shaping the associated hazard. Using ERA5-Land data set and E-OBS, we firstly investigate the spatial and temporal characteristics of temporal clustering of precipitation over the Italian territory, and we relate it with two oscillation patterns, namely North Atlantic Oscillation (NAO) and Mediterranean Oscillation Index (MOI), and with common synoptic conditions. Then, we explore the role of temporal compounding of precipitation in the generation of different movement types (complex, debris flow, fall, flow, and sliding) using the database of landslides from the Aree Vulnerate Italiane project (in Italian AVI, meaning Areas Affected by Landslides or Floods). From this study it emerges that below average values of NAO and MOI increase the probability of having clustered precipitation events. For all types of landslides, except rock falls, we observed that the majority of the events are preceded by a temporal clustering of precipitation, over longer time windows for complex events, shorter for debris flows. For rock falls, we found also a link with low minimum temperature and freeze-thaw cycles for winter events and high maximum temperature for summer events. This work contributes to the investigation of temporal clustering of precipitation in connection with natural hazards characterized by a mechanism of saturation.
Key Points
-
We introduced a statistical method to detect temporal clustering of events, for example, precipitation
-
Negative dependence between some teleconnection indices and temporal clustering of precipitation in winter in Italy
-
Temporal clustering of precipitation is a significant trigger of landslides in Italy. Temperature is also relevant for rock falls
Plain Language Summary
Most natural catastrophic events are caused by a sequence in time of multiple not-independent precipitation events, also called temporal clustering of precipitation. This is related to the process of saturation of the soil that in most cases is not saturated by a single precipitation event. For example, soil moisture is important in the occurrence of landslides, since it causes instability of the slope, or in floods, since it prevents water from infiltrating. When an extreme event is caused or amplified by the occurrence of multiple meteorological events in time or space we talk about climate-related compound events. In this work we look at the characteristics of temporal clustering of precipitation in Italy, where and when it occurs and its relation with large scale circulations. Then, we investigate its role, together with the role of single intense precipitation events and temperature, as a trigger of different landslide types (complex, debris flow, fall, flow, and sliding). In this work we bring a clearer understanding of the trigger of landslides in Italy, and we highlight the role of temporal clustering of precipitation for hazards related with a saturation process.
1 Introduction
Compound climate-related, or weather-related, events are “the combination of multiple drivers and/or hazards that contributes to societal or environmental risk” (Zscheischler et al., 2018). The concept of compound climate-related event is relatively recent, introduced in 2012 with the IPCC special report on extremes (IPCC, 2012) and furtherly advanced by Leonard et al. (2014) and Zscheischler et al. (2018). The attention to these events is related to the fact that climate change could exacerbate the occurrence and effects of these events. Compound climate-related events have been categorized in four general classes (Zscheischler et al., 2020): (a) multivariate events where multiple drivers and/or hazards lead to an impact; (b) preconditioned events where a weather-driven precondition worsen the impacts of a hazard; (c) spatially compounding events where a co-occurrence of hazards leads to an aggregated impact; and (d) temporally compounding events where a succession of hazards leads to an impact. The emergence of compound events highlighted the need for interdisciplinary studies of extreme events, starting from the climatological variables up to the impacts. In this way it is possible to properly predict and reduce the resulting damages.
-
Fall and topple: detachment, fall, rolling, and bouncing of masses of geologic materials, such as rocks and boulders. They are strongly related to gravity, interstitial water, and mechanical weathering.
-
Sliding: mass movement where a distinct zone of weakness separates the stable underlying material from the sliding one. It can be distinguished in rotational slide, where the surface of rupture is curved, and translational slide, where the surface is planar.
-
Flow: they are landslides with a narrow and elongated shape that evolve due to the saturation of materials, mainly clayey and/or marly, by meteoric water.
-
Debris flow: rapid mass movement due to the mobilization of a combination of granular material and water. They are commonly caused by the erosion and mobilization of loose soil on steep slope due to intense surface-water flow.
-
Complex: combination of two or more of the above types.
This type of hazard can be caused by a variety of triggers: rainfall, snowmelt, stream erosion, changes in water or ground water level, volcanic activity, earthquakes, human induced disturbances or a combination of them. However, for these events, rainfall represents one of the most important triggering factors (Guzzetti et al., 2007). Sometimes short and high-intensity episodes are enough to trigger a landslides other times long-lasting episodes are required (Van Asch et al., 1999). Shallow landslides, with a slip surface not deeper than about 1.5 m, occur under a broad range of rainfall conditions, even though they are often related to short-duration and high-intensity rainfall events (Corominas & Moya, 1999). Deep landslides, with a slip surface deeper than about 1.5 m, on the contrary are usually driven by multiple moderate-intensity storms, occurring over weeks or months (Trigo et al., 2005). Recurrent wet periods generate high soil moisture and pore water pressure, that are required to trigger deep movements (Chen et al., 2017). The literature is abundant of contributions assessing the antecedent rainfall and rainfall thresholds initiating the landslides (Brunetti et al., 2010; Guzzetti et al., 2007; Peruccacci et al., 2017; Zezere et al., 2015). Less investigated is the dynamics of rainfall before landslides, that is, if it is possible to recognize the occurrence of particular temporal sequences of rainfall events, associated for example, with cyclone clustering (Dacre & Pinto, 2020) and/or atmospheric rivers (Ramos et al., 2015). In addition, the same rainfall total may occur concentrated or spread in time, in few intense events, or in several lower intensity ones, thus resulting in different run-off and soil saturation. Deep landslides may often be associated with monthly to seasonal fluctuations of the groundwater table. When the water table is high, also light to moderate rainfall may provide sufficient water to trigger slope movement (Fuhrmann et al., 2008). This means that not only rainfall triggers landslides directly but it also contributes to soil saturation up to the point where additional rainfall water induces the failure. Nevertheless, this knowledge is not always taken into account or integrated in the management of landslides risk. For example, in Campania region (southwestern Italy), the early warning system is based on simple rainfall thresholds, that look at accumulated rainfall on duration of 1–3 days (Reder & Rianna, 2021). A better understanding of the meteorological characteristics, precipitation, circulation patterns or temperature, triggering landslides in Italy may therefore be of help in better shaping the risk of landslide events.
Interesting results about the relation between the dynamics of rainfall and landslides were provided by Bevacqua et al. (2021), studying landslides in North of Lisbon region. They showed that about 70%–83% of deep landslides were preceded by a temporal cluster of precipitation events (over 23–90 days before the event), while only 7%–9% of shallow landslides were preceded by a cluster of precipitation (over 4–25 days before the event).
Moved by these results in this work we (a) investigate the spatial and temporal characteristics of temporal compounding of precipitation over the Italian territory, and whether its frequency can be related to some circulation patterns, and (b) analyze how far the temporal clustering of precipitation events may have a role in the occurrence of the main landslide types. In particular, following Bevacqua et al. (2021), we want to investigate if landslides can be viewed as the consequence of the temporal compounding or clustering of precipitation events. In this respect, we have (a) considered a statistical criterion in order to detect the presence of temporal clustering of precipitation events in a time series in a fixed temporal window (following Bevacqua et al. (2021) and Banfi and De Michele (2022)); then (b) applied this criterion to the Italian territory, a country where landslides are widespread natural phenomena; (c) assessed the synoptic conditions more prone to temporal clustering of precipitation; (d) investigated the connection between the temporal compounding of precipitation and the occurrences of different types of landslides. Thus, in Section 2, we present data sets and the methodology used; in Section 10 we illustrate our results; and in Section 13 we give our conclusions.
2 Data and Methods
2.1 Study Area
The analysis was performed considering all the Italian territory. Italy is located in Southern Europe with a total area of 301,230 km2. It is crossed by two mountainous range, the Apennines to the south and the Alps to the North, and by the large Po plain and it comprises two main islands, Sicily and Sardinia. A total of 68% of the Italian municipalities is exposed to high levels of hydrological and geological hazards, which are often caused by intense rainfall events, causing severe damage (Messeri et al., 2016b). From the geodynamic point of view, Italy is in fact an extremely active region, with frequent earthquakes and active volcanoes (Bosellini, 2017). Italy encompasses a broad range of climatic regimes: 14 of the 35 climatic regions occurring in Europe are there present. Alps and Northern Apennines are dominated by temperate climates while Southern Apennines have a so-called Mediterranean mountainous climate. Po Plain and the adjacent low hills are characterized by intermediate climates, that is, Mediterranean suboceanic to subcontinental. The former is widespread also in central Italy and it extend toward the South of Italy inlands leaving place to more characterized Mediterranean climates, reaching also Mediterranean to subtropical climates, either partly semiarid or influenced by mountains (Costantini et al., 2013).
2.2 Meteorological Data
Precipitation series over Italy was obtained from the reanalysis product, ERA5-Land (Muñoz Sabater, 2019). The data is a replay with a finer spatial resolution of the land component of the ERA5 climate reanalysis (Hersbach et al., 2020). The data set has a spatial resolution of 0.1° × 0.1° and a temporal resolution of one hour (resampled to one day for the present purposes) with a temporal coverage that spans the period from 1950 to present. In order to have an idea of the performance of the data set, the spatial distribution of temporal clustering of precipitation was compared with the one obtained using E-OBS (Cornes et al., 2018). The latter is a daily gridded observational data set covering Europe, with a 9 km spatial resolution. It is based on the blended time series of the stations collected by the European Climate Assessment and Data set (ECA&D) initiative. Finally, maximum and minimum daily temperature from E-OBS were used to explain the occurrence of some landslide phenomena. The investigated period goes from 1950-12-01 up to 2020-11-30.
-
WT1: Marked northward expansion of the Azores anticyclone with blocked anticyclonic circulation over the North Atlantic and northerly winds over Italy.
-
WT2: Moderate northward expansion of the Azores anticyclone with cyclonic circulation over south Scandinavia and northwesterly winds over Italy.
-
WT3: Marked cyclonic circulation over Iceland with anticyclonic circulation over northern central Europe accompanied with increased precipitation over Italy, generated by intermittent Atlantic perturbations.
-
WT4: Cyclonic circulation over the North Atlantic and cyclonic circulation over west Mediterranean Europe and central Mediterranean Europe with decreased precipitations over central Mediterranean Europe.
-
WT5: Cyclonic circulation over the north-west Atlantic with marked anticyclonic circulation over west Mediterranean Europe and central Mediterranean Europe, inducing warm and dry conditions over Italy.
-
WT6: Anticyclonic circulation over Iceland and cyclonic circulation over central Europe, with higher precipitation over Tuscany fueled by intrusions of Arctic and polar continental air.
-
WT7: Southwesterly flow over the North Atlantic with ridging over the British Isles toward Scandinavia, with easterly wind over central Mediterranean Europe resulting in very cold dry conditions.
-
WT8: Cyclonic circulation over West Europe with a ridge over the eastern Mediterranean.
Finally, the series of North Atlantic Oscillation (NAO) Index and of Mediterranean Oscillation Index (MOI) (Conte et al., 1989; Palutikof, 2003; Palutikof et al., 1996) were obtained from the NOAA CLimate Prediction Center (https://www.cpc.ncep.noaa.gov/products/precip/CWlink/pna/nao.shtml) and the Climatic Research Unit, University of East Anglia (https://crudata.uea.ac.uk/cru/data/moi/), respectively. The MOI index was computed as the normalized pressure difference between Algiers and Cairo.
2.3 Landslides Data
Landslide events over Italy were obtained from the Aree Vulnerate Italiane (AVI) database, an inventory of landslides and floods occurred in Italy until 2001 by the National Group for Prevention of Hydrological Hazards (GNDCI) of the National Research Council (CNR) (http://avi.gndci.cnr.it). It is a point data set in which landslides and related characteristics were identified from newspaper articles (Guzzetti et al., 1994).
From the database, we extracted only the landslides occurred in the period 1950–2001. We disregarded all the events with missing information about date of occurrence, type of movement, or location and with a regional or provincial spatial accuracy. For the events with multiple locations associated, the average of the coordinates was computed. This may occur since the positions of landslides were identified looking at locations' names reported in the news, therefore multiple locations may be present. In addition, when a road is identified as location, the average between the end points of the road is used. Considering the selected events, we only investigated landslides that were triggered by precipitation. We also included events with unknown trigger. Since rainfall is the main driver of landslides, we assumed that when it was missing this was the trigger. Large precipitation systems may cause multiple landslides in connected locations. The data set used reports each of them as a separate record. Since the main purpose of the analysis is the investigation of landslides triggers, keeping all of them may bias the results, adding redundant information and resulting in a biased predominance of a trigger, We therefore grouped event together when they were occurring in the same or adjacent days and closer than 55 km, considering size of small to medium precipitation systems (Zhang & Wang, 2021). For each group we than retained only one record for landslide type, chosen as the most central event in space. In this way, we retained 895 events (99 flow events, 64 debris flow, 43 complex events, 562 fall events, 127 sliding events).
The AVI inventory, despite the remarkable effort beyond its construction and the amount of data that contains, suffers of some limitations due to the available technology at the time of its collection. The spatial distribution may be biased by the availability of local newspaper reports, and some area may be more covered than others. Collecting landslides appearing in the news means that only events that attracted public attention are present, that is, events that likely resulted in some kind of damages or losses. This however does not imply that only large landslides are reported since also minor ones can cause damages. If we assume that there is not a significant difference in the mechanisms triggering landslides occurring far from the human infrastructures and landslides hitting human infrastructures (once we excluded the ones triggered by human activities) this limitation should not greatly influence the results. Also, the yearly number of landslides is influenced by an improvement in the methodologies with which events after 1990 were collected, that results in a higher number of identified events. In the present analysis therefore no considerations about the evolution of the number of landslides or the most affected areas are carried out.
2.4 Methods
2.4.1 Temporal Clustering of Precipitation
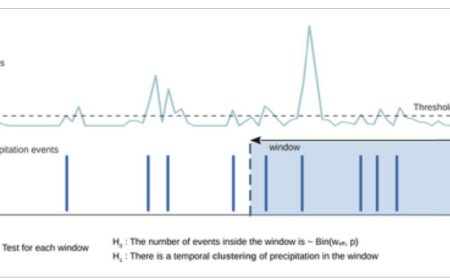
The identification of temporal clustering of precipitation follows the methodology proposed by Bevacqua et al. (2021), with the modifications of Banfi and De Michele (2022). The idea is to calculate the number of precipitation events within a specified time window and determine whether this count is the result of a Bernoulli process. If not, in this latter case, we infer the presence of temporal clustering of precipitation (Figure 1).
Visualization of the method used to identify the presence of a temporal clustering of precipitation in a given time window. The precipitation series is first transformed into an independent binary series, that is, event or non event. Then a statistical test is applied on the number of events inside the window.

To apply the method correctly, a series of distinct precipitation events above a given threshold is needed. This was obtained removing the high frequency clustering with a run decluster procedure (Coles, 2001). High frequency clustering can be seen as the dependence of precipitation exceedances inside a single meteorological event, while low frequency clustering (the one we are interested in) is related to multiple subsequent precipitation events. The procedure is as follows: (a) thresholding the precipitation series, (b) clustering together events closer than r days (here r = 2 days following Barton et al. (2016)), and (c) retaining only the first exceedance in each cluster and setting to NA all other ones. From the declustered series, the probability of exceedance p was computed, disregarding the days in which precipitation events were removed, that is counting the exceedances in the series and dividing it for the total length of the series minus the days with a NA. Here, we chose a threshold equal to the 0.7 quantile of daily precipitation, considering only wet days, following Bevacqua et al. (2021). This corresponds to values between 1.16 up to 10.54 mm, with an average of 3.5 mm.
To check for the presence of temporal clustering, we selected a time window w, and we counted the number of exceedances inside w, called n. In the absence of temporal clustering, events should be independently distributed inside the window. We performed therefore a statistical test with the null hypothesis that there is no clustering, that is, the number of events inside the window is distributed like a Binomial distribution, with parameters p and weff. Here, weff is an effective window equal to w minus the days in which precipitation was removed with high frequency declustering. The test is a one side test, where the hypothesis is rejected if n is higher than what expected from a Binomial distribution. In this work, we considered a 0.05 significant level.
We checked the presence of temporal clustering in each day of the time series considering three different time windows, centered on that day: 15, 30, and 90 days. The presence of temporal clustering was tested on each cell over the Italian territory on each day, therefore a multiple testing correction was needed to keep the overall significance at 0.05. In addition, the discreteness of the p-values needed to be considered as well. Regarding the latter, we computed mid-p-values as suggested by Heller and Gur (2011). Concerning the former, we disregarded the choice of using the classical methodologies proposed in literature. Most of them are designed for continuous variables and independent tests, like the well-known Benjamini–Hochberg (Benjamini & Hochberg, 1995), and they may lose power for an increasing number of tests, like the Bonferroni correction (Armstrong, 2014). Here, not only p-values were discrete and the number of tests was large, but tests were also spatially dependent. The spatial dependence of the tests implies that several contiguous p-values relatively high in the basin are a stronger evidence of the presence of temporal clustering than few sparse very low p-values, since the probability of finding significant p-values, which are spatially contiguous, only by chance, is in fact very low. A similar consideration was presented also by García (2004) in ecological studies. Moved by this, we proceeded by considering not significant all the p-values that were lower than 0.05, but that were not adjacent (including the diagonal cells) to at least three other cells with p-values lower than 0.05.
2.4.2 Correlation Between Temporal Clustering of Precipitation and Synoptic Conditions
A composite analysis was performed in order to understand the synoptic conditions more prone to temporal clustering of precipitation. For each year and season, we computed the average value of MOI and the number of days with temporal clustering of precipitation. Then, the maps of the average seasonal number of days with cluster were produced separating between seasons with above or below average MOI values. The same analysis was performed using NAO index.
In addition to looking at teleconnections, we investigated the WT associated with the highest probability of temporal clustering. Given a weather type, a cell and a season, we selected all the days with that specif WT in that specific season. Considering only the selected days, we computed the frequency of days with temporal clustering of precipitation. Then, we selected all days belonging to the same specific season, but without separating based on weather types. Considering only the newly selected days, we computed again the frequency of days with temporal clustering of precipitation. Finally, we obtained the maps of frequency anomalies for each weather type and season as the difference between the second and the first frequency. Negative (positive) anomalies therefore means a lower (higher) probability of temporal clustering of precipitation than the average during that specific weather type. The significance of the computed frequency anomalies was assessed reshuffling 1,000 times the series of WT and computing the 0.99 quantile of frequency anomaly for each cell. Only higher values were significant.
2.4.3 Association Between Landslides and Precipitation Types
To link precipitation clusters and landslide events, we started considering four possible precipitation conditions as drivers of landslides: (a) an intense precipitation event (above the 0.90 quantile) in the 2 days before the landslide, (b) a temporal clustering of precipitation in a window of 15 days, ending the day of the landslide or up to 2 days before, (c) same as before but over 30 days, (d) same as before but over 90 days. For each landslide, we checked the presence of one or more of these triggers. The two days tolerance was chosen following the results of Chien-Yuan et al. (2005) that found a time lag for rainstorm induced debris flow initiation within −13 hr (prior to the peak hourly rainfall) up to 45 hr (after the peak hourly rainfall).
To asses the statistical significance of the results we performed a resampling procedure over the date of occurrence of landslides. We randomized the dates of occurrence of landslides 1,000 times, fixing the season, and we performed the same analysis each time, re-assessing the presence of the identified triggers for each new data set. When we look at the precursor of an event, it is important to look not only at how many times this is observed before the event, but also at how many times it occurs without an event following it. If the occurrence of a trigger preceding the event is due to chance and not to a physical mechanism, then we should observe similar frequencies if we change the date of occurrence of that event.
In order to understand the relative role of the temporal dynamic of precipitation and the precipitation total, we computed the total precipitation over 15, 30 and 90 days preceding each landslide. Then, for each landslide, we computed the total precipitation over the same windows starting the same day and month of the event but for all the other years. In this way we were able to compute the ranking for each sum preceding each event. We then computed how many times it was higher then the 0.9 quantile.
The occurrence of some landslide types may be influenced by temperature as well as precipitation. This is true for rock falls, that may be favored by a stability reduction of rocks due to freeze-thaw cycle. This reduction is related to thermal expansion and contraction as well as frost wedging from moisture inside rock fractures (Strunden et al., 2015). In order to check for this, we computed the distribution of daily maximum and minimum temperature during the days of occurrence of a certain category of landslide events. Then, we selected all the dates with the same day and month of the ones when events occurred but with different years. The maximum and minimum temperature associated with these dates were collected and the distributions compared with the previous ones. To identify freeze-thaw cycle we checked whether in the month previous to the rock fall we had maximum and minimum daily temperature with opposite sign. The frequency of freeze-thaw cycle before rock fall was compared with the one before the dates with the same day and month but with different years.
3 Results
3.1 Spatio-Temporal Distribution of Temporal Clustering of Precipitation
Figure 2 shows the spatial distribution of the seasonal number of days with temporal clustering of precipitation over a 30 days window and the seasonal precipitation amount over Italy. The area more prone to temporal clustering of precipitation is the Alpine area, mainly the eastern part, during the summer months. Temporal clustering is important also in the western coast and south of Italy during the winter months. During Autumn and Spring, the spatial distribution is more even over the territory. Compared with the total precipitation, we observe similar patterns but also some differences. For example, the western part of Piedmont, that is characterized by the highest values of total precipitation from Spring to Autumn, does not emerge when we look at the maps of temporal clustering. Also during winter, the spatial distribution has some differences, with a high number of days with temporal clustering in Sardinia and Sicily, that is not matched in the total precipitation maps. During summer, the meteorological conditions are on average more stable than in autumn and spring due to the persistence of the Azores High pressure over Italy, thus resulting in less precipitation, mainly related to convective events.
Spatial distribution of total precipitation, temporal clustering of precipitation over Italy, and their correlation. Note that the color scale is not linear in the upper part. Panel (a) Average number of days with temporal clustering over a 30 days window for each season from ERA5-Land. Panel (b) Average total precipitation in each season from ERA5-Land. Panel (c) Kendall's tau between the variables in panels (a and b). Panel (d) Average number of days with temporal clustering over a 30 days window for each season from E-OBS data set.

The comparison of ERA5-Land with E-OBS data set (Figure 2) shows a lower frequency of temporal clustering in the latter, in all seasons except from autumn. ERA5 data set, from which ERA5-Land is derived, is known to overestimates mean precipitation systematically in most of the domain and periods of the year, due to overestimation of wet days, with a stronger discrepancy in high mountain catchments in the convective summer period (Bandhauer et al., 2022). They also observed an underestimation of precipitation peaks in ERA5 in October and November in the Tagliamento catchment (north of Italy). These results may explain part of the difference observed in this study between the two data sets. Qualitatively, however, ERA5 reproduces the precipitation patterns well (Bandhauer et al., 2022). The performances of E-OBS are, on the other hands, much more dependent on the area considered, due to the varying spatial densities of point stations, with worse performances in areas with few meteorological stations, like the Alpine ones. Turco et al. (2013) compared E-OBS with other gridded data set over the Great Alpine Region and a subregion in northwest Italy (NWI). They concluded that E-OBS does not reproduce reliably the climatology over NWI and that the use of E-OBS in these regions should be done with caution. This brought us to prefer the use of ERA5-Land in the study analysis.
The composites of seasons with above and below average MOI show a marked difference in winter in South-Central Italy, thus suggesting a connection between MOI and temporal clustering of precipitation (Figure 3). A similar pattern was observed also using the NAO index (Figure 3). The two indexes are correlated due to the common influence of the Northeast Atlantic low systems forcing Mediterranean cyclogenesis. The MOI can be seen as a sea level pressure anomalies oscillation in the Western-Central Mediterranean. It correlates with different climatic variables, like evaporation, precipitation, and heat flux. Its negative phase is associated with a dipole of low see level pressure anomalies between Central Europe and Turkey, resulting in the movement of continental cold and dry air masses to the Mediterranean, with an increase in evaporation. During its positive phase, the dipole is located between North Africa and Central Europe, with a movement of warm and moist air masses to Central and Western Mediterranean and a decrease in evaporation (Criado-Aldeanueva & Soto-Navarro, 2020).
Influence of teleconnections on temporal clustering of precipitation: Panel (a) Composites of the average number of days with temporal clustering of precipitation for above and below average Mediterranean Oscillation Index in each season. Panel (b) same as (a) but for North Atlantic Oscillation.

The association between precipitation and global scale oscillation indices in Italy was observed by other authors (Brunetti et al., 2002; Caloiero et al., 2011). For example, Caloiero et al. (2011) found a strong correlation between teleconnection patterns and precipitation in Southern Italy, that was particularly evident on the west side and in winter. From this work emerged that similar conclusions can be drawn also regarding the temporal compoundness in addition to the seasonal amount.
Moving to the synoptic conditions, we can observe that the frequency of temporal clustering associated with the different WTs is variable depending on the region and season (Figure 4). WT8 is in general the weather type associated with the highest frequency of temporal clustering of precipitation, in all seasons. This WT is characterized by a cyclonic circulation over west Europe and a ridge over the eastern Mediterranean and it causes abundant precipitation over Northern Italy. Already Messeri et al. (2016b) found that this synoptic condition is the one associated with the highest landslide and flood risk in Italy. Also WT4 is a cyclonic circulation over northern Italy, despite being associated with stable conditions over central and southern Italy due to the persistence of a subtropical high pressure. In fact, we can observe two different anomaly signs moving from south to north of Italy for this WT. An important weather type for temporal clustering of precipitation in South of Italy, mainly in winter, is WT3. This WT is characterized by a cyclonic circulation over Iceland and an anticyclonic one over northern central Europe. WT2 is instead characterized by a partial displacement of the Azores High Pressure to the Northern Atlantic Ocean that lets the maritime polar air masses to reach Central Europe and to some extent the Mediterranean area. This WT is associated with higher frequencies of temporal clustering of precipitation over central Italy and lower over northern Italy. WT5 and WT7 are both associated with anticyclonic conditions and this explains the low occurrence of temporal clustering of precipitation observed during them.
Anomaly in the frequency of days with temporal clustering of precipitation for different weather types and seasons. Weather type six is not reported due to very low number of days with this circulation type. Only significant values are reported.

3.2 Precipitation Events Triggering Landslides
The spatial distribution of landslide events is reported in Figure 5 for each season and type of movement. Among the different classes of landslides, fall events show less evident seasonal or spatial patterns. On the contrary, flow, sliding and debris flow during summer occurred mostly in the alpine areas while during winter they were more frequent in central or southern Italy, mimicking therefore the precipitation pattern (Figure 2).
Distribution of landslides over Italy, for different movement types and seasons. The colors of the cross identify the triggering precipitation type: an event in the preceding 5 days above the 0.9 quantile, a temporal clustering over 15, 30, or 90 days preceding the landslide or none of the previous ones.

Temporal clustering of precipitation was a significant triggers for all the landslide types with percentage, excluding rock falls, of around 50% (Figures 6 and 7). The results about the characteristics of precipitation events preceding each landslide type give us also the possibility to distinguish different generating mechanisms (Figure 6). For debris flows, the temporal clustering over small windows explains a good amount of events (39% over a 15 days window). This is in line with the work of Bevacqua et al. (2021) that observed temporal clustering of rainfall over small windows before shallow movements. A high influence of temporal clustering of precipitation over large windows was found for complex and sliding events (30%–39% over a 90 days window, respectively). However, it is interesting to point out that for complex movements the presence of temporal clustering over small windows was very low compared with the others. In contrast to the other types, fall events are not predominantly associated with none of the two triggers. Looking at precipitation totals, we can observe similar patterns between them and temporal clustering for debris flow and flow. However they are fairly different for complex events. In fact we observed high precipitation totals for short duration but a very low presence of temporal clustering of precipitation, suggesting that the obtained totals are due to few intense events. A similar behavior can be observed also for slidings.
Association between precipitation events and landslide types. Panel (a) Frequency of different triggering precipitation types generating landslides: a precipitation event in the preceding 5 days above the 0.9 quantile without temporal clustering of precipitation, a temporal clustering of precipitation over 15, 30, or 90 days preceding the landslide or none of the previous ones. The colors represent the values of the observed frequency and correspond to the numbers in the cells. Panel (b) Frequency of temporal clustering of precipitation over 15, 30, or 90 days preceding the landslide. The colors represent the values of the observed frequency and correspond to the numbers in the cells. Note that the three conditions can occur simultaneously, thus the frequencies do not sum to the ones in panel (a). Panel (c) Frequency of precipitation totals over 15, 30, or 90 days preceding the landslide above the 90th quantile.
Boxplots of the frequency of different triggering precipitation types generating the landslides, obtained after the reshuffling of the date of occurrence of landslides 1,000 times. In addition the frequency in the original data is reported (x).


From both Figures 5 and 6 it is evident that rock falls are much less linked with precipitation events, either isolated and intense, or clustered, than the other types. In South Central Italy, in summer, they are almost the only typology observed. Different authors identified an association between the temporal distribution of rock falls and freeze–thaw cycles (Bajni et al., 2021; Nissen et al., 2022; Pratt et al., 2019), that may therefore explain winter events. The presence of a high number of events in summer, not related to precipitation, suggests that also high temperatures may play a role, for example, causing deformation of the materials, thus favoring rock fall processes in summer. In Figure 8a we report the distribution of maximum temperature (a) during summer days with rock fall not associated with precipitation and (b) during the same calendar days but for the other years. This to compare meteorological conditions driving or not rock fall. What appears is that rock fall occurrence is associated with higher maximum daily temperature with respect to normal days. The same can be observed for winter rock falls and minimum temperature (Figure 8b), with a left shift of the distribution in case of rock fall occurrence. In addition, we looked for the presence of freeze–thaw cycles in the 2 weeks preceding a rock fall in winter, or preceding the same calendar days but for the other years (Figure 8c). A clear difference in the frequency is visible, with the presence of one or more freeze–thaw in almost 80% of the weeks before a rock fall.
Rock fall and temperature relationship. Panel (a) the distribution of maximum temperature during summer days with rock fall not associated with precipitation and during the same calendar days but for the other years. Panel (b) same as panel (a) but for winter events and minimum temperature. Panel (c) frequency of having at least one freeze–thaw cycle in the 2 weeks preceding a rock fall in winter, or preceding the same calendar days but for the other years.

The occurrence of landslides is often a non isolated phenomenon, since a precipitation event may trigger movements in multiple locations. Here, we clustered together landslides close in time and space and we considered only one event for each cluster to investigate the drivers, to avoid biases due to the dependence between events (Figure 9). However, the information on cluster size was also explored in relation with temporal clustering of precipitation. The largest events occurred in the Campania region and in the Alpine area and they were driven by a temporal clustering of precipitation.
Landslides clusters. Panel (a) Distribution of clusters of landslides events. Panel (b) Distribution of clusters of landslides events with size greater than 2 (the marker size corresponds to the legend in panel (a)), divided between clusters preceded or not by a temporal clustering of precipitation.

4 Discussion and Conclusions
Understanding the meteorological variables that have a role in shaping the occurrence of landslides is important to improve their prediction and risk evaluation. Here, we first investigate the occurrence of temporal clustering of precipitation over Italy. The occurrence of multiple precipitation events has proven to be important in the occurrence of some natural hazards like lake floods (Banfi & De Michele, 2022; Barton et al., 2016) or landslides (Bevacqua et al., 2021). Indeed, investigating the conditions more prone to the clustering of precipitation allows, in turn, to understand the conditions more prone to that natural hazards driven by multiple precipitation events. From the study, it emerges that below average values of the MOI teleconnection index, an index developed for the Mediterranean area, increases the likelihood of having clustered events. This likelihood was also related to some circulation patterns. The presence of a cyclonic circulation over west Europe with a ridge over the eastern Mediterranean resulted in the highest frequency of days with temporal clustering. In south central Italy, in winter, one of the most severe circulation pattern is characterized by a cyclonic circulation over Iceland and an anticyclonic one over northern central Europe.
The association between temporal clustering of precipitation and a specific hazard, namely landslides, was then investigated over Italy. We observed that for all types of landslides, except rock falls, the majority of the events are preceded by a temporal clustering of precipitation. For complex events and slidings, this occurs mainly over longer time windows. For debris flows over short ones. The presence of a weaker connections between precipitation and rock falls implies that other important triggers play a role in their occurrence. We found this to be low minimum temperature and freeze-thaw cycles for winter events and high maximum temperature for summer events. This may bring to the consideration that the saturation process is less important for rock fall type, that is probably more influenced by rock deformation and fractures.
Despite to a less extent, we also found other landslide types that were not preceded by either a temporal clustering of precipitation or an intense event. A potential additional trigger, not included in the analysis, is snowmelt, that is known to have triggered landslide events in Central Italy (Guzzetti et al., 2003). Some uncertainties may also derive from the data set processing. Here, we disregarded all events in the AVI data set associated with a trigger either than meteorological, but we also included all the events with unknown trigger. This assuming that if it was not specified it was likely related with precipitation. However, some non rainfall-triggered events may have remained in the subset used. From the agnostic point of view we have preferred to keep the information of the landslides with unknown trigger. This assumption will result in an underestimation of the effects of rainfall on landslides, rather than an overestimation that would be much more critical, in fact it will increase the percentage of landslides falling in the “Not identified” category and it will decrease the number of landslides falling in the “Intense event” or “Temporal clustering” category.
Another limitation of the data set is the daily temporal resolution. Some shallow landslides, like debris flows, well correlate with peak hourly rainfall (Chien-Yuan et al., 2005), while in our study we considered daily sum, since the exact time of the day in which landslide events occurred is not known. In this way, we may underestimate the return period of the precipitation events preceding it. For landslides related with sustained precipitation, like complex events, a sub-daily temporal resolution is instead less important. An approximation was introduced also regarding the lag for rainstorm induced landslides initiation, since we extended the value found for debris flow to all types of landslide.
The use of more updated data sets or inventories of other countries could confirm and extend the results obtained in this study. The difficulty of using landslides data sets is the lack of an homogeneous structure and the presence of different variables and descriptors in each of them. As an example there is not, to the authors' knowledge, an European data set of landslides. In addition, the data set used reports only landslides that attracted public attention, other data sets with a less biased sample may also be considered. Also improving the spatial resolution of the precipitation data set could provide an improvement of the analysis, like the VHR-REA_IT data set recently developed by CMCC (in Italian Centro Euro-Mediterraneo sui Cambiamenti Climatici, Euro-Mediterranean Center for Climate Change) over Italy, with a 2.2 km spatial resolution and hourly temporal resolution (Raffa et al., 2021).
Other assumptions of the study are the circular radius used to group single landslides into events, and the minimum number of days used to group days with precipitation into a single event. Regarding the latter a proper study should be carried out to evaluate the optimum parameter over Italy since this assumption could change the resulting presence of clustering. Regarding the former, the subdivision between multiple landslide events and single ones is getting consensus in a growing number of works. However precipitation events are not circular neither of the same shape, as we assumed. Let's think about stratiform or convective events. An interesting study could identify precipitation events over Italy as 3D objects as already done for drought in Europe by Cammalleri et al. (2023) or for tropical cyclone precipitation by Skok et al. (2013). This would allow a precise and interesting association between impacts and driver.
In this study, we related temporal clustering of precipitation with the occurrence of landslides. In the presence of more information about landslides characteristics, a useful follow up could add a further step, linking temporal clustering of precipitation to the severity for example, volume and area of the slides, or to the number of landslides triggered together. In addition, the analysis could be extended to future scenarios, in order to asses if we must expect an increase in the frequency of temporal clustering of precipitation, maybe due to an increase in the frequency of the identified circulation patterns, and therefore an increase in the probability of occurrence of some landslide types. These results can help us to better understand the risk of landslides associated with temporal compounding of precipitation but could also be of interest for other types of hazards that require a saturation process.
Acknowledgments
This study was carried out within the RETURN (multi-risk science for resilient communities under a changing climate) Extended Partnership and received funding from the European Union Next-GenerationEU (National Recovery and Resilience Plan—NRRP, Mission 4, Component 2, Investment 1.3—D.D. 1243 2/8/2022, PE0000005).
What is Your Reaction?
 Like
0
Like
0
 Dislike
0
Dislike
0
 Love
0
Love
0
 Funny
0
Funny
0
 Angry
0
Angry
0
 Sad
0
Sad
0
 Wow
0
Wow
0