The current status of the sustainable development goals in the world
Sustainable development goals incorporate multiple dimensions to measure the progress made by the world in consolidating their development. The main objective of this study is to explore the structures of variation and covariation between the SDGs indicators interpreting and describing their current status by countries and regions of the world. This study assessed 40 SDG indicators reported by 125 countries in the 2021 Sustainable Development Report, using the HJ-Biplot multivariate technique, through which it is possible to analyze the relationships between indicators and countries. The results indicate that the global North countries currently display solid sustainability characteristics that favor economic growth, though more work is required to protect the environment and promote responsible production and consumption. On the other hand, the countries of the global South with less purchasing power must still work on policies and strategies to promote the health and well-being of their populations, enable access to essential household services and promote equality.
1. Introduction
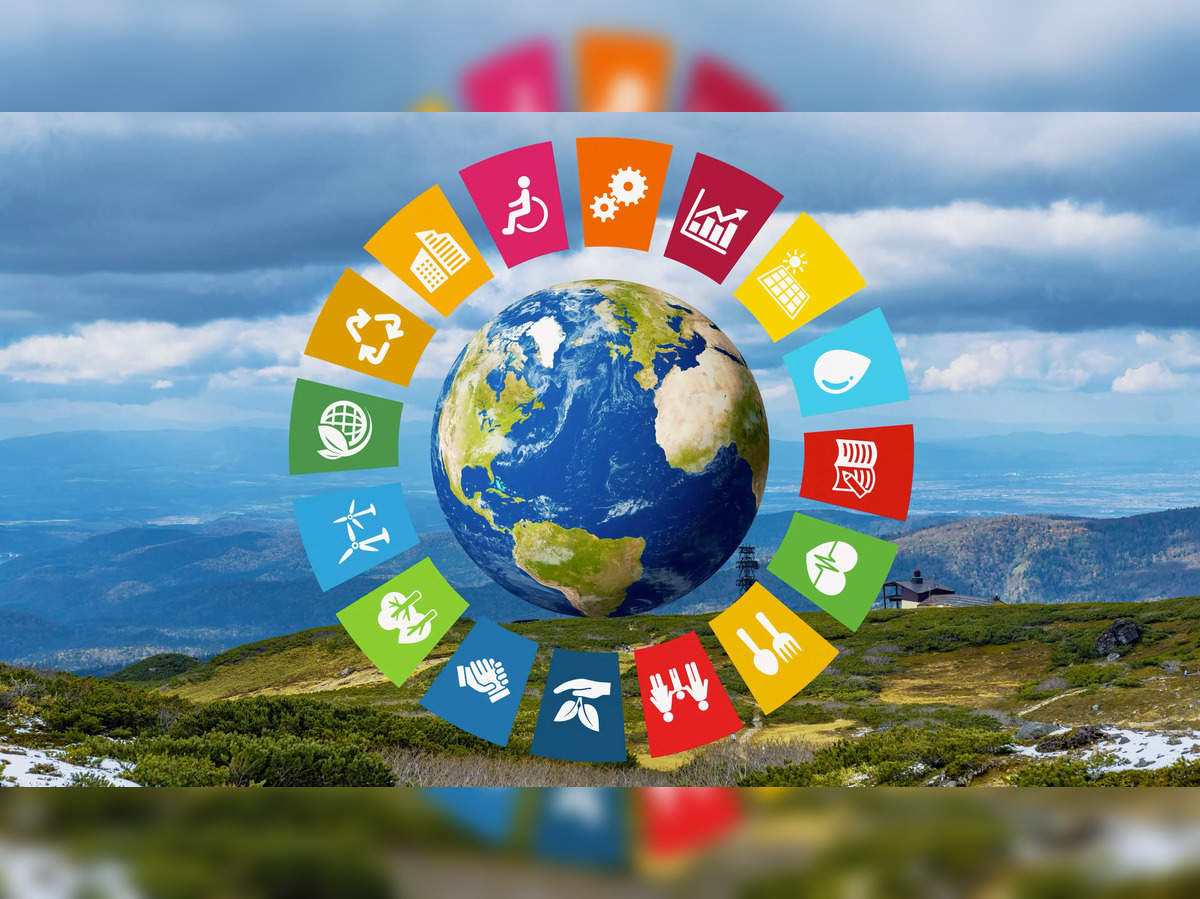
The 17 sustainable development goals established in 2015 incorporate several dimensions, which represent a political commitment to achieving by 2030 economic and human progress in the world’s countries through viable actions that will endure over time. As Rickels et al. (Citation2016) indicated, the SDGs have been integrated into international and national policies, looking for coordination, monitoring, and assessment of sustainable development policies. Additionally, the SDGs may provide helpful assistance for the inclusion advocates, a common language, and a framework to bolster international collaboration, and space for contestation (Siegel and Bastos-Lima Citation2020).
The SDGs are global and represent an indivisible set of international priorities. However, at the same time, they can be adjusted to the different national realities, cultures, demographic dynamics, and ways of life of the various societies in the world, respecting the targets set by each country to advance in the framework of the 2030 Agenda. Thus, each SDG is an umbrella term that can be multi-faceted and contain numerous policy goals (Kroll, Warchold, and Pradhan Citation2019). The aim is to perform annual monitoring of the progress made towards the various aspects that are measured, and in the 15 years since the establishment of the SDGs, substantial progress has been observed in industrialized countries (Lange et al. Citation2019).
This more significant progress has resulted of their high purchasing power and the effectiveness of their governmental policies to assess, monitor, and control SDG performance on its various fronts. Instead, in developing countries, the assessment of the progress made in the 2030 Agenda is less encouraging, and corruption looms large as one of the main risks for achieving the goals related to economic growth and the reduction of poverty because of the diversion of resources further accentuates inequality (Lalama-Franco and Bravo-Lalama Citation2019).
Regarding the countries’ current progress in achieving the SDGs, it is also necessary to consider that the global COVID-19 pandemic in 2020 and 2021 has forced many countries to reset their priorities and reallocate investments to care for their populations’ health. The full impact the pandemic will have on achieving the goals of the 2030 Agenda is not yet known, but the COVID-19 pandemic has emerged as a poverty-related neglected disease on at least two fronts. First, is its significant impact on low-income regions and rural areas. Second, its affects poor South America, Asia, and African urban areas. On both fronts, the pandemic contributes heavily to the loss of public health gains that we achieved globally during the last two decades (Mejia, Hotez, and Bottazzi Citation2020).
Despite preliminary studies, reports, and the data presented to date (Cardoso et al. Citation2022; Özsoy and Gürler Citation2022; Yildirim Citation2022), the United Nations has not yet estimated or officially reported the impact that COVID-19 will have on achieving the SDGs, and efforts by all the governments of all countries in the world will be required to assess it. The 2021 Sustainability report indicates that the COVID-19 pandemic is a setback for sustainable development everywhere. For the first time since the adoption of the SDGs in 2015, the global average SDG Index score for 2020 has decreased from the previous year. Nevertheless, the decline in SDG performance globally is likely underestimated in this year’s report, with many indicators for 2020 not yet available due to time lags in international statistics (Sachs et al. Citation2021).
Given all the above, this study assesses 40 SDG indicators reported in 2021 by 125 countries, intending to determine, based on the existing interdependencies between the goals of the 2030 Agenda, the opportunities the countries have to achieve them. For this reason, this study is exploratory, descriptive, and correlational because it seeks to determine how the indicators are related to each other from a comparative perspective between countries, and without setting predefined hypotheses on the causes for their covariations nor their possible effects on a given group of countries.
From a practical point of view, the analyzes are carried out using the HJ-Biplot technique, seeking to contribute to the existing literature on the interrelationships between the SDGs with data analysis. It seeks not to emphasize the significance of the bivariate correlation between the different aspects examined but to analyze the variations and covariations between the indicators, interpreting the results by countries, regions, and their economic level.
2. Literature review
2.1. The SDGs as a framework to promote the progress of nations
In 2015 the UN member states agreed to a universal call to adopt seventeen integrated goals, commonly known as sustainable development goals (SDGs), to end poverty protect the planet, and upgrade the living standard of the member countries by 2030 (UNSDS Citation2015). This action has sought to conceive of sustainable development as a way to promote the progress of nations by meeting the needs of the present without compromising the ability of future generations to meet their own needs.
The 2030 Agenda is organized around ‘the 5 P’s of development’, people, planet, prosperity, peace, and partnerships, which, as specified by Santika et al. (Citation2019), are essential for humanity and represent a call to take action in the eradication of hunger, seek the protection of the planet and ensure that all people live in peace and prosperity. The 17 SDGs consist of 169 specific targets that can be clustered into three main pillars of sustainability, including economic (SDGs 1–3 and SDGs 8–9), social (SDGs 4–5, SDGs 10–11, and SDGs 16–17), and environmental (SDGs 6–7 and SDGs 12–15) pillars (Kostoska and Kocarev Citation2019).
This multidimensional approach to sustainable development creates the possibility of understanding it broadly and comprehensively because it integrates aspects historically considered alien to development -for example, the recognition of women’s unpaid work and reproductive rights -alternatively, the need to curb unsustainable patterns of production, consumption, and management of resources. As indicated by Telleria and Garcia-Arias (Citation2022), the SDGs propose a set of multidimensional and multi-actor development goals that aim to build a new development model that ‘leaves no one behind’. Additionally, from a political and international cooperation point of view, the SDGs offer an extensive framework for coordinating and shaping government policies and engaging people with sustainability (Bain et al. Citation2019).
All the SDGs are presented as equally important, and these do not prioritize any particular objective. However, the wide range of aspects addressed, and the integrated nature of the different SDGs presents a challenge to implementing the 2030 Agenda (Di Lucia, Slade, and Khan Citation2022). To the point that some authors have criticized its viability and fulfillment. For example, Hepp, Somerville, and Borisch (Citation2019) argue that without some form of prioritization, it is clear that the global agenda of 17 goals, 169 targets, and 230 individual indicators, is unattainable in the stipulated timeframe.
Also, Naidoo and Fisher (Citation2020) indicate that there is unlikely to be enough money or attention to banish poverty and inequality, expand health care, and reverse biodiversity loss and climate change, all by 2030. This scenario is relatively critical among the least developed countries, where the idea of combating poverty and inequality by promoting sustainable economies and policies differs from the realities of poverty and human rights fulfillment as we move into the last ten years of the SDGs (Glenn Citation2022).
Therefore, the global development agenda expresses the political and economic asymmetries between countries and social groups and the conventions, ideas, values, norms, and institutions that make up the international system (Sanahuja and Tezanos-Vázquez Citation2017). In particular, least developed countries may find it more challenging to achieve the SDGs due to their low level of socioeconomic development (Aust, Morais, and Pinto Citation2020). Oladele (Citation2022) adds that the SDGs must frame development ‘beyond aid’ and beyond an aid industry based on North–South transfers, through which economic cooperation between regions and countries with higher and lower incomes has historically been founded.
The SDGs play an essential role at the political level in mobilizing support for international cooperation and generating solidarity awareness of global citizenship. However, they do not adequately contemplate that these may prove unattainable by 2030 for many low-income or less developed countries, even less so if the adverse effects of COVID-19 on the economy and the well-being of populations continue.
2.2. The effect of COVID-19 on the 2030 Agenda
Since 2020, the COVID-19 scenario has shown how the compliance plans of the SDGs have been altered in the short and medium term (Sapaico-Del Castillo, Martínez-Puma, and Gonzales-Portugal Citation2021). The COVID-19 pandemic implications for the governments, industries, and business activities worldwide have seriously challenged the SDGs’ achievement (Ameli et al. Citation2022). Thus, the need to continue thinking about sustainable paths for the planet becomes a priority in generating spaces for cooperation to achieve the objectives.
Different authors argue regarding the effects of the COVID-19 pandemic in regions and continents (Trupp and Dolezal Citation2020; Dube and Nhamo Citation2021; Ekwebelem et al. Citation2021; Heffron et al. Citation2021; Siddikee et al. Citation2022), among the poorest populations in the world (Afriyie et al. Citation2020; López-Feldman et al. Citation2020; Gonzalez Citation2021); its effects on the slowdown in achievement in SDG compliance trends recorded by countries (Shulla et al. Citation2021; Elavarasan et al. Citation2022; Sten Citation2022); and its positive benefits to the environment in the short term (Wang and Su Citation2020; Wang et al. Citation2022).
For example, Flores and Rubin (Citation2022) affirm that, COVID-19 pandemic has exacerbated the inequities and inequalities suffered by marginalized and vulnerable communities worldwide. Gonzalez (Citation2021) add that people who live in poverty, most of whom are small farmers in Asia, Africa, and Latin America (the global South), currently do not earn sufficient income or possess enough land to purchase or grow the food they need. Siddikee et al. (Citation2022) argue that in Asia, where most countries are in the middle-income group, accelerating economic growth and reducing the unemployment rate is the biggest challenge for the nations and the SDG achievement.
COVID-19 is slowing or reversing global health and development gains. With the presence of so many different negative aspects due to COVID-19 pandemic, SDGs are expected to take much longer to achieve (Nundy et al. Citation2021). Therefore, to be successful and achieve global goals (including controlling pandemics), we must rely on solid leadership leading to impactful public policies and international collaborations (Mejia, Hotez, and Bottazzi Citation2020). The COVID-19 pandemic has emerged and forced out the ephemeral conventional developmental approaches.
Thus, the post-COVID world indicates the need to transform the sustainable development and strategies to achieve the 2030 Agenda ecosystem (Elavarasan et al., Citation2022). For this it is necessary to understand that the current situation could be an opportunity to learn from lessons taught, plan a more efficient agenda, and adapt to the changing times (Clemente-Suárez et al. Citation2022). It is urgent to learn from the past and avert or slow down the potential rebound effect of the pandemic (Wang, Wang, and Jiang Citation2021).
2.3. SDG studies through modeling techniques
Different authors (Bekele, Dadi, and Tesfaye Citation2019; Kroll, Warchold, and Pradhan Citation2019; Sinha, Sengupta, and Alvarado Citation2020; Weerakkody et al. Citation2021) study the interactions between the SDGs, the interlinkages between their different dimensions, and how these, in an integrated way, could favor or limit the fulfillment of the 2030 Agenda. As specified by Anderson et al. (Citation2021), to meet all goals and targets, the actions taken to progress toward one goal or target should not detract from the progress of others. Instead, these actions should be mutually reinforcing or at least neutral.
Recent studies analyze the SDGs from multivariate techniques (De la Hoz-Maestre, Montes-Escobar, and Salas-Macías Citation2021; Cling and Delecourt Citation2022; Zhang et al. Citation2022). These references contextualize the technical work carried out in this study and show how the techniques for data analysis and representation are helpful in sustainability and development research. Thus, for example, De la Hoz-Maestre, Montes-Escobar, and Salas-Macías (Citation2021) exemplifies the HJ-Biplot technique to analyze sustainability indicators in the Americas region; therefore, this work justifies the choice of HJ-Biplot as the multivariate technique used to obtain the results in this study.
For its part, the studies of Cling and Delecourt (Citation2022) and Zhang et al. (Citation2022), which are developed through the Multiple Factor Analysis technique, serve as a reference to exemplifying the usefulness of analyzing in a multivariate way the interrelationships between the different types of SDGs, and how these determine the progress and challenges of countries to achieve the 2030 Agenda.
3. Materials and methods
3.1. Data in analysis
This study explores the current values of the indicators included in , analyzing the performance of 125 countries of the world, grouped into four regions: Africa (35 countries), Americas (23), Asia-Oceania (33), and Europe (34). The HJ-Biplot multivariate technique is used to obtain the results and provide a multidimensional representation of the relationships between indicators and countries. For the effects of presenting the countries and indicating their similarities and differences, the ISO 3166-1 alpha3 coding scheme is used, abbreviating the countries’ names as 3-letter codes. The detail of the countries in analysis and their codification is included in the Appendix.
Table 1. SDG indicators in the analysis.
3.2. Method of reference: the HJ-Biplot technique
The Biplot methods were proposed by Gabriel (Citation1971) as a means to facilitate the representation of interdependencies between two or more variables in a Figure that summarizes the dispersion of the data in a combined and reduced manner, usually on a two-dimensional plane. Galindo-Villardón (Citation1986) proposed the HJ-Biplot as an alternative to simultaneously analyze the rows of a data matrix (in this case, countries) and the variables (SDG indicators) by displaying the measured characteristics as vectors and the behavior of the observations as points.
To interpret the associations displayed in a Biplot Figure, the vectors close to each other indicate a high positive correlation, while vectors running in opposite directions and at flat angles reflect high negative correlations. The proximity between points reflects common patterns or similarities between individuals, whereas points far from each other imply dissimilarities and very different scores in measured characteristics.
The Biplot methods, and especially the HJ-Biplot, have been used in recent research studies to assess the performance of the various dimensions of sustainability in cross-national studies (Tejedor-Flores, Vicente-Galindo, and Galindo-Villardón Citation2017; Amor-Esteban, Galindo-Villardón, and García-Sánchez Citation2018; Martínez-Regalado et al. Citation2021; Medina-Hernández, Fernández-Gómez, and Barrera-Mellado Citation2021). These have also been used in studies where the comparative perspective between regions suggests how the positive and negative correlations between SDG indicators help to identify particular global patterns (Pradhan et al. Citation2017, Citation2021).
4. Results
4.1. Descriptive results
To exemplify the current status of the SDGs in the world, displays a comparison between countries and their income levels for three indicators: universal health coverage index of service coverage (% G3.UHC), population with access to electricity (% G7.PAE), and mean an area that is protected in terrestrial sites important to biodiversity (% G15.PTB).
In , the first aspect that stands out is the lower variability observed as the countries’ income levels increase. Especially among African countries for all the graphed indicators, the variability between counties is high, which reflects the major challenges faced by the region in advancing toward the SDG goals due to the low-income level of most of its countries. Instead, in Europe, greater uniformity is observed between countries, although some of its middle-income countries face challenges in specific aspects to improve the life quality of their populations.
Regarding the universal access to healthcare indicator, the best performance is currently observed in high-income countries. In European countries and the countries of the Americas region, over 74% of the population has medical coverage. In the countries of Asia and Oceania, the average percentage of indicator G3.UHC is 69.2%, and this value is only 47.9% in Africa. A similar pattern is observed in terms of the percentage of the population with access to electricity, where coverage is high in most countries except in Africa, where further work must be done to make this essential service available to households, given that it is estimated that only 53% of the population has access to electricity. This percentage is 38% in low-income African countries.
Lastly, regarding the description of the patterns observed in , opportunities are observed throughout the world in terms of the percentage of mean area that is protected in terrestrial sites important to biodiversity, particularly in countries where the G15.PTB indicator is below 10%, as in the case of Moldova (MDA), Iraq (IRQ), China (CHN), Turkey (TUR), Mauritius (MUS) and Mali (MLI).
presents the matrix of bivariate correlations between the 40 studied SDG indicators. Positive associations are colored orange and negative ones are colored green, and the intensity of the color reflects the strength of the correlation, where the lightest shades indicate correlations that approach zero.
In the context of the development indicators analysis, the associations can be interpreted as aspects that jointly contribute to or mutually limit the attainment of sustainability, whereas inverse relationships represent offsets, i.e. aspects that should not have high values simultaneously. For example, a country should not destroy the environment for economic development.
displays high covariations between the SDG indicators. Of the 780 pairs of correlations that were calculated, 434 (55.6%) were positive. The highest correlation found was 0.946 between the mortality rate of children under the age of 5 and the neonatal mortality rate (G3.MRU5 and G3.NEOM), both of which are indicators of Goal 3, related to ensuring the health and well-being of the world’s population. The strongest inverse correlation found was −0.885 between G7.PAE and G1.PHR3 indicates that when a country’s poverty rate is high (percentage of people who live on less than $3.20/day), the percentage of the population without access to electricity is also high.
Regarding the indicators on conservation of the environment and economic growth, the correlations found in this study indicate that the countries with the highest purchasing power are the ones that most contribute to the degradation of the environment. For example, a high correlation of 0.671 is observed between the indicators G17.GSHE and G12.PNE implies that the higher the investment in education and healthcare as a percentage of GDP, the higher the production-based nitrogen emissions and, therefore, lower responsible production.
4.2. Results of the multivariate analysis
Below are the interpretations of the multiple associations found between the indicators, the countries, and both, using Biplot representations ( and ). presents the variation and covariation structure of the studied SDG indicators (variables) represented by vectors. The position of the countries (observations) is graphed as points in different colors depending on whether they belong to the global North or the global South. Initially, the names of the countries are not shown to focus on the interdependencies between the indicators. displays the positions of the 125 studied countries to draw conclusions on their relative proximity and relative positions compared to the distribution of the variables.
indicates that the variability explained by the first axis is 47% of everything that the data could explain, so it can be said that the first axis represents sustainable development, given that the vectors located towards the left (in quadrants II and III) are the SDG indicators on conditions that limit progress towards the 2030 Agenda.
On the other hand, most of the indicators located in the direction of axis 1 favor the countries’ economic and human growth. Quadrant II of the plane includes four conditions measured under Goal 3, closely associated with a target of Goal 2 and with Goal 1. This high covariance between the vectors G3.MATM, G3.MRU5, G3.NEOM, G3.AFR, G2.PSC5 and G1.PHR3 is associated with the countries of the global South with high poverty levels because maternal, neonatal, and under-5 death rates, stunted child growth, and adolescent pregnancy are highly related to each other in populations with a high percentage of people living on less than 3.2 USD per day.
Quadrant III of the plane in displays the targets that belong to the goals that characterize middle-income countries, in which challenges are still found for achieving sustainable development. It is in aspects such as inequalities in salaries and between people, differences in the quality of life between the country’s rich and poor (measured through the indicators G10.GINI and G10.PAL); death rate due to cardiovascular disease, cancer, diabetes, or chronic respiratory disease in adults aged 30–70 years (indicator G3.DCCD); high homicide rate (G16.HOM); and limitations in freedom of the press or expression (G16.PFI).
Quadrant IV of the plane displays a combination of medium and high-income countries from the global North and global South that have made efforts in advancing towards achieving the 2030 Agenda, which stand out, among other aspects, for their populations’ access to essential services such as electricity, gas, clean water, sewage, internet, and healthcare coverage (indicators G6.PWS, G6.PSS, G7.PAE, G7.CFC, G9.INT and, G3.UHC). These countries feature high percentages of people who complete their secondary education (G4.SEC), women have the opportunity to study in similar conditions as men (G5.FME); children receive the vaccines recommended by the World Health Organization (G3.I2VA), and infrastructure has been arranged so that the population is satisfied with public transportation (G11.TRA). An opportunity observed in this group of countries is to promote a healthy diet to control the prevalence of obesity (G2.OBES).
To conclude the description of the patterns observed in the plane of , in the developed countries of the global North, the people do not perceive high levels of corruption or misappropriation of public funds (G16.CPI). A substantial percentage of GDP is allocated to education and health (G17.GSHE), and the trade and transport-related infrastructure are highly quality (G9.LPI). However, urgent measures are required to mitigate the adverse effects of the production and importation of consumer goods and services that produce high emissions of nitrogen or CO2 (G12.PNE, G12.NEI, G13.CO2I). These countries also display a high indicator of fatal work-related accidents embodied in imports (G8.FWI).
Lastly, it is important to mention the vectors that are observed to contribute to axis 2 of the plane, which explains 10% of the variability of the information. G5.FML, G8.UNE, G15.REDL and G15.PTB display small angles compared to this axis and, consequently are the indicators that most contribute to this second multidimensional characteristic, which is associated with the search for gender equality in the labor market (G5.FML), the unemployment rate of the population (G8.UNE), the survival of endangered species (G15.REDL) and the protection of biodiversity (G15.PTB). All these characteristics promote equality between people and all living beings inhabiting the planet.
To complement the description made up to this point, the plane in includes the names of the countries, color-coded by continent. Their positions on the plane indicate the challenges they face in their search for sustainable development. For example, of the 140 studied countries, the greatest contrast can be seen between Chad and United Arab Emirates (TCD and ARE), which are on the opposite ends of axis 1. This difference results from the behavior of several SDG indicators: Whereas in Chad currently, 67.9% of the population lives on less than 3.2 USD per day, this percentage in the United Arab Emirates is only 0.28%. Chad reports 1,140 maternal deaths per 100,000 live births, whereas, in the United Arab Emirates, this indicator is about three women.
The difference between both countries in terms of the percentage of female members of parliament is 15% compared to 50%. In terms of the availability of potable water services for households, the percentages are 38.7% versus 98.04%, respectively. Regarding accessibility to internet service, the contrast is 5.6% vs. 99.15%, among other aspects that contribute to the considerable difference between both countries.
shows that most African countries are in quadrant II of the plane. The countries from Asia, Oceania, Latin America, and the Caribbean are observed covarying in the opposite direction of axis 2, near the axis. The European countries are seen in quadrants IV and I of the plane, in the direction of axes 1 and 2 (from left to right and from bottom to top), depending on their purchasing power and development level, where eastern European countries are located in quadrant IV, and the countries with high SDG performance are located in quadrant I (in the top right of the plane), including Norway (NOR), Netherlands (NLD), Switzerland (CHE) and Denmark (DNK).
5. Discussion
Huan, Li, and Liang (Citation2019) reported that since 2015 there had been a substantial increase in methods and indices for measuring sustainable development. Many scholars and research institutions have been adopting a series of sustainable development indicators and composite indices in different countries and regions to track the development progress. The SDGs offer an interdisciplinary approach to measuring progress and development in the world’s countries, even though, as mentioned by Van-Zanten and Van-Tulder (Citation2020), the SDG agenda is not without flaws.
Even before the pandemic, progress towards achieving the SDGs has been too slow. COVID-19 presents a stress test for the current SDG approach. It requires rethinking the possibility of achieving the proposed goals by 2030, given the major disparities between countries with high purchasing power and those with less stable economies, particularly considering that the sustainable development approach forces world leaders to make a balance between economic, social, and environmental elements when achieving economic development (Yildirim Citation2022).
This study’s results confirm that the countries of the global North currently display solid characteristics of sustainability that favor economic growth, the end of poverty, and the reduction of inequality. However, they face challenges related to protecting the environment, the conservation of biodiversity, and responsible production and consumption. The emerging countries from Latin America and the Caribbean, Southern Africa, Northern Africa, the Middle East, and East Asia, although located in very different regions, currently display similar sustainability indicators. These regions have similar conditions for long-term sustainable economic growth, including the social aspects and quality of life (Rajnoha, Lesníková, and Vahančík Citation2021), which reflect medium and high levels of progress in achieving specific targets of the 2030 Agenda.
In contrast, the poorest countries, mainly in South Asia and Sub-Saharan Africa (Dentinho, Kourtit, and Nijkamp Citation2021), must continue to work on policies and strategies that promote the health and well-being of their populations. It enables access to essential household services (clean water, electricity, sanitation, and internet, among others), reducing hunger and unemployment, promoting peace, and developing partnerships to achieve the goals. For this reason, developing countries should evaluate strategies to monitor the impact of the COVID-19 pandemic on the SDGs and promote international cooperation to achieve sustainable development.
Aust, Morais, and Pinto (Citation2020) argue that one of the strategies that less developed countries should implement is to increase foreign direct investment because it leads to an increase in the SDG scores, which indicates that foreign investors play a fundamental role in the achievement of SDG in developing countries. Regarding aspects that depend less on economic factors, this study’s findings are consistent with the views of Siegel and Bastos-Lima (Citation2020). These authors argue that despite the SDGs’ emphasis on inclusion and the broad participatory process that led to their formulation, there are no specific mechanisms to ensure inclusiveness in the domestic-level processes on which actual impact ultimately depends.
In this sense, as in the case of the need to protect biodiversity and rein in the climate change that is affecting the planet, all countries in the world must continue to promote equality between people and promote their well-being. This is vital for development, and even more so considering the contraction produced by the coronavirus pandemic in the different dimensions of the beliefs and values related to the concept of sustainable development among the states and civil society, including the business sector (Cardoso et al. Citation2022).
For all the above, we can summarize that compared to other studies in which data is analyzed to interpret the existing associations between SDG indicators, the novelty of this research lies in the fact that through the results of the HJ-Biplot analysis, it was represented and described at the same time: (i) the aspects that differentiate the countries of the global north and south in the search for sustainable development; (ii) the SDGs’ current particularities between low-income countries and those with high purchasing power; and (iii) specific needs in specific nations.
6. Conclusion
This study demonstrates the usefulness of multivariate techniques, particularly the Biplot methods, to represent and describe the existing relationships between the SDGs expressed as positive and negative covariations. Cling and Delecourt (Citation2022) specified that the United Nations considered these interlinkages, and the integrated nature of the SDGs would be a prerequisite for achieving these goals. Then, the interlinkages between the SDG can contribute to or limit the countries’ progress towards achieving the 2030 Agenda.
Consistent with the results of Kostetckaia and Hametner (Citation2022), trade-offs (negative or inverse associations) between goals may prevent countries from achieving all 17 SDGs simultaneously, but their synergies (direct correlations) represent an opportunity for progress. Therefore, to achieve the SDGs, it is crucial not only to exploit the synergies between the objectives but also to overcome trade-offs, and the results of this analysis showed trade-offs differentiated by region and income level of the countries.
One limitation of this analysis is that We did not compare the SDGs’ situation before COVID-19 and after it. Therefore, it is necessary to propose future lines of research to study from a multidimensional perspective the consequences of COVID-19. Because although the pandemic has perceived the precarious conditions in which many people live and work, and it has profoundly affected and changed the global and regional SDGs, it has also positively affected other dimensions, such as the environment (Wang and Huang Citation2021).
Therefore, inferential evaluations are necessary for future research to analyze the SDGs associations between different indicators and goals, estimating the impact of COVID-19 on the slowdown in compliance with the 2030 agenda. This considering that empirical data and descriptive models estimated based on past relationships will not be sufficient to evaluate sustainable development. Additionally, these investigations require evaluations of how policies might contribute to transforming large sociotechnical systems (food, energy, mobility, and housing, among others) (Mickwitz et al. Citation2021).
What is Your Reaction?
 Like
0
 Dislike
0
 Love
1
 Funny
0
 Angry
0
 Sad
0
Sad
0
 Wow
0
Wow
0


