


Dude, not the rice!
This study assesses climate change's impact on Kharif-season rice in Uttar Pradesh, India's largest agrarian state. Using crop-climate scenarios and a Crop Simulation Model, it predicts increased rainfed rice yield in western regions but decreased yields overall due to rising temperatures and shorter growing periods by the 2090s.
Uttar Pradesh is the most populated state in India, with most of the population working in the agriculture sector and having a low income. The state's vulnerability to climate change is high due to inadequate infrastructure and heavy dependence on agriculture. Rice is a crucial crop for the state, but this study shows that climate change will decrease rice yields in the future, especially for irrigated rice, due to higher temperatures and shorter growing seasons. While rainfed rice yields may increase in some regions due to increased rainfall, rice production is expected to decline overall. Following current population growth trends, especially in a country as heavily populated as India, this could lead to dangerous food shortages.
Abstract
Uttar Pradesh, with a population of 237 million, is the largest agrarian state in India, located in the Indo-Gangetic plains. Rice cultivation is widespread across all districts of Uttar Pradesh, which have varying climate regimes, irrigation infrastructures, crop management practices, and farm sizes. The state is characterized by different agroecological zones (AEZs) with semi-arid to sub-humid climates with significant variability in monsoon rainfall. In this study, the impact of climate change on Kharif-season rice is estimated using crop-climate scenarios in Uttar Pradesh. A process-based Crop Simulation Model, Crop Estimation through Resource and Environment Synthesis-Rice, was simulated with bias-corrected and downscaled climate data for historical (1995–2014) and three future periods (the 2030s, 2050s, and 2090s) for two mitigation pathways (SSP2-4.5 and SSP5-8.5) from the Coupled Model Intercomparison Project 6. Phenology, irrigation amount, crop evapotranspiration, yield, and water use efficiency were evaluated and assessed for all AEZs. Based on the ensemble of 16 climate models, rainfed rice yield increased in the AEZs of western Uttar Pradesh due to increased rainfall, while in eastern Uttar Pradesh yield decreased, under both shared socioeconomic pathways (SSPs). Irrigated rice yield decreased in all AEZs under both SSPs due to an increase in temperature and a decrease in the length of the growing period, with reductions of up to 20% by the 2090s. Irrigation requirements decreased from the 2030s to the 2090s due to increased rainfall and decreased crop evapotranspiration. Despite the projected increase in rainfed yield, the overall rice yield is expected to decrease in the future under both SSPs.
Key Points
-
Rice yield (combining irrigated and rainfed) in Uttar Pradesh, India, is projected to decrease in the future for SSP2-4.5 and SSP5-8.5
-
With a projected increase in rainfall, rainfed rice yield increases in rainfall deficit zones, and irrigation decreases under both shared socioeconomic pathways
-
Planting in the early season could reduce the amount of yield loss for irrigated rice
Plain Language Summary
Uttar Pradesh is the most populated state in India, with most of the population working in the agriculture sector and having a low income. The state's vulnerability to climate change is high due to inadequate infrastructure and heavy dependence on agriculture. Rice is a crucial crop for the state, but this study shows that climate change will decrease rice yields in the future, especially for irrigated rice, due to higher temperatures and shorter growing seasons. While rainfed rice yields may increase in some regions due to increased rainfall, rice production is expected to decline overall.
1 Introduction
India is the second-largest rice-growing country and has the highest area under rice cultivation (∼43 million ha) in the world (Guha et al., 2021; India at a Glance, Food and Agriculture Organization of the United Nations India, 2024). Rice contributes more than 40% of India's total food grain production. In 2019–2020, the area under rice cultivation was 43.7 million ha, with a total production of 118.4 million tonnes and average productivity of around 2,705 kg/ha. Kharif (summer monsoon) rice has a significant share in total rice production in India. In 2019–2020, the Kharif rice production was estimated to be 102.4 million tonnes (Guha et al., 2021).
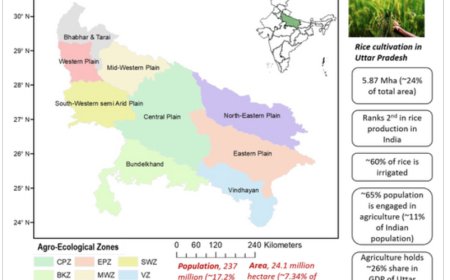
Uttar Pradesh (situated in the Indo-Gangetic plain) is the second-largest rice-producing state with almost 5.87 million hectares of land (∼13.5% of rice cultivated land of India) used for rice cultivation, producing about 19.9 million tonnes per year (11%–12% of rice grown in India). The average rice productivity of Uttar Pradesh (∼2,150 kg/ha) is below the national average (∼2,700 kg/ha). The average farm size in India has almost halved (2.28–1.08 ha) from 1970 (Saxena et al., 2015) due to the growing population. The average size of landholding in Uttar Pradesh is 0.80 ha (below India's average), and for the small farm category, it is only 0.55 ha. Across regions, the average size of farm holdings is lowest in the eastern region (0.64 ha), and highest in the Bundelkhand region (1.49 ha). A large portion of the state's rice is produced by small-scale farmers and is consumed locally. With approximately 65% of the Uttar Pradesh workforce engaged in the agriculture sector, contributing around 26% to the state's GDP (see Figure 1), even minor disruption in the rice production would adversely affect the already marginalized farmers.
Agro-Ecological Zones and socioeconomic characteristics of Uttar Pradesh (Guha et al., 2021).

Rice is cultivated in all the districts of Uttar Pradesh, which have diverse climate regimes, irrigation infrastructures, crop management practices, and farm sizes (0.55–1.49 ha). Different agroecological zones (AEZs) of the state have different climates (semi-arid to sub-humid) and large variability in monsoon rainfall (Figure 1). Rice production in Uttar Pradesh also varies in different AEZs due to different irrigation infrastructure, technology, and crop management practices. There is also interannual variability in rice yield (Guha et al., 2021), which can be linked to monsoonal rainfall variability, also seen in other parts of India (Suneetha & Kumar, 2013). Interannual variability in rainfall also affects groundwater levels that affect the irrigation in Uttar Pradesh, which depends primarily on groundwater. Further, the cost and accessibility of groundwater vary in different AEZs due to differences in irrigation infrastructure (Mall et al., 2006; Zaveri et al., 2016). Hence, small farm sizes, diverse crop management practices, and constrained irrigation infrastructure are the primary limiting factors affecting crop production in different AEZs of Uttar Pradesh (Mall et al., 2006; Mishra et al., 2013; Zaveri et al., 2016).
In the past two decades, the frequency and magnitude of agricultural losses due to climate-related hazards (floods, droughts, heatwaves, cold waves and weather-related pests and diseases) have increased significantly in various parts of India (Soora et al., 2013; R. K. Srivastava et al., 2021). Increased temperature and changes in rainfall frequency and distribution in the future are expected to affect crop production and productivity over space and time (Donohue et al., 2013; Gupta & Mishra, 2019; Mishra et al., 2013). Small and marginal farmers in Uttar Pradesh often operate with incomes insufficient for their daily needs, leading to a reliance on borrowing for survival. The high costs associated with crop management, such as fertilizers, irrigation, and high-yield varieties, compound their financial challenges (Beriya, 2020). With many of these farmers living below the poverty line, their ability to access advanced water extraction technologies or alter cropping patterns in response to climate change is limited. As a result, the poor and marginalized small farm holders of Uttar Pradesh will be hit hardest by the consequences of the increasing frequency and magnitude of climate hazards.
Field experiments to understand the crop growth processes under various climate and management conditions are time-consuming and costly, so they are limited in capacity. Hence, it becomes difficult to evaluate and extrapolate site-specific crop experiments under changing climate, CO2 concentration and diverse management practices. On the other hand, crop models are a practical and efficient tool to simulate crop growth and yield to understand the impact of climate variables and CO2 in the absence of conventional field experiments (J. W. Jones et al., 2003; Rosenzweig et al., 2002; White et al., 2011).
CERES-Rice embedded in Decision Support System for Agro-technology Transfer (DSSAT) is a process-based and management-oriented model that can simulate the growth and development of rice for varying weather, water, nitrogen, and cultivar characteristics (J. W. Jones et al., 2003). (CERES is an acronym for Crop Estimation through Resource and Environment Synthesis, and Ceres was the Roman goddess of agriculture.) CERES-Rice considers the effects of elevated CO2 concentrations, change in climatic parameters (e.g., temperatures, rainfall, and solar radiation) and crop management practices, and simulates water requirement and yield. CERES-Rice has been calibrated, validated and extensively used to simulate rice growth process under different climates, crop management practices, and soil conditions over India, and had been found to perform satisfactorily (Gupta & Mishra, 2019; Mall et al., 2018; Mishra et al., 2013; Rao et al., 2016; Satapathy et al., 2014; K. Singh et al., 2017). However, most of these studies were carried out by taking a few coarse-resolution general circulation model (GCM) outputs for limited sites and have been extrapolated for a larger region.
Studies on the impact of climate change on rice yields have confirmed that an increase in temperature and changes in rainfall patterns will adversely impact rice production (Agarwal, 2007; Guo et al., 2019; Rao et al., 2016; Teng et al., 2016; Varghese et al., 2020). Rice is the most important crop of India, and an increase in rice yields during the green revolution helped gain India food security. However, the production and productivity of rice have reached a steady level in many regions (Aggarwal et al., 2006; Milesi et al., 2010).
An increase of ∼1°C has been observed in average global surface temperature since pre-industrial times. Moreover, it is reported that Indian Summer Monsoon rainfall has been declining since 1950, with the highest significant trends found over the Indo-Gangetic plains and increasing extreme rainfall events over central India (Goswami et al., 2006; Kulkarni, 2012; Roxy et al., 2015, 2017). A study over the Indo-Gangetic plains depicts a change in rice yield, ranging from −120 to +50 kg/ha/yr from 1985 to 2000 (Pathak et al., 2003). For 2009–2010, India's rice production reduced by ∼10 Mt due to late onset of monsoon and its intra-seasonal variability (Soora et al., 2013). Interannual variability in India's rice yield suggests dependence of rice production on monsoonal rainfall that is affected by changing climate, especially in areas like the Indo-Gangetic plains (Soora et al., 2013). The mean temperature during the crop season is already above the optimal range in Uttar Pradesh, and further increase in temperatures will only increase the extent of crop damage (Bhatt et al., 2019). The altered rainfall pattern, increased frequency of drought and increased temperature can translate to a loss of up to 40% in annual crop yield (T. Li et al., 2015), and it may lead to a severe income loss of about 58% (Pandey & Bhandari, 2009). These adverse changes in the climate system and the declining rice yield trend may lead to food insecurity in already stressed and vulnerable regions like Uttar Pradesh (situated in the Indo-Gangetic plains). Simultaneously, the addition of approximately 40 million people (equivalent to the population of Canada) per decade to Uttar Pradesh (as seen in the last two decades), is further jeopardizing the future of food security.
The challenges mentioned earlier are sure to be affected by future climate change, which will impact crop production in space and time through direct or indirect interactions with an increases in temperature and CO2 concentration, and changes in water availability and other climatic variables (Agarwal, 2007; Cammarano et al., 2016; Donohue et al., 2013; Korres et al., 2017; J. Singh et al., 2020; White et al., 2011). Without the efforts of reducing fossil fuel emissions, the average global temperature will surpass 1.5°C by 2030 (Allen et al., 2018). Fan et al. (2020) have reported a global mean land temperature increase in the range of 1.2°C–7.2°C by the end of the 21st century. A substantial rise in mean, extreme and interannual variability of JJAS rainfall under global warming over India has been reported in recent studies (Katzenberger et al., 2021; Kitoh, 2017; Yaduvanshi et al., 2019, 2021). Although increased CO2 concentrations will enhance photosynthesis efficiency, adverse impacts on crops through the change in water availability and increasing temperature (above optimal) will exceed the CO2 fertilization effect (Donohue et al., 2013; Korres et al., 2017; Toreti et al., 2020).
Conventionally, studies over India have mostly concentrated on understanding the changes in crop processes by changing the average temperature, CO2 amounts, rainfall, and irrigation and have not considered the projected climate data from GCMs (Mishra et al., 2013). There are a few studies over India (see Table S1 in Supporting Information S1) using crop models and climate projections from GCMs to understand the impact on rice production. However, most of these studies are site-specific, using limited crop management practices, few GCM outputs and few Coupled Model Intercomparison Project (CMIP, Eyring et al., 2016) scenarios. These studies suggest a need for a high-resolution gridded crop model simulation using the latest climate scenarios, a large ensemble of GCMs, and a combination of crop management practices to understand the underlying uncertainties, sensitivity and impacts in a more comprehensive manner. Apart from this, most of these studies have concentrated on assessing the effects of climate change on rice yield. However, other factors such as change in phenology, crop water requirement and water use efficiency (WUE) are also important (Bouras et al., 2019; R. K. Srivastava et al., 2021). Therefore, this research assessed the effects of climate change on rice phenology, crop water requirement, irrigation, yield, and WUE for various crop-climate scenarios (16 CMIP6 GCMs, 2 SSPs, 4 rice varieties, 3 planting dates, and 2 irrigation scenarios over 342 sites (at 25 × 25 km resolution) over the nine AEZs of Uttar Pradesh (Figure 1).
2 Materials and Methods
2.1 Study Region
Uttar Pradesh is a northern state of India situated in the Indo-Gangetic plains, located between 23°52′N and 31°28′N latitudes and 77°3′E and 84°39′E longitudes (Figure 1). The total area of the state is 24.1 million hectares (∼7.34% of India). The population of Uttar Pradesh was 166 million in 2001, 199 million in 2011, and was estimated to be 237 million (∼17.2% of India's population) in 2020. The population density of the state was 690, 829, and 983 people/km2 for 2001, 2011, and 2020, respectively. The state has a total area of 24.1 Mha, out of which 16.81 Mha is cultivated, constituting around 70% of the total geographical area, having an annual cropping intensity of 153% (sown more than once a year). The primary crops are rice, wheat, maize, sugarcane, chickpea, and pigeon pea.
Hot summers and sub-tropical monsoon define the characteristics of Uttar Pradesh's climate. However, the weather conditions vary significantly with location. Uttar Pradesh falls under three major agroecological zones of India (based on climate and soil), namely, middle Gangetic plain, upper Gangetic plain, and central plateau. The Middle Gangetic plain is further divided into the North-Eastern Plain Zone (NEZ), the Eastern Plain Zone (EPZ), and the Vindhyan Zone (VZ). The Upper Gangetic plain is the largest agroecological zone with the highest share of population, covering 32 districts out of total 83 districts, and is further divided into the Central Plain Zone (CPZ), the Mid-western plain Zone (MWZ), the Bhabhar and Tarai Zone (BTZ), the Western Plain Zone (WPZ), and the Southwestern semi-arid plain Zone (SWZ). The central plateau zone contains the Bundelkhand Zone (BKZ). The description of these nine AEZs is given in Figure 2, describing their climate and percentage of cultivated and irrigated land. It can be seen in Figure 2 that the EPZ (80%) has the highest irrigated land, and the BKZ has the lowest (25%).
Climate type, percentage of cultivated and irrigated land for each agroecological zone (AEZ) of Uttar Pradesh (Guha et al., 2021). We estimated the percentage of AEZ-wise irrigated land from the Integrated Watershed Management Programme (I.W.M.P) in 2009 by the Government of Uttar Pradesh, India for Perspective and Strategic Plan (http://dolr.gov.in/sites/default/files/SPSP_Uttar%20Pradesh.pdf); for details see Table SPSP-10 of the report.

2.2 Climate and Crop Data
We acquired observed daily climate data (maximum temperature (Tmax), minimum temperature (Tmin), rainfall and solar radiation (srad)) to be used as input in the CERES-Rice model. Data for Tmax and Tmin are available at 1° × 1° resolution from the India Meteorological Department (IMD) for 1995–2014 (A. K. Srivastava et al., 2009). Daily rainfall data are available at 0.25° × 0.25° resolution for 1995–2014, also retrieved from IMD (Pai et al., 2014). Daily srad (0.5° × 0.5°) data are retrieved from NASA's Prediction Of Worldwide Energy Resources (POWER, obtained from https://power.larc.nasa.gov/data-access-viewer) for the period 1995–2014 (Stackhouse et al., 2015).
The shared socioeconomic pathways (SSPs) runs are part of ScenarioMIP which is one of the main activities of CMIP6 and is a combination of SSPs and RCPs that makes future scenarios more reasonable (Eyring et al., 2016; O’Neill et al., 2016). For future climate, SSP2-4.5 and SSP5-8.5 from CMIP6 are used in this study. SSP2-4.5 consists of a medium radiative forcing category of 4.5 W/m2 by 2100 and medium land use and aerosol pathways also called “middle of the road” SSP (Figure S1 in Supporting Information S1). SSP5-8.5 is the high end of the range of future scenarios having the combination of the highest forcing (8.5 W/m2) and fossil-fueled development of SSP5. SSP2-4.5 and SSP5-8.5 are relevant for impacts, adaptation, and vulnerability studies because combining these two scenarios covers the medium to worst societal vulnerability (SSP2 and SSP5) with medium to high forcing (O’Neill et al., 2016).
-
Rice growth process as a function of genotype, weather, soil, and management,
-
Phenology (anthesis and maturity) as a function of temperature and photoperiod,
-
Biomass accumulation based on radiation use efficiency approach and considers the impact of different concentration of atmospheric CO2,
-
Partitioning of biomass among leaves, stems, roots, and reproductive parts based on phenology, and
-
Soil water balance that simulates the daily evaporation, runoff, percolation, and crop water uptake under irrigated and rainfed conditions.
2.3 Crop Management Data
Crop management data consist of rice cultivar, planting dates, fertilizer application frequency and amount, and irrigation frequency and amount. These crop management practices were provided by the Agromet division of IMD. The CERES-Rice model was calibrated and validated with these management practices for a few districts of Uttar Pradesh by the Agromet division (details can be found in Appendix A). The experimental data used in the process of calibration and validation are maximum leaf area index, panicle initiation date, anthesis date, physiological maturity date, grain yield at maturity, grain weight, grain number, planting depth, row spacing and plant population at seeding, planting method, and fertilizer and irrigation application. The details of calibrated genetic coefficients values of the rice varieties are given in Table S3 in Supporting Information S1 and the explanation of genetic coefficients are given in Table S4 in Supporting Information S1 (Buddhaboon et al., 2018). Soil data for 70 sites from various AEZs of Uttar Pradesh were also provided by the IMD Agromet division. Physical and chemical description of the soil profile with separate information for each master horizon, for example, depth, organic carbon, sand, clay and silt percentage, drainage upper and lower limits, and saturated hydraulic conductivity, are included in a soil profile. Soil drainage upper and lower limits correspond to the field capacity and permanent wilting point, respectively.
Transplantation of rice in Uttar Pradesh generally commences with the onset of the monsoon, that is, mid-June to early July. However, transplanting is done even before the monsoon onset by farmers with adequate irrigation infrastructure and availability. In the regions of Uttar Pradesh having inadequate irrigation infrastructure and electricity, transplanting is delayed and continued until the end of July. In the literature, we found a wide range of transplanting dates and conducted an online survey by providing a questionnaire to farmers regarding the management practices for rice cultivation. Based on the literature and farmers survey, we chose three planting dates (25 June, 5 July, and 15 July).
Irrigated and rainfed rice were simulated using fertilizer application of 120 kg NPK/ha (N:P:K ratio is 120:60:60) in three divided doses of 60 kg/ha (at basal), 30 kg/ha (at active tillering), and 30 kg/ha (at panicle initiation) at 0, 25, and 55 days after planting. Three planting dates, early season (25 June), mid-season (5 July), and late season (15 July) are considered to cover approximate cropping window for rice planting in Uttar Pradesh. We evaluated two irrigation scenarios: rainfed and irrigated (automatic irrigation). For the automatic irrigation scenario, irrigation within the CERES-Rice model is activated once the soil moisture level drops below a specified threshold. We utilized a flood depth (mm) irrigation method, assuming 100% irrigation efficiency where there is no water loss through the irrigation process, representing an idealized scenario.
2.4 Crop-Model Simulation Design
To evaluate the performance of 20 selected CMIP6 GCMs (Table S2 in Supporting Information S1), we have taken 20 years (1995–2014) of IMD and model historical data. We have examined the performance for seasonal mean (JJAS) rainfall, Tmax and Tmin over Uttar Pradesh. After the performance evaluation, 16 GCMs were selected and the data from these GCMs were bias corrected and statistically downscaled (at 0.25°) using IMD data. Quantile mapping is used to bias correct and downscale the climate variables. The details of the statistical downscaling are explained in the Text S3 in Supporting Information S1. These downscaled climate data from the 16 GCMs are used to force the CERES-Rice crop model. Details of the GCM performance evaluation, bias-correction and downscaling are provided in Supporting Information S1.
The CERES-Rice model simulates crop growth, development, and yield by taking weather data, soil conditions, crop management practices and crop cultivar characteristics as input. The calibrated version of the CERES-Rice model is assumed to simulate rice growth, development, and yield with reasonable accuracy in Uttar Pradesh, provided the same genetics and management practices are used. CERES-Rice is a site-based model; however, consistently evaluating crop productivity and growth-related parameters at the global and regional levels is crucial to assess the possible impacts of climate change and identify system vulnerabilities and potential adaptations. Uttar Pradesh is a big state (24.5 million ha; including 345 grid boxes of 0.25° × 0.25° resolution), and hence a software framework was developed to run DSSAT in a gridded environment. Although Uttar Pradesh's vast area necessitates a gridded approach to model deployment, the adaptation to a gridded environment does not incorporate plant-atmosphere feedback or grid-to-grid interactions, thereby functioning similarly to its original point-based design.
In CERES-Rice simulations, crop management practices (rice varieties, irrigation, fertilizer applications) provided by IMD's Agromet division were used. Figure 3 describes the crop model experiments for various climate-crop scenarios. As seen in Figure 3, a total of 1,152 (16 × 4 × 2 × 3 × 3) experiments were designed with the combination of planting dates (3), rice cultivar (4), GCMs (16), irrigation conditions (2), and CO2 concentration (3; historical, SSP2-4.5 and SSP5-8.5) for a total of 342 grids. Phenology (anthesis and maturity), irrigation amount, evapotranspiration (ET), transpiration (EP) and evaporation (ES), yield and WUE obtained as CERES-Rice outputs are evaluated for every AEZ. For historical runs (1995–2014), GCM-forced simulations were evaluated with IMD-forced simulations for early, mid, and late planting (25 June, 5 July, and 15 July) averaged for the four rice varieties.
Design and flow of Crop Estimation through Resource and Environment Synthesis-Rice model inputs and simulation.

CO2 sensitivity analysis experiments were designed for mid planting by taking the 2005 representative atmospheric CO2 concentration (373 ppm: an average of 1995–2014) as the base value and taking climate information from SSP2-4.5 and SSP5-8.5 for the 2030s, 2050s, and 2090s. The different climate-crop scenarios for CO2 sensitivity are defined by combining the climate data (16), rice varieties (4), irrigation (2), planting dates (1), and CO2 amount (2), making a total of 256 scenarios (16 × 4 × 2 × 1 × 2). The impact of CO2 fertilization on yield, ET, and WUE are assessed by comparing the CO2 experimental simulation to that of SSP2-4.5 and SSP5-8.5 for mid planting.
For assessing the impact of climate change on rice cultivation, an average of all 4 rice varieties and 16 GCMs (multi-model mean) from DSSAT output is computed for seasonal temperature, rainfall, irrigation amount, transpiration, evaporation, yield and WUE, and changes are assessed for each planting season, irrigation condition, future period, and SSP. The uncertainty in the outputs of CERES-Rice forced with the 16 GCM climates is assessed by computing the inter-model standard deviation. Robustness of projected changes in CERES-Rice outputs (e.g., yield, ET, WUE) is assessed by stippling the grid points that have at least 75% of GCMs agreeing on the sign of projected change.
3 Results and Discussion
3.1 Change in Temperature
Bias adjusted and downscaled CMIP6 daily temperatures (Tmax and Tmin) were used to project changes in Tmax and Tmin for different growing seasons over Uttar Pradesh under SSP2-4.5 and SSP5-8.5. Figures S3(I) and S3(II) in Supporting Information S1 show Tmax for historical and their differences for 2026–2035, 2046–2055, and 2090–2099 under SSP2-4.5 and SSP5-8.5, respectively.
Historical seasonal Tmax ranges from 28 to 35°C (see Figure S3 in Supporting Information S1), having the highest temperature in the semi-arid western plains (WPZ, SWZ) and lowest in Tarai region (BTZ). The magnitude of Tmax decreases from early to late planting and standard deviation among the models is approximately 0.3°C in the historical period. For the 2030s (2026–2035), the changes are within 0.5°C for both SSPs and planting season, except in the mid-planting of SSP2-4.5. For the 2050s (2046–2055), the changes are between 0.5–1°C and 1–1.5°C (for all the planting seasons) under SSP2-4.5 and SSP5-8.5, respectively. By the 2090s (2090–2099), temperature increases by 2.5°C in mid planting and 2°C in early and late planting under SSP2-4.5. The lowest changes are seen in the southwestern region (WPZ, SWZ, western CPZ, and BKZ). Under SSP5-8.5, the increase is between 3–3.5°C in eastern and 2.5–3°C in western Uttar Pradesh.
Tmin for the historical period ranges from 19 to 27°C (see Figure S4 in Supporting Information S1) and decreases from early to late planting. The lowest seasonal Tmin is observed in the Tarai region (BTZ, MWZ) and southern Uttar Pradesh that are part of the Vindhya Mountain ranges (BKZ, VZ). For the 2030s, Tmin increases by 0.5–1.5°C in mid planting season and is under 0.5°C for early planting under both SSPs. The late planting season changes in the 2030s are below 0.5°C under SSP2-4.5 and between 0.5 and 1.5°C under SSP5-8.5.
Under SSP2-4.5, in the 2050s, changes are between 1.5–2°C in BTZ and 1–1.5°C in other AEZs, with the magnitude of change intensifying from early to late planting. Under SSP5-8.5, the pattern and characteristics of changes are similar to SSP2-4.5 but have magnitudes higher by around 0.5°C. Under SSP2-4.5, in the 2090s, the increase in Tmin ranges between 2 and 3.5°C, with the highest increase in mid-planting followed by late and early planting. Under SSP5-8.5, the increase in Tmin ranges from 3 to 5°C, increasing in magnitude from early to late planting.
For early and mid-planting, the highest changes are in Tarai and western parts of Uttar Pradesh, however, in late planting, the changes are of similar magnitude over the entire region except for the Tarai region (highest increase in Tmin). Contrary to what was seen for Tmax, the highest changes in Tmin are projected in western parts of the state. The range of diurnal temperature is projected to diminish more for the western than the eastern part of the state because the change for Tmax is high and for Tmin it is low over eastern parts and vice-versa for western parts of the state.
3.2 Change in Phenology (Anthesis and Maturity)
Anthesis is the period of opening of flower buds, which is a function of Tmax and Tmin computed in the form of growing-degree days (GDD) in CERES-Rice. If the temperatures are above optimal, the anthesis duration decreases. In Uttar Pradesh, temperatures are already on the verge of or higher than optimal, hence further increase in temperature will result in reduced anthesis duration. In Figure S5 in Supporting Information S1, we can see that anthesis duration in the baseline period ranges from 60 to 64 dap (days after planting), except in the Tarai region (up to 80 days). The decrease is below 3% (less than 2 days) under both SSPs in the 2030s, with the highest agreement on the sign of change for mid-planting. In the 2050s, the decrease ranges between 3% and 5% for most regions under both SSPs, and there is no disagreement among models on the sign of change, however, in SSP5-8.5, the reduction is more prominent (5%–7%) in BTZ and northern MWZ and CPZ. Under SSP2-4.5, by the 2090s, the decrease is 1%–3% in semi-arid western plains, 7%–9% in the Tarai region, and 5%–7% in the rest of the state. Under SSP5-8.5, the reduction is 5%–13%, with the lowest in semi-arid western plains, and the intensity of change increases from early to late planting.
Maturity is the period from planting to the end of ripening when the water content in the plant is less than 14% and is computed in the form of GDD in CERES-Rice. Once maturity is reached the crop is ready to be harvested. However, in actual practice, the crop's maturity varies from harvesting time from place to place. Maturity defines the length of growing period (LGP) and affects the yield of crops. Figure 4 shows the maturity duration in historical and changes for various future periods under SSP2-4.5 (Figure 4(I)) and SSP5-8.5 (Figure 4(II)). Maturity ranges from 92 to 120 days after planting in BTZ and upper MWZ and 87–92 days after planting in the rest of the state. In the 2030s, maturity duration reduces 2%–5% in BTZ, MWZ and NEZ and less than 2% for the rest of the AEZs. The intensity of reduction increases from early to late planting. Under SSP2-4.5, in the 2050s, the reduction is 5%–9% in the Tarai region (BTZ and upper MWZ) and 3%–5% in other AEZs. Under SSP5-8.5, these changes range between 5% and 11%, with the highest change in Tarai. By the 2090s, the decrease in maturity duration reaches 7%–13% and 7%–15% in SSP2-4.5 and SSP5-8.5, respectively. The decreases are highest in late planting and lowest in early planting for both SSPs. The lowest decrease is witnessed over semi-arid western plains of the state.
Changes in seasonal maturity duration for (I) SSP2-4.5 and (II) SSP5-8.5 are shown. (a, e, and i) Subfigures I and II show historical, and (b, f, and j) changes for 2026–2035, (c, g, and k) 2046–2055, and (d, h, and l) 2090–2099 for early planting (first and fourth row), mid-planting (second and fifth row), and late planting (third and sixth row). Overlaid black dots represent model agreement (75% of models) on sign of change. Black contours show inter-model standard deviation of 16 CMIP6 general circulation models.

3.3 Change in Rainfall
Historical seasonal rainfall ranges from 200 to 1,400 mm over the state, with the lowest rainfall over semi-arid western plains (SWZ, WPZ) and lower CPZ and highest over BTZ, MWZ, and NEZ (see Figure S6 in Supporting Information S1). In the baseline period, seasonal rainfall decreases from early to late planting, and the standard deviation among the 16 GCMs is approximately 60 mm. Under SSP2-4.5, the increase in rainfall for the 2030s and the 2050s is up to 90 mm (15%), and for the 2090s, it is 90–180 mm (15%–25%). The lowest changes are projected in early planting and the highest in late planting. The inter-model standard deviation ranges from around 120 mm for the Tarai region, 60 mm for semi-arid western plains and 90 mm for the other AEZs. Under SSP5-8.5, the increase in rainfall for the 2030s and the 2050s is up to 90 mm (15%), and for the 2090s, it is 90–300 mm (15%–40%). During the 2090s, changes are large over BTZ, MWZ, NEZ, and upper CPZ. Standard deviation among the models increases from the 2030s (70–100 mm) to the 2090s (130 mm). As the magnitude of changes is high, there is no ambiguity in the sign of change among the models under both SSPs.
3.4 Change in Crop Water Requirement
Crop water requirement is defined as the amount of water (mm) required to meet the water demand through ET consumption for the entire crop growth period. The crop water requirement assumes that the crop is grown under optimal management and environmental conditions (uniform crop, actively growing, completely shading the ground, free of diseases, and favorable soil conditions). Seasonal evapotranspiration (sum of daily ET) is influenced by its growth stages, climatic conditions, and crop management practices. The concept of crop water requirement and ET is applied for both irrigated and rainfed rice. For irrigated rice, the crop water requirement is fulfilled by irrigation, which is the amount of water (mm) required to satisfy its specific crop water requirement fully. Irrigation required is the fraction of crop water requirement not satisfied by rainfall and soil moisture.
This section discusses the irrigation amount (dependent on ET and rainfall) for irrigated rice, and ET for rainfed rice. Rice ET is the sum of rice transpiration (major component) and soil evaporation. Temperature, rainfall, CO2 and LGP (based on phenology) affect crop ET. Increased temperatures may cause a higher vapor pressure deficit resulting in increased crop ET rates (Walter et al., 2004). We have already discussed that global warming will advance the rice crop's anthesis and shorten the maturity period, hence, shortening the rice LGP leading to crop ET decline. Further, enrichment in atmospheric CO2 reduces leaf stomatal conductance, consequently reducing water loss through transpiration. Assessing the crop ET response to climate change is non-linear and complex because various mechanisms and parameters influence it (Mo et al., 2013).
Seasonal irrigated rice ET ranges from 250 to 450 mm for all the growing season over Uttar Pradesh, with an inter-model standard deviation of 30 mm for the historical (see Figure S7 in Supporting Information S1). Semi-arid plains and Tarai region has highest and eastern part of the state has lowest ET amounts showing similar magnitude and spatial pattern for all the planting seasons. ET is a combination of EP and ES, transpiration being the dominant component. EP ranges from 140 to 270 mm, with the highest transpiration in semi-arid to dry sub-humid AEZs (WPZ, SWZ, and western CPZ) with similar characteristics in all planting seasons. ES ranges between 90 and 220 mm, with lowest evaporation in semi-arid AEZs and highest in sub-humid AEZs (upper CPZ and NEZ), and increases from early to late planting.
Under SSP2-4.5, in the 2030s, ET decreases by 4%–8%, and change intensifies from early to late planting. EP (1%–10%) and ES (1%–8%) decrease in the 2030s; for EP, the decrease is highest in late planting and for ES in early planting. Since EP is the dominant component, ET shows a spatial pattern similar to EP. Under SSP5-8.5, the changes in ET range between −4% and −6% in most of the AEZs, with MWZ (−6% to −8%) showing higher change. Changes in EP are similar to that under SSP2-4.5, however, the magnitude of change is lower for ES in SSP5-8.5. In the 2050s, the decline ranges between 4% and 10% for both SSPs and has a similar pattern of change (highest in BTZ, WPZ, MWZ, and VZ). Under SSP2-4.5, EP decreases by 4%–10%, and the change intensifies from early to late planting; ES reduces between 1% and 4% uniformly over all AEZs. Under SSP5-8.5, change in EP is more prominent (4%–12%) than that under SSP2-4.5; ES decreases over MWZ and NEZ (1%–4%), and for the rest of the AEZs, change is negligible or positive (less than 4%). By the end of the century, under SSP2-4.5, the magnitude of changes declines in WPZ, BKZ, CPZ, NEZ, and EPZ, however, under SSP5-8.5, the changes intensify over western parts and decline over eastern parts of the state. The 2090s changes in EP are similar to the 2050s under SSP2-4.5 and intensifies (up to 20%) under SSP5-8.5. Changes in ES are positive (1%–8%) except the Tarai region under SP245 and have a similar pattern with an increase in intensity (1%–12%) under SSP5-8.5.
Overall, irrigated rice EP decreases for all the periods under both SSPs; the percentage of change is highest in the 2090s under SSP5-8.5, reaching up to 20% (CO2 ∼1,000 ppm). Irrigated rice EP does not show any specific correlation with temperature, probably because of the trade-off between the impacts of increased temperature and CO2 and a decrease in LGP on EP. The lowest soil evaporation for irrigated rice is over semi-arid AEZs and the highest over sub-humid AEZs (upper CPZ, NEZ). Under SSP2-4.5, soil evaporation decreases for the 2030s and the 2050s and increases for the 2090s. Under SSP5-8.5, soil evaporation decreases for the 2030s, increases for the 2090s, and shows a mixed spatial pattern in the 2050s. Soil evaporation is positively correlated with rainfall. Under both SSPs, for all periods, crop ET decreases (−1% to −12%) for irrigated rice. For the 2090s, the decline in ET under SSP2-4.5 is lower than in previous periods; however, under SSP5-8.5, the decline in ET intensifies compared to previous periods, because in the 2090s soil evaporation increases for both SSPs, however, the decline in crop transpiration is intensified under SSP5-8.5 but not under SSP2-4.5.
Irrigation is a function of soil moisture in the CERES-Rice model. Soil moisture is a function of rainfall, root water uptake, runoff, and soil evaporation. Crops utilize only a small portion of root water uptake amount, while most of it is lost through transpiration. The irrigation use efficiency is taken as 100%, assuming no water is wasted in the field and the plant utilizes every drop in our experiments of CERES-Rice. However, in reality, irrigation efficiency for flood irrigation is 60%; approximately 40% of the irrigation is wasted in most parts of India. The irrigation amount for historical ranges between 60 and 200 mm, with the highest irrigation amount in late planting (see Figure 5). The highest irrigation is triggered in western parts of the state (semi-arid and dry sub-humid) and lowest in sub-humid parts of the state. Inter-model standard deviation in irrigation is 30–50 mm, with highest in western plains. Overall, soil moisture is increasing (due to an increase in rainfall) for all the periods, and SSPs, and crop water requirement (function of ET) decreases. As a result, irrigation demand decreases for all the periods and SSPs, with spatially varying magnitudes. The percentage decrease in irrigation ranges from 3% to 25% and 3% to 35% for the 2030s and the 2050s, respectively, under both SSPs. For the 2090s, the percentage decrease in irrigation is 10%–45% and 10%–55% under SSP2-4.5 and SSP5-8.5, respectively. Overall, the decline in irrigation requirement is highest for late planting during the 2090s under both SSPs.
Changes in seasonal irrigation amount for (I) SSP2-4.5 and (II) SSP5-8.5. (a, e, and i) Subfigures I and II show historical, and changes for (b, f, and i) 2026–2035, (c, g, and k) 2046–2055, and (d, h, and l) 2090–2099 for early planting (first and fourth row), mid-planting (second and fifth row), and late planting (third and sixth row). Overlaid black dots represent model agreement (75% of models) on sign of change. Black contours show inter-model standard deviation of 16 CMIP6 general circulation models.
Historical rainfed rice ET ranges from 250 to 330 mm for all planting seasons over Uttar Pradesh which is significantly less than irrigated rice ET (350–450 mm), because water is a limiting factor for rainfed rice, therefore, it is far below the potential ET, unlike irrigated rice (Figure S8 in Supporting Information S1). ET partitioning between plant transpiration and soil evaporation is similar (with transpiration being the major component) for irrigated and rainfed rice. For rainfed rice, soil evaporation is highest in eastern Uttar Pradesh (sub-humid AEZs), and plant transpiration is highest in the Tarai regions. The decrease in rainfed rice ET is lower (∼4%) than irrigated rice ET for all periods and SSPs. ET is affected by temperature, rainfall, CO2, and LGP, and all these factors are the same for rainfed and irrigated rice. However, with an increase in rainfall, rainfed rice ET increases, leading to a lower decline of rainfed ET than irrigated ET. R. K. Srivastava et al. (2021) also reported that crop ET for rainfed and irrigated crops are sensitive to different parameters, hence their patterns of projected change under future climate may not be identical.
Under both SSPs, rainfed rice ET decreases from 1% to 8% over Uttar Pradesh. The magnitude of the decline is smallest in semi-arid western Uttar Pradesh for the 2030s and the 2050s. Western Uttar Pradesh has low soil evaporation and high plant transpiration amount in the historical period. Over western Uttar Pradesh, the overall change in soil evaporation and plant transpiration is positive and negative (lowest change compared to the rest of the domain), respectively, under both SSPs. This trade-off between soil evaporation and plant transpiration minimizes the net change in rainfed rice ET over western Uttar Pradesh. Eastern Uttar Pradesh shows the highest magnitude of change in rainfed rice ET. Under SSP2-4.5, in the 2090s, change is either negligible or positive in BTZ, WPZ, SWZ and western CPZ and negative in all other AEZs. Under SSP5-8.5, in the 2090s, change is negligible/positive in SWZ, western CPZ and NEZ and negative in remaining AEZs.
3.4.1 Irrigated Rice ET
3.4.2 Irrigation Requirement

3.4.3 Rainfed Rice ET
3.5 Change in Crop Yield
Rice yield is a function of temperature, LGP, rainfall and CO2. If the temperature increases beyond a threshold for a certain amount of time, then the growth and development of the plant are damaged irreversibly (Khan et al., 2019; Xu et al., 2021). Shorter LGP associated with higher temperature due to a decline in cumulative intercepted radiation leads to a reduced biomass and grain yield (Mearns et al., 1997). Change in rainfall will impact soil water balance, soil evaporation, and rice transpiration (Kang et al., 2009). Changes in rainfall would not significantly impact irrigated rice yields because soil moisture is not a limiting factor for irrigated rice.
To assess the potential impact of climate change and overall uncertainty associated with the projected changes on irrigated rice yield, the multi-GCM ensemble of the yield change projected by individual GCMs for SSP2-4.5 and SSP5-8.5 for three future periods is shown in Figure 6. The overlaid contour on the plots shows the standard deviation among the CMIP6 GCMs. CERES-Rice simulated historical (1995–2014) rice yield ranges from 3,500 to 5,000 kg/ha, with yield decreasing from early to late planting. The standard deviation among the CMIP6 GCMs is 300 kg/ha in Tarai region and 200 kg/ha in rest of the AEZs. For both SSPs and all periods, irrigated rice yield decreases due to increased seasonal mean daily maximum and daily minimum temperatures beyond the optimal range (as seen in Figures S3 and S4 in Supporting Information S1). For both SSPs and all periods, yield decline is associated with decreased LGP and increase due to increased CO2 concentration (shown in the CO2 sensitivity experiments, discussed in Section 20). The reduction in yield is about 1%–5% in the 2030s under SSP2-4.5 and SSP5-8.5. In the 2050s, the decrease in yield is similar to the 2030s under both SSPs. However, under SSP2-4.5, the reduction in yield is higher for WPZ (5%–10% in mid planting) and MWZ (5%–10% in late planting).
Changes in irrigated rice yield for (I) SSP2-4.5 and (II) SSP5-8.5. (a, e, and i) Subfigures I and II show historical, and changes for (b, f, and j) 2026–2035, (c, g, and k) 2046–2055, and (d, h, and l) 2090–2099 for early planting (first and fourth row), mid-planting (second and fifth row), and late planting (third and sixth row). Overlaid black dots represent model agreement (75% of models) on sign of change. Black contours show inter-model standard deviation of 16 CMIP6 general circulation models.
In the 2090s, under SSP2-4.5, the changes are almost similar to the 2050s, with parts of BKZ and VZ showing higher reductions (5%–10%). Under SSP5-8.5, the reduction is between 5% and 15% by the 2090s, with the highest decrease in late planting. Absolute changes in mean yield from 16 CMIP6 GCMs is aggregated for each AEZ and is shown in the form of box plots (Figure S9 in Supporting Information S1). The figure shows that uncertainties are highest in BTZ and WPZ for all the periods and SSPs. Under SSP5-8.5, by the 2090s, the model uncertainties increase for all the AEZs.
Historical yield for rainfed rice ranges between 2,000 and 3,500 kg/ha, with the highest yield in mid planting and lowest in early planting. The lowest yield (2,000–2,500 kg/ha) is in semi-arid plains (WPZ and SWZ) and the western part of NEZ for all the planting seasons. On the contrary, eastern parts of NEZ, EPZ and central BKZ have the highest rainfed yield (3,000–3,500 kg/ha) for the mid planting, followed by late planting. The early season has the highest inter-model standard deviation of 700 kg/ha, followed by mid and late planting (500 kg/ha).
Under SSP2-4.5, in the 2030s, an increase of 1%–10% is projected in western and a decrease of up to 5% in eastern Uttar Pradesh (see Figure 7). Under SSP5-8.5, in the 2030s, the positive changes in yield (1%–10%) are more widespread than SSP2-4.5, but with negative changes in BKZ (up to 5%) in early planting and in late planting, and higher positive change (10%–15%) in BTZ and WPZ. In the 2050s, under both SSPs, the positive changes are projected to spatially shrink to SWZ, WPZ, BTZ, and MWZ (1%–10%), and all the other AEZs show negative (1%–5%) or minor changes (−1%–1%) for early and mid-planting. However, all the AEZs show positive changes (1%–20%) except for northern CPZ and eastern NEZ under both SSPs in the late-planting season. In the 2090s, under SSP2-4.5, changes are similar to the 2050s. Under SSP5-8.5, by the 2090s, the negative changes between 1% and 10% are widespread, and positive changes have reduced in magnitude and coverage. The increases in yield become more pronounced as the planting period shifts from early to late, and models show higher agreement on positive changes than negative and negligible changes under both SSPs. The model uncertainties are highest in projecting the changes over BTZ, WPS, and SWZ under both SSPs in the 2030s (Figure S10 in Supporting Information S1). The uncertainties in projecting rainfed rice yield are lowest in the late-planting season for the 2030s and the 2050s under both SSPs. By the 2090s, the uncertainties in sign of change are lowered for all the planting seasons and SSPs.
Changes in rainfed rice yield for (I) SSP2-4.5 and (II) SSP5-8.5 are shown. (a, e, and i) Subfigures I and II show historical, and changes for (b, f, and j) 2026–2035, (c, g, and k) 2046–2055, and (d, h, and l) 2090–2099 for early planting (first and fourth row), mid-planting (second and fifth row), and late planting (third and sixth row). Overlaid black dots represent model agreement (75% of models) on sign of change. Black contours show inter-model standard deviation of 16 CMIP6 general circulation models.
In contrast to irrigated rice, the spatial distribution of changes in rainfed rice yield displays a mix of both positive and negative values. Under both SSPs, an increase in rainfall has a positive impact on yield, indicating that beneficial effects of rainfall compensate for negative impacts of temperatures in rainfed rice (in line with Kang et al. (2009)). Under both SSPs, an increase in Tmax and Tmin have a negative impact on rainfed rice yield, and a decrease in rice ET is associated with a decrease in yield for rainfed rice (Figure S11 in Supporting Information S1). The yield reduction is higher in irrigated compared to rainfed conditions indicating rainfed rice yield is more sensitive to changes in rainfall than that in temperature (Kang et al., 2009; R. K. Srivastava et al., 2021).
3.5.1 Irrigated Rice Yield

3.5.2 Rainfed Rice Yield

3.6 Change in Water Use Efficiency (WUE)
WUE is an important metric used to understand the coupling between the water cycle and carbon assimilation in plants. In this study, WUE is computed as a ratio between yield (kg) and crop ET (m3), which describes the trade-off between the water loss and carbon sequestration in plant photosynthesis carbon assimilation (H. Jones, 2004). Photosynthesis and transpiration are affected by leaf stomatal conductance, hence have a critical linkage between the carbon and water cycles in crop growth processes (Beer et al., 2009; Niu et al., 2011).
Irrigated WUE is 0.6–1.2 kg/m3, with the highest WUE seen in western CPZ and upper BKZ (Figure S12 in Supporting Information S1). WUE reduces from early to late planting. Under both SSPs, WUE increases approximately 6% for the 2030s and the 2050s, except for the Tarai region, where projected changes are higher (6%–12%) in the 2050s. The model agreement on the sign of change is significant over the entire state in the 2030s and the 2050s. Under SSP2-4.5, in the 2090s, the change in irrigated rice WUE is relatively small for early and late planting and higher (up to 12%) for mid planting that has the highest agreement on the sign of change. Under SSP5-8.5, in the 2090s, WUE decreases (−12%), except in BTZ and MWZ, which shows an increase (up to 12%). The primary reason for the increased WUE in the 2030s and the 2050s is elevated CO2 concentrations, reducing leaf stomatal conductance and increasing biomass accumulation (Q. Li et al., 2010). As a result, water flux reduces considerably, leading to decreased transpiration (Q. Li et al., 2010). However, by the 2090s, the changes in WUE are either negligible or negative under both SSPs because of higher decreases in yield than evapotranspiration.
Historical WUE for rainfed rice ranges from 0.6 to 1.0 kg/m3 and is highest for mid planting and lowest for late planting over the entire region (Figure S13 in Supporting Information S1). Water use efficiency is lower for rainfed rice compared to irrigated rice. It is highest for eastern Uttar Pradesh (sub-humid) and lowest for western Uttar Pradesh (semi-arid). Under both SSPs, WUE is projected to increase by as much as ∼18% (e.g., BTZ) for the 2030s and the 2050s. Under SSP2-4.5, in the 2090s, change in WUE is insignificant/low for sub-humid regions (e.g., NEZ, EPZ, and VZ). Under SSP5-8.5, in the 2090s, WUE decreases (up to ∼12%) over eastern Uttar Pradesh and increases (up to ∼24%) over western Uttar Pradesh. Overall, the increase in WUE for rainfed rice is higher than irrigated rice. Thus, rainfed rice is projected to transpire less water per assimilated carbon, and hence use water more efficiently than irrigated rice.
3.6.1 Irrigated Rice WUE
3.6.2 Rainfed Rice WUE
3.7 Role of CO2 Fertilization
CO2 concentration will increase for both SSP5-8.5 and SSP2-4.5, and it has a direct impact on plant growth processes. This process is known as the CO2 fertilization effect and has been recognized and studied at both small scale (through laboratory field experiments; e.g. Garbulsky et al., 2010) and global scale (through satellite observations; e.g. Donohue et al., 2013). Experiments and observations revealed that elevated CO2 would increase plant biomass and enhance WUE due to reduced transpiration (because of reduced stomatal conductance). Higher increases in photosynthesis than transpiration increases water-use efficiency. However, as the temperature increases in future climate above the crop's threshold, the rate of evapotranspiration increases, and as a result, water-use efficiency decreases. For a given crop, optimal temperature for evapotranspiration differs from the optimal temperature for photosynthesis (Bhattacharya, 2019). The CO2 fertilization effect amplifies photosynthetic CO2 fixation. However, as the temperatures cross a threshold, leaf photosynthesis starts to decline.
The change in irrigated (Figure 8(I)) and rainfed (Figure 8(II)) rice yield is compared for SSP2-4.5 and SSP5-8.5 CO2 concentration with 2005 CO2 levels (∼378 ppm; average for 1995–2014). For the early 21st century (the 2030s), under SSP2-4.5 (∼443 ppm) and SSP5-8.5 (∼455 ppm), if not for CO2 fertilization, the average yield could potentially further reduce by 5%. In the 2050s, yield increases by 5% and 10% due to CO2 increase under SSP2-4.5 (∼512 ppm) and SSP5-8.5 (∼572 ppm), respectively. By the end of the century, CO2 fertilization reduces the adverse impact on yield by 10% and 25% under SSP2-4.5 (∼599 ppm) and SSP5-8.5 (∼1,065 ppm), respectively.
Comparing CO2 fertilization effect (percentage change in yield) from historical in irrigated (I) and rainfed rice (II) for mid-season planting. (a, e, and i) Subfigures I and II show rice yield for transient CO2 concertation and climate of SSP2-4.5, (b, f, and j) 2005 CO2 concertation and climate of SSP2-4.5, (c, g, and k) transient CO2 concertation and climate of SSP5-8.5, and (d, h, and l) 2005 CO2 concertation and climate of SSP5-8.5 for 2026–2035 (first and fourth row), 2046–2055 (second and fifth row), and 2090–2099 (third and sixth row). Overlaid black dots represent model agreement (75% of models) on sign of change. Black contours show inter-model standard deviation of 16 CMIP6 general circulation models.

The CO2 fertilization effect on rainfed rice is not uniform like for irrigated rice over the study region. CO2 fertilization for the semi-arid western region is higher compared to sub-humid eastern regions of the state. For the 2030s, the positive effects are about 5% for both SSPs. In the 2050s, the positive effects are 10%–15% over the western region and 10% for the eastern region. In the 2090s, the positive effect of CO2 fertilization is higher in western parts (20% (SSP2-4.5), 30% (SSP5-8.5)) than in eastern parts (15% (SSP2-4.5), 20%–25% (SSP5-8.5)) of the state. The results show that increased CO2 increases rice productivity for both rainfed and irrigated conditions. However, the combination of increased rainfall and CO2 levels seems to be more beneficial for rainfed rice as compared to irrigated rice and exhibits spatial variations for different AEZ climates.
4 Summary
Temperature and rainfall are projected to increase over Uttar Pradesh under global warming associated with increased CO2 concentrations. Projections from CERES-Rice show that irrigated and rainfed rice yield increases with increasing CO2 (see Section 20). However, the overall impact on yield due to the associated increase in temperature is detrimental for irrigated conditions. Our analysis shows that seasonal daily average maximum temperatures are already above 32°C (above optimal) in most of the AEZs of Uttar Pradesh, and the projected temperature increases further, which negates the positive effects of CO2 fertilization. On the other hand, for rainfed conditions, CO2 fertilization combined with increased rainfall compensates for the adverse impacts of increased temperatures in rain deficit regions of the state. Increased CO2 reduces stomatal conductance, and increased rainfall reduces the vapor pressure deficit, reducing crop water demand in irrigated and rainfed rice. As a result, WUE is projected to increase for rainfed and irrigated conditions under higher CO2 concentrations. The higher WUE results from the increased efficiency of photosynthesis (hence more biomass accumulation) than crop water losses through ET. Although WUE increases in the 2030s and the 2050s under both SSPs, its magnitude decreases in SSP2-4.5 and becomes negative in SSP5-8.5 by the 2090s because the CO2 fertilization effect diminishes with increasing temperatures.
In Figure 9, percentage changes (averaged for 16 GCMs, 3 planting dates, 4 rice varieties, and 342 grids) along with range in GCM uncertainty (in square brackets) over Uttar Pradesh are shown for rainfed and irrigated conditions for each future period under both SSPs. We found in our analysis that under SSP2-4.5, in the 2030s, with an increase in CO2 (18%), rainfall, Tmax, and Tmin increase by 6%, 0.5°C, and 1°C, respectively, leading to a reduction of 2% in LGP over Uttar Pradesh (see Figures 5 and 6). For irrigated rice, ET (−6%), irrigation (−10%), and yield (−2%) decrease with an increase in WUE (4%). For rainfed rice, ET (−4%) decreases with an increase in yield (1.5%) and WUE (6%). Under SSP5-8.5, for the 2030s, changes are similar to that of SSP2-4.5 but with a higher magnitude.
Average percentage changes in Tmax, Tmin, rainfall, CO2, length of growing period, ET, irrigation (IR), yield (YD), and water use efficiency for the 2030s, 2050s, and 2090s under SSP2-4.5 and SSP5-8.5 over Uttar Pradesh. Adjacent to mean percentage change are range of general circulation model uncertainties in Crop Estimation through Resource and Environment Synthesis-Rice outputs.

In the 2050s, temperature, rainfall, and CO2 are further increased, with a higher magnitude of changes under SSP5-8.5. The increase in temperature leads to a higher decrease in LGP under SSP2-4.5 (−4%) and SSP5-8.5 (−5%) compared to the 2030s. For rainfed rice, the increase in yield is below 1%, WUE is 5%, and the decrease in ET is around −4% under both SSPs. For irrigated rice ET, irrigation and yield decrease further under both SSPs. The increase in ET (3%) under SSP2-4.5 is reduced in comparison to the 2030s and remains the same for SSP5-8.5 (4%).
By the 2090s, under SSP2-4.5, rainfall, Tmax, Tmin, and CO2 increase by 11%, 2.5°C, 3.5°C, and 48%, respectively, and LGP decreases by −7%. As a result of interaction between temperature, rainfall and CO2, ET, irrigation, and yield decrease by −4%, −18%, and −4%, respectively, and WUE increases by 1.3%. For irrigated rice, the yield and WUE increase by 1.7% and 4%, respectively, and ET decreases by −1.5%. Under SSP5-8.5, the changes in Tmax (3.4°C), Tmin (4.5°C), rainfall (20%), CO2 (182%), and LGP (−11%) are intensified. These changes lead to a higher decline in ET (−5%), IR (−19%), YD (−6.5%), and WUE (−3.3%) for irrigated rice. There is a marginal decline in rainfed yield (−0.1%) with increasing WUE (1.5%) and decreasing ET (−2%).
The highest Tmax and Tmin values in the historical period are for early planting and lowest for late planting. The increase in Tmax in future is highest in early planting, however, the increase in Tmin is highest for late planting, and the changes in LGP are dominated by Tmin changes, hence, showing the highest shortening of LGP in late planting. The changes in LGP are the same for irrigated and rainfed rice because it depends on temperature and photoperiod (day length and solar radiation). Historical irrigated rice yield is highest for early planting and lowest for late planting, with the highest projected reduction in late planting yield. The historical Tmax and Tmin are lowest for late planting and highest in early planting, however, the increase in Tmin (night-time temperature) under climate change in the early planting is lower than for late planting. Hence, the increase in night-time temperature for late planting is higher compared to other planting dates. Rice plants are highly susceptible to increase in night-time temperatures, and this may be another reason for the higher decline of irrigated rice yields in late planting. Therefore, early planting for irrigated rice is projected to become comparatively beneficial in the future. Rainfed rice ET is lowest in the early planting season; however, if we see ET for irrigated conditions (no water deficit), the value of crop ET is comparable for all the planting seasons. That means the water deficit is highest in the early season for rainfed rice leading to the lowest rainfed rice yield compared to other planting dates. Historical seasonal rainfall is lowest in the late planting season, however, the projected positive changes in rainfall are highest for late planting leading to a reduced water deficit for rainfed rice. Hence, the most significant positive changes in rainfed yield are projected for late planting.
The CO2 fertilization effect for rainfed rice is not uniform like it is for irrigated rice. The positive impacts of elevated CO2 are highest in semi-arid and dry sub-humid AEZs as compared to sub-humid AEZs. Overall, the rainfed rice yield is projected to increase in rain deficit western parts of Uttar Pradesh, with the highest positive increase in yield for late planting (15 July). Irrigated rice yield is projected to decrease monotonically with an intensified decrease by the 2090s, with the highest decrease associated with the late planting season.
5 Conclusions
Overall, both SSPs indicate a projected decrease in rice production in Uttar Pradesh. Approximately 60% of rice farms are irrigated, and the expansion of irrigated land is ongoing. However, with the anticipated decline in rice yields and the population growth (approximately 40 million each decade), the food security of Uttar Pradesh and regions that rely on the state's export will face a severe threat. We found that the primary cause for the decrease in the yield of irrigated rice is due to the rising temperatures. Planting in the early season can reduce the negative impacts on yields. The negative impacts can also be mitigated using rice varieties that can tolerate high temperatures. A further examination of climate intervention strategies, such as solar radiation management (J. Singh et al., 2020), could reveal whether yield losses can be reduced or avoided. This study also projects a future decrease in irrigation requirements. Nevertheless, the anticipated expansion of irrigated rice cultivation will likely intensify the demand for groundwater resources, the primary irrigation source in the state (Zaveri et al., 2016). Despite the reduced need for irrigation, a discrepancy between the irrigation supply and demand could emerge, potentially leading to increased yield losses for irrigated rice. The findings of this study are relevant not only to other regions of India but also to other parts of the world with a current temperature close to or above the optimal range for irrigated rice cultivation. While we have attempted to minimize uncertainties by selecting climate data from 20 GCMs and implementing thorough bias correction and downscaling, the possibility of error remains. The diverse crop management practices among Uttar Pradesh's smallholder farmers add complexity, making it difficult to capture every scenario within the model. Moreover, our study is based on a single crop model lacking plant-atmosphere and grid-to-grid interactions. Although we incorporated various GCM outputs, rice varieties, and management practices, future studies should consider using multiple crop models to bolster the robustness of the findings.
Acknowledgments
Indian Institute of Technology Delhi (IITD) and the Centre for Atmospheric Sciences are gratefully acknowledged for providing research scholarship and access to the Hybrid High-Performance Computing Facility for conducting this research. We thank Prof. S. K. Mishra for valuable discussions. Jyoti Singh, Alan Robock, and Lili Xia are supported by US National Science Foundation Grants AGS-2017113 and ENG-2028541, and by SilverLining's Safe Climate Research Initiative. We acknowledge India Meteorological Department (IMD, https://cdsp.imdpune.gov.in), Coupled Model Intercomparison Project (CMIP, https://esgf-node.llnl.gov/projects/cmip6/), and the NASA Atmospheric Science Data Center (https://power.larc.nasa.gov/) for making the data available.
Appendix A: Creating DSSAT Treatment Options for (Uttar Pradesh, India) Provided by Agromet, IMD
*Cultivar.
! Genotype data (Table A1).
| VAR# | VAR-NAME | ECO# | P1 | P2R | P5 | P2O | G1 | G2 | G3 | G4 | PHINT |
|---|---|---|---|---|---|---|---|---|---|---|---|
| UP0201 | SARJOO52 | .IB0001 | 450 | 170 | 365 | 12.2 | 47 | 0.0238 | 1 | 0.80 | 83 |
| UP0202 | NDR-97 | .IB0001 | 385 | 085 | 448 | 11.9 | 52 | 0.0220 | 1 | 1.00 | 83 |
| UP0203 | NDR-359 | .IB0001 | 520 | 140 | 470 | 12.0 | 52 | 0.0245 | 1 | 1.00 | 83 |
| UP0204 | PANT-14 | .IB0001 | 620 | 160 | 300 | 12.0 | 45 | 0.0200 | 1 | 0.80 | 83 |
- Note: Definition of rice genetic coefficients can be found in Table S4 of the Supporting Information S1.
*Fertilizer.
Fertilizer-amount and time 120:60:60—N:P:K kg/ha.
N-at Basal (60 kg), Equal Split-Active Tillering and Panicle Initiation (30 kg).
Panicle Initiation (PI) is the start of the reproductive phase of rice development. It is when the actual panicle or head begins to form in the base of the shoots or stems, just above the soil surface.
A1 Inorganic Fertilizer in DSSAT Experiment File
| *FERTILIZERS (INORGANIC) | |||||||||||
| @F | FDATE | FMCD | FACD | FDEP | FAMN | FAMP | FAMK | FAMC | FAMO | FOCD | FERNAME |
| 1 | 0 | FE005 | AP002 | 5 | 40 | −99 | −99 | −99 | −99 | −99 | −99 |
| 1 | 21 | FE005 | AP002 | 5 | 40 | −99 | −99 | −99 | −99 | −99 | −99 |
| 1 | 43 | FE005 | AP002 | 5 | 40 | −99 | −99 | −99 | −99 | −99 | −99 |
A2 Definition of the Fertilizers in DSSAT
-
FE016 Potassium chloride (MOP is Muriate of Potash)
-
FE006 Di ammonium phosphate (DAP) (*DYE is basically the term for DAP)
-
FE005 Urea
-
FE014 Triple super phosphate (TSP)
-
P2O5 is phosphoric acid.
-
Nitrogen (N), phosphorus (P2O5), and potassium (K2O)
-
FE015 Liquid phosphoric acid (P2O5)
What is Your Reaction?
 Like
0
Like
0
 Dislike
0
Dislike
0
 Love
0
Love
0
 Funny
0
Funny
0
 Angry
0
Angry
0
 Sad
0
Sad
0
 Wow
0
Wow
0