


New tool maps sea-level rise, flooding in Maryland’s coastal areas – Baltimore Fishbowl
Report on the Maryland Coastal Flood Explorer and its Contribution to Sustainable Development Goals
Introduction: A New Tool for Climate Resilience
The Maryland Department of Natural Resources (DNR) has launched the Maryland Coastal Flood Explorer, a digital mapping tool designed to enhance public knowledge and preparedness for coastal flooding. This initiative directly supports the United Nations Sustainable Development Goals (SDGs), particularly SDG 11 (Sustainable Cities and Communities) and SDG 13 (Climate Action), by providing critical data to build resilience against climate-related hazards.
Natalie Snider, Director of DNR’s Watershed and Climate Services, emphasized that understanding flood risk is the foundational step toward building resilience. The tool empowers citizens and communities to take informed action, from securing individual properties to implementing large-scale, nature-based solutions, thereby advancing the goal of creating safer and more sustainable human settlements.
Tool Capabilities and Alignment with SDG 9: Industry, Innovation, and Infrastructure
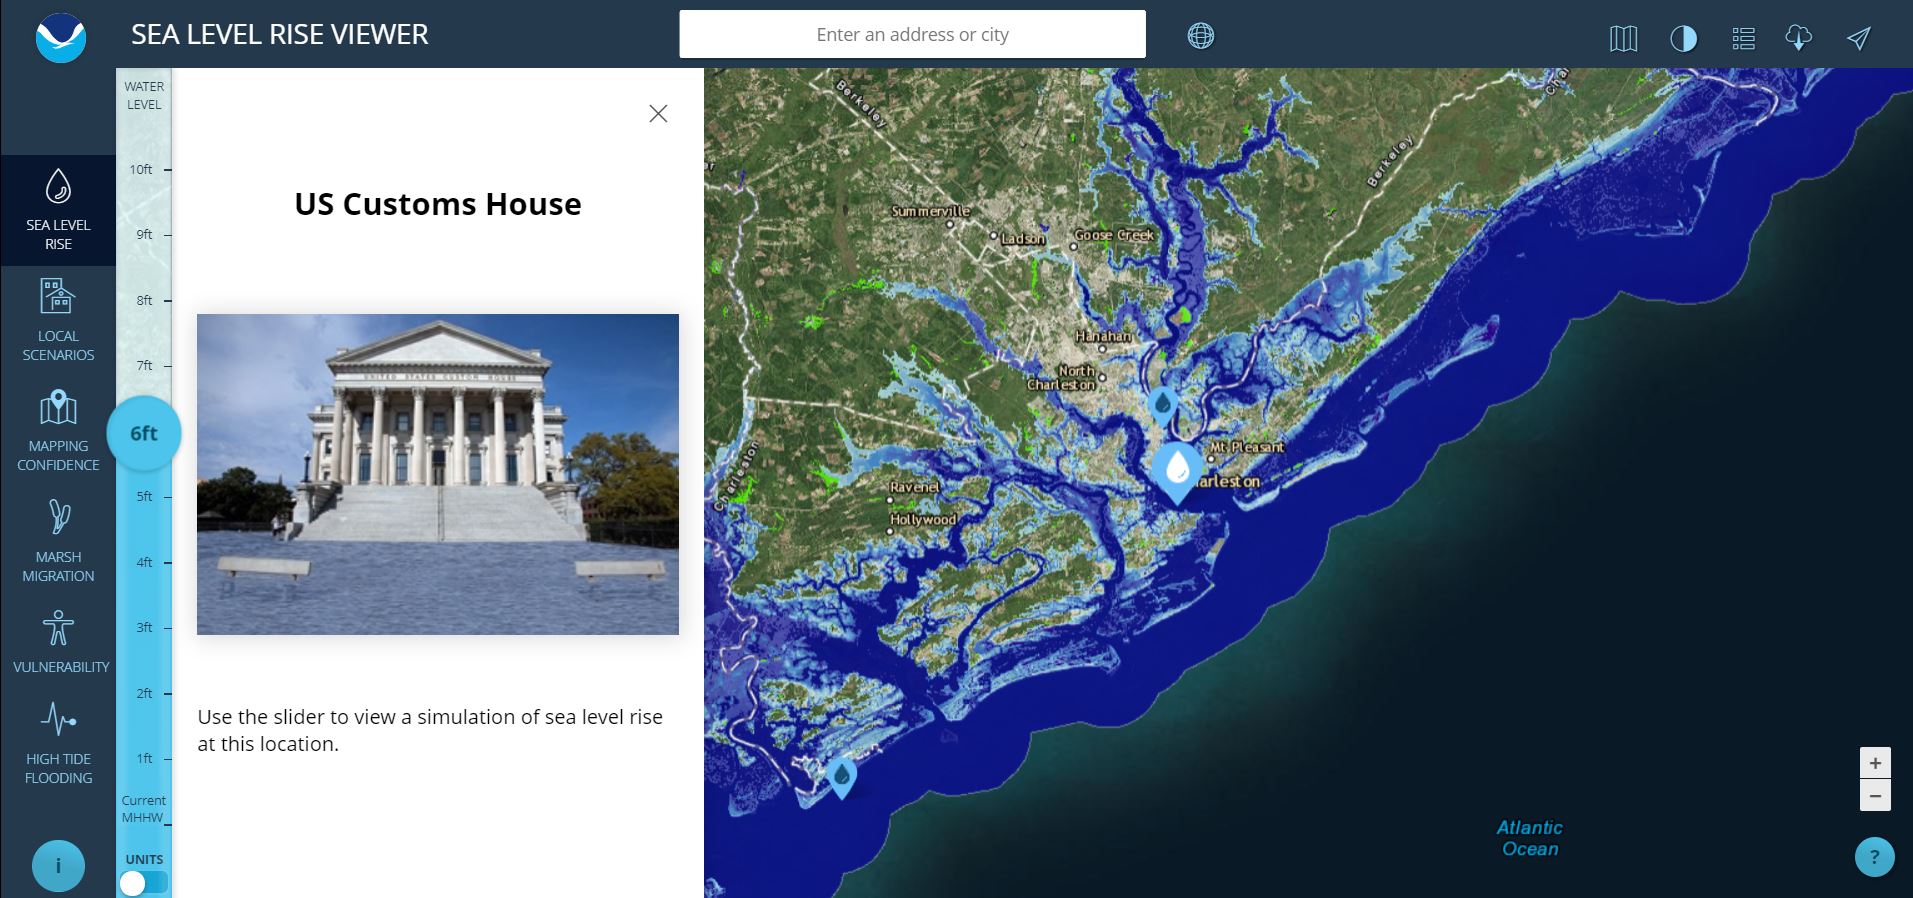
The Maryland Coastal Flood Explorer is an innovative platform that leverages technology to disseminate complex scientific data to the public, a key aspect of SDG 9. Its primary functions allow users to visualize multiple layers of flood-risk data for any coastal address in the state.
- Historic Flood Data: Users can access records of past flooding events, including the date and water level in feet.
- Current and Future High Tide Flooding: The tool provides visualizations of present-day high tide flooding scenarios.
- Sea-Level Rise Projections: It offers long-term projections for sea-level rise by decade, from 2030 through 2120.
Amanda Pollack of the Center for Watershed Protection highlighted the tool’s unique value in combining historic event data with future sea-level rise scenarios, setting it apart as a comprehensive resource for local-level impact assessment.
Contribution to SDG 13: Climate Action
The tool is a direct response to the escalating threats of climate change. By providing clear, accessible data on sea-level rise and increased flooding frequency, it strengthens resilience and adaptive capacity to climate-related hazards as mandated by SDG 13. The urgency of this action is underscored by data from NASA, which indicates that the average number of minor flood days per year in Annapolis has quadrupled since the 1970s. The Flood Explorer equips stakeholders with the necessary information to proactively address these climate impacts.
Fostering SDG 11: Sustainable Cities and Communities
The DNR envisions the Flood Explorer as a vital instrument for local governments and community planners working to achieve SDG 11. The tool is designed to make cities and human settlements inclusive, safe, resilient, and sustainable by supporting several key activities:
- Updating community plans for flooding and hazard mitigation.
- Identifying and prioritizing areas for adaptation and mitigation projects, including nature-based solutions like living shorelines which also support SDG 14 (Life Below Water).
- Conducting public outreach and education to raise awareness about the local impacts of flooding and sea-level rise.
This visual, interactive platform serves as a tremendous asset for communities, enabling them to assess impacts at a granular level and plan for a more resilient future.
Analysis of Sustainable Development Goals in the Article
1. Which SDGs are addressed or connected to the issues highlighted in the article?
-
SDG 13: Climate Action
- The article’s central theme is addressing the impacts of climate change, specifically sea-level rise and increased coastal flooding. It discusses a tool designed to help communities understand and adapt to these climate-related hazards. The stated goal is to “build resilience” against these threats.
-
SDG 11: Sustainable Cities and Communities
- The article focuses on making coastal communities in Maryland safer and more resilient. It highlights that the tool is intended to help “communities to update their plans for flooding and hazard mitigation” and make human settlements better prepared for water-related disasters.
-
SDG 9: Industry, Innovation, and Infrastructure
- The “Maryland Coastal Flood Explorer” is presented as a technological innovation (“a new mapping tool”) that provides crucial data for planning. The article also implicitly refers to building resilient infrastructure through “adaptation and mitigation projects” and securing homes with measures like “a living shoreline.”
-
SDG 14: Life Below Water
- The article mentions the use of “living shoreline” and “nature-based solutions” as methods for building resilience. These approaches directly involve the protection and restoration of coastal and marine ecosystems to mitigate flooding impacts.
2. What specific targets under those SDGs can be identified based on the article’s content?
-
Target 13.1: Strengthen resilience and adaptive capacity to climate-related hazards and natural disasters in all countries.
- The article directly supports this target by describing the tool’s purpose. A DNR official states, “Understanding our flood risk is the first step to building resilience,” and the tool is designed to help communities “identify areas to prioritize for adaptation and mitigation projects.”
-
Target 13.3: Improve education, awareness-raising and human and institutional capacity on climate change mitigation, adaptation, impact reduction and early warning.
- The tool serves as an educational and awareness-raising platform. The article notes its purpose is to “conduct outreach and education about flooding and sea level rise” and that it “puts the latest coastal flood science directly into the hands of the public.”
-
Target 11.5: By 2030, significantly reduce the number of deaths and the number of people affected and substantially decrease the direct economic losses…caused by disasters, including water-related disasters…
- By enabling residents and communities to visualize and plan for current and future flooding, the tool directly contributes to mitigating the human and economic impact of these water-related disasters.
-
Target 11.b: By 2020, substantially increase the number of cities and human settlements adopting and implementing integrated policies and plans towards…adaptation to climate change, resilience to disasters…
- The article explicitly states that “DNR envisions the tool helping communities to update their plans for flooding and hazard mitigation,” which aligns perfectly with this target of implementing plans for climate adaptation and disaster resilience.
-
Target 14.2: By 2020, sustainably manage and protect marine and coastal ecosystems to avoid significant adverse impacts, including by strengthening their resilience…
- The mention of building resilience through “a living shoreline” and “nature-based solutions” directly relates to this target, as these are methods that protect and leverage coastal ecosystems to defend communities.
3. Are there any indicators mentioned or implied in the article that can be used to measure progress towards the identified targets?
- Yes, several indicators are mentioned or can be directly inferred from the article’s text.
-
Directly Mentioned Indicators: The article specifies the exact data the tool visualizes, which serve as indicators of climate risk. These include:
- “historic flooding events in the area by date and amount of water in feet”
- “current and future high tide flooding in feet”
- “projected sea level rise by decade from the year 2030 through 2120”
- The article also cites a specific risk metric: “In Annapolis, the average number of minor flood days per year has quadrupled since the 1970s.”
-
Implied Indicators: The article implies that progress can be measured by the adoption and application of the tool and related solutions. These include:
- The number of communities that use the tool to “update their plans for flooding and hazard mitigation.”
- The number of “adaptation and mitigation projects” that are identified and implemented based on the tool’s data.
- The number and extent of “living shoreline” or “nature-based solutions” projects implemented by communities.
4. Summary of SDGs, Targets, and Indicators
| SDGs | Targets | Indicators |
|---|---|---|
| SDG 13: Climate Action | 13.1: Strengthen resilience and adaptive capacity to climate-related hazards.
13.3: Improve education, awareness-raising and human and institutional capacity on climate change adaptation. |
– Projected sea level rise by decade. – Data on current and future high tide flooding in feet. – Number of communities using the tool to create adaptation plans. – Public usage of the Flood Explorer tool as a measure of awareness. |
| SDG 11: Sustainable Cities and Communities | 11.5: Significantly reduce the number of people affected by water-related disasters.
11.b: Increase the number of cities implementing integrated policies and plans for resilience to disasters. |
– Data on historic flooding events by date and water amount. – Average number of minor flood days per year. – Number of communities updating hazard mitigation plans using the tool. |
| SDG 9: Industry, Innovation, and Infrastructure | 9.1: Develop quality, reliable, sustainable and resilient infrastructure. | – The existence of the “Maryland Coastal Flood Explorer” as a data innovation. – Number of “resilience projects” identified and implemented. |
| SDG 14: Life Below Water | 14.2: Sustainably manage and protect marine and coastal ecosystems to strengthen their resilience. | – Number or extent of “living shoreline” projects implemented. – Number of “nature-based solutions” adopted by communities. |
Source: baltimorefishbowl.com

What is Your Reaction?
 Like
0
Like
0
 Dislike
0
Dislike
0
 Love
0
Love
0
 Funny
0
Funny
0
 Angry
0
Angry
0
 Sad
0
Sad
0
 Wow
0
Wow
0