


The carbon hoofprint of cities is shaped by geography and production in the livestock supply chain – Nature
Report on the Carbon Hoofprint of Urban Meat Consumption in the United States
Introduction: Aligning Urban Food Systems with Sustainable Development Goals
Urban centers are significant drivers of resource consumption, with food systems representing a substantial portion of their environmental footprint. The production of meat for urban populations, largely occurring in rural areas, creates complex and often opaque supply chains. This opacity hinders efforts to achieve several Sustainable Development Goals (SDGs), particularly SDG 11 (Sustainable Cities and Communities), SDG 12 (Responsible Consumption and Production), and SDG 13 (Climate Action). This report summarizes a study that quantifies the greenhouse gas (GHG) emissions from beef, chicken, and pork consumption—termed the ‘carbon hoofprint’—for 3,531 cities in the contiguous USA. By mapping these transboundary impacts, this research provides a critical tool for cities to develop policies that advance a sustainable and climate-resilient future.
Key Findings: Quantifying the Urban Carbon Hoofprint
The study utilizes a combination of supply chain models and spatial carbon accounting to connect urban consumption with specific rural production impacts. This granular approach moves beyond national averages, providing a more accurate assessment necessary for targeted climate action.
Overall Climate Impact
- The total carbon hoofprint of all U.S. cities from beef, chicken, and pork consumption is 329 MtCO2e annually.
- This figure is equivalent to the total emissions from at-home fossil fuel combustion in the USA, highlighting its significance in the national carbon budget and the urgent need for mitigation to meet SDG 13 (Climate Action) targets.
- For many cities, particularly those with milder climates or low-carbon energy grids, the carbon hoofprint rivals or exceeds emissions from household energy use, making it a critical and often overlooked lever for decarbonization.
Per Capita Emissions and Regional Disparities
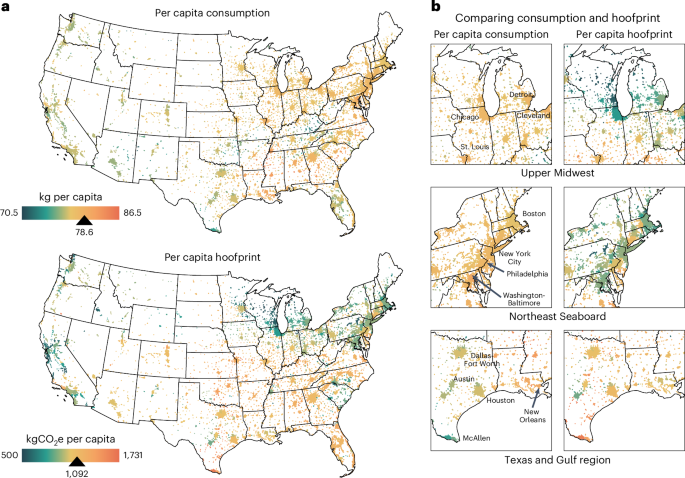
- Despite relatively consistent meat consumption levels, per capita hoofprints show significant variation across cities, ranging from 500 to 1,731 kgCO2e.
- This variation is not primarily driven by consumption volume but by the GHG intensity of the meat’s production region. This underscores the importance of promoting sustainable agricultural practices in line with SDG 2 (Zero Hunger), which calls for sustainable food production systems, and SDG 12 (Responsible Consumption and Production).
- Beef is the dominant contributor to the hoofprint, accounting for an average of 73% of emissions, reinforcing its high environmental intensity.
Supply Chain Analysis: Mapping Urban-Rural Linkages for Sustainability
The “Meatshed” Concept
The report maps the complete supply geography, or “meatshed,” for urban meat consumption, tracing the flow of commodities from animal feed production to livestock raising, processing, and final consumption. This analysis reveals the extensive and geographically dispersed nature of urban supply chains.
- A single city’s meatshed can encompass hundreds of counties, spanning thousands of kilometers and creating complex interdependencies between urban consumers and rural producers.
- This detailed mapping makes the “teleconnections” between urban consumption and rural environmental impacts tangible, providing a basis for fostering urban-rural partnerships as envisioned in SDG 17 (Partnerships for the Goals).
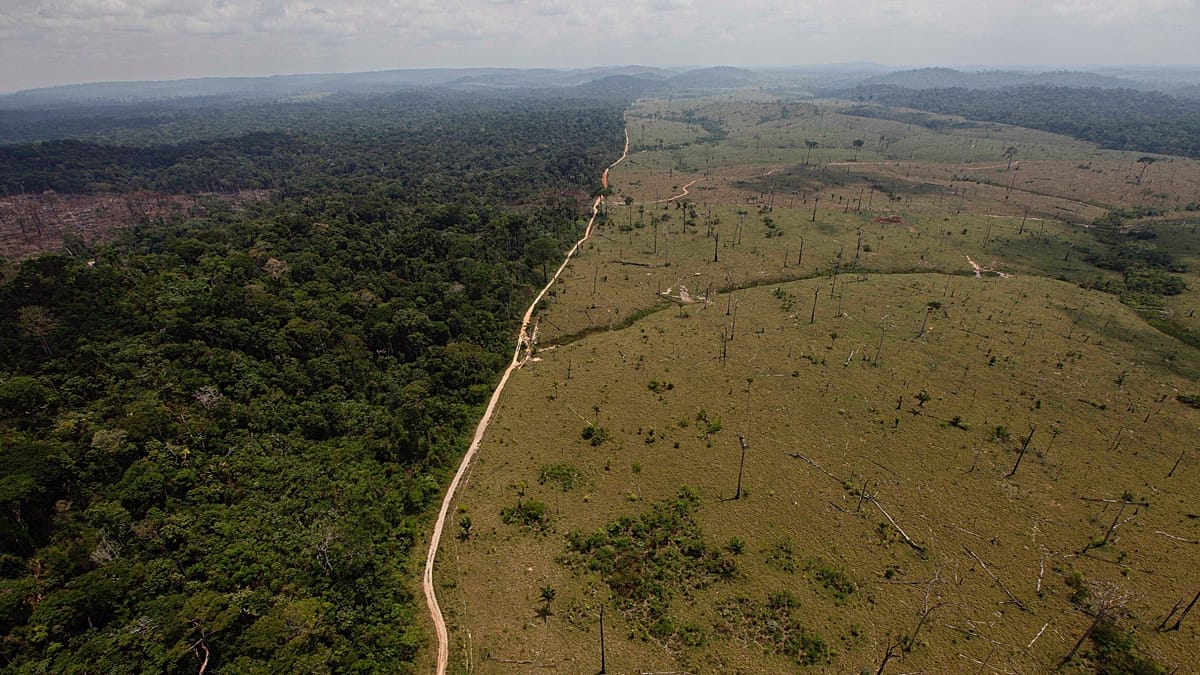
- The GHG intensity of production varies significantly within these meatsheds, influenced by factors like feed composition, land-use change (relevant to SDG 15: Life on Land), and manure management practices.
Policy Implications and Pathways to Achieving the SDGs
The findings highlight several actionable strategies for cities to reduce their carbon hoofprint and contribute to global sustainability targets. These strategies focus on both demand-side and supply-side interventions.
Demand-Side Strategies for Responsible Consumption (SDG 12)
Cities can significantly reduce their environmental impact through policies that encourage more sustainable consumption patterns. The report models four key scenarios:
- Reducing Food Waste: Halving edible meat waste at the retail and consumer levels could reduce the total hoofprint by 16%. This directly addresses SDG Target 12.3, which aims to halve per capita global food waste.
- Dietary Shift (Beef to Pork/Chicken): Substituting 50% of beef consumption with an even split of pork and chicken reduces emissions by 28%.
- Dietary Shift (Beef to Chicken): Substituting 50% of beef consumption with chicken yields the largest reduction, at 33%. These dietary shifts align with goals for responsible consumption (SDG 12), climate action (SDG 13), and have co-benefits for public health (SDG 3: Good Health and Well-being).
- Reducing Overall Consumption: Implementing a “meatless Monday” (a 1/7th reduction) reduces the hoofprint by 14%.
When combined, demand-side measures focusing on waste reduction and dietary shifts away from beef could reduce the total urban carbon hoofprint by up to 51%, demonstrating a powerful, cost-effective tool for urban climate policy.
Supply-Side and Collaborative Strategies (SDG 17)
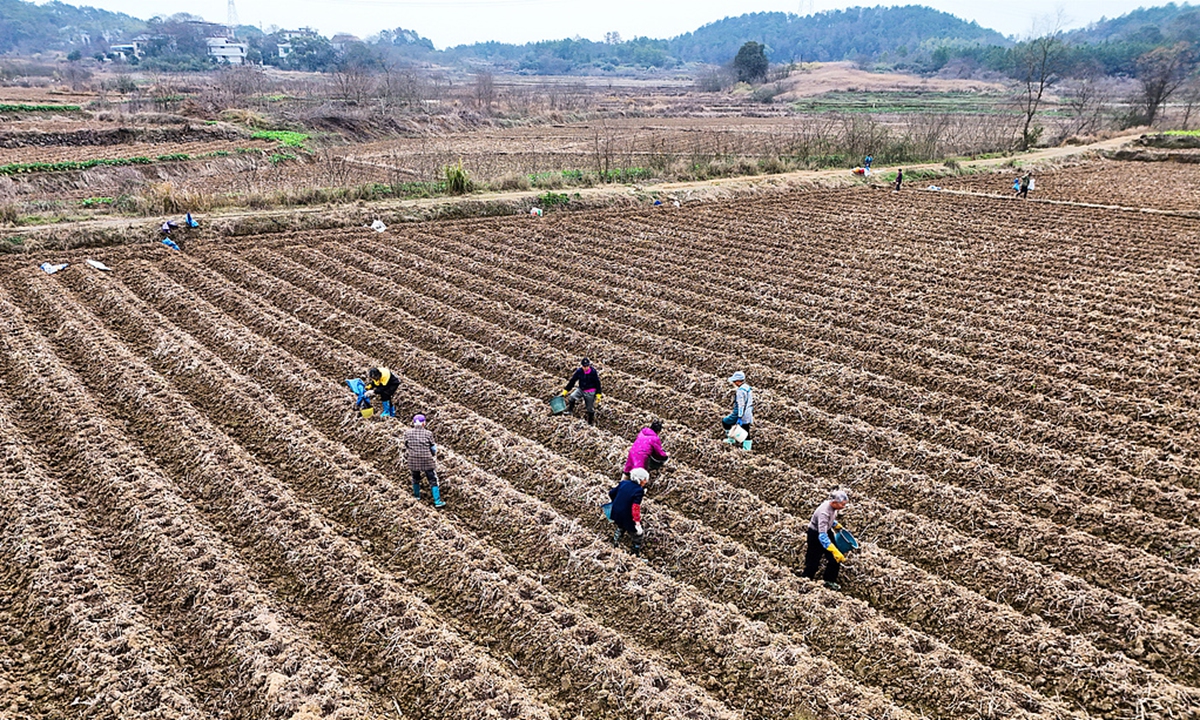
- The spatial analysis of production hotspots allows cities to engage in targeted collaborations with rural communities to promote climate-friendly agricultural practices, such as silvopastoral systems.
- By understanding their specific meatsheds, cities can support and incentivize producers who adopt sustainable methods, creating a virtuous cycle that benefits both urban and rural areas and advances SDG 15 (Life on Land) by reducing pressure on ecosystems.
Conclusion: A Framework for Sustainable Urban Food Systems
This research provides a scalable, high-resolution method for cities to understand and mitigate the transboundary climate impacts of their food consumption. By making the carbon hoofprint visible, it empowers policymakers, citizens, and communities to implement targeted strategies that align with the Sustainable Development Goals. Addressing the environmental impacts of meat consumption requires a dual approach of transforming both production and consumption patterns. This model serves as a foundational tool to map, measure, and mitigate these impacts, fostering the urban-rural collaboration necessary to build sustainable and resilient food systems on an increasingly urbanized planet.
Analysis of Sustainable Development Goals in the Article
1. Which SDGs are addressed or connected to the issues highlighted in the article?
-
SDG 13: Climate Action
The article’s central focus is on quantifying and mitigating greenhouse gas (GHG) emissions resulting from meat production and consumption. It introduces the concept of the “carbon hoofprint” to measure the climate impact of urban meat consumption, directly aligning with the goal of taking urgent action to combat climate change and its impacts.
-
SDG 12: Responsible Consumption and Production
The study extensively discusses consumption patterns, supply chain inefficiencies, and food waste. It analyzes how demand-side measures, such as dietary shifts (from beef to chicken) and reducing food waste, can significantly lower emissions. This directly relates to ensuring sustainable consumption and production patterns.
-
SDG 11: Sustainable Cities and Communities
The research is framed around cities as major centers of consumption. It quantifies the environmental impact of 3,531 US cities, highlighting the “transboundary impacts of cities” on rural environments. The goal is to provide cities with data to create policies that reduce their environmental footprint, making them more sustainable.
-
SDG 2: Zero Hunger
While not the primary focus, the article connects to SDG 2 through its discussion of sustainable food production systems. It analyzes the GHG intensity of different agricultural practices and mentions supply-side strategies like silvopastoral systems to make meat production more sustainable, which is a key component of achieving food security and promoting sustainable agriculture.
2. What specific targets under those SDGs can be identified based on the article’s content?
-
Target 12.3: Halve per capita global food waste
The article directly addresses this target by modeling a scenario where “retailers and consumers halve wastage of edible meat.” It quantifies the potential GHG reduction from this action, showing that halving food waste could reduce the carbon hoofprint by 16%.
-
Target 11.6: Reduce the adverse per capita environmental impact of cities
The study’s primary contribution is the quantification of the “per capita carbon hoofprint” for US cities, which ranges from 500 to 1,731 kgCO2e. By measuring this specific environmental impact, the article provides a basis for cities to monitor and reduce their per capita footprint, directly aligning with this target.
-
Target 13.2: Integrate climate change measures into policies and planning
The article provides a modeling framework and data that can be used by cities to integrate food-system emissions into their climate action plans. It suggests that reducing the hoofprint is a “cost-effective decarbonization lever” and proposes specific policy scenarios (e.g., promoting dietary shifts, reducing waste) for cities to adopt.
-
Target 2.4: Ensure sustainable food production systems
The research analyzes the varying GHG intensities of meat production across different regions, highlighting the need for more sustainable practices. It mentions production-side strategies, such as “silvopastoral systems,” which could reduce the total hoofprint, thereby contributing to more resilient and sustainable agricultural systems.
3. Are there any indicators mentioned or implied in the article that can be used to measure progress towards the identified targets?
-
Carbon Hoofprint (kgCO2e per capita)
This is the central indicator developed in the article to measure the GHG emissions from meat consumption per person in a city. The article provides a baseline range of “500 kgCO2e per capita in Houghton, MI, to 1,731 kgCO2e per capita in Richmond, MO.” This indicator can be used to track progress on reducing the environmental impact of cities (Target 11.6) and overall climate action (SDG 13).
-
Total GHG Emissions from Meat Consumption (MtCO2e)
The article quantifies the aggregate carbon hoofprint for all US cities as “329 MtCO2e.” This total emissions figure serves as a key indicator for measuring the scale of the climate impact from this sector and can be used to monitor the effectiveness of large-scale mitigation policies (Target 13.2).
-
Percentage Reduction in Food Waste
The article explicitly models a scenario to “halve the amount of meat lost (as edible food waste),” which corresponds to a 50% reduction. This percentage is a direct measure for tracking progress towards Target 12.3.
-
GHG Intensity of Meat Production (kgCO2e per kg of meat)
The study highlights that the GHG intensity of production is a critical factor explaining the variation in city hoofprints. It notes that this intensity varies significantly for beef, chicken, and pork across different production regions. This indicator is crucial for measuring improvements in the sustainability of food production systems (Target 2.4).
-
Percentage of Dietary Shift
The scenarios include substituting “half of beef consumption with chicken” (a 50% shift). This metric can be used as an indicator to measure changes in consumption patterns, which is relevant to achieving responsible consumption goals (SDG 12).
4. Table of SDGs, Targets, and Indicators
| SDGs | Targets | Indicators |
|---|---|---|
| SDG 12: Responsible Consumption and Production | Target 12.3: By 2030, halve per capita global food waste at the retail and consumer levels. | Percentage reduction in edible meat waste (The article models a 50% reduction). |
| SDG 11: Sustainable Cities and Communities | Target 11.6: By 2030, reduce the adverse per capita environmental impact of cities. | Per capita carbon hoofprint (measured in kgCO2e per capita, with a range of 500-1,731 kgCO2e identified). |
| SDG 13: Climate Action | Target 13.2: Integrate climate change measures into national policies, strategies and planning. | Total carbon hoofprint of cities (quantified as 329 MtCO2e for the contiguous USA). |
| SDG 2: Zero Hunger | Target 2.4: By 2030, ensure sustainable food production systems and implement resilient agricultural practices. | GHG intensity of meat production (measured in kgCO2e per kg of meat, with significant variation noted across production regions). |
| SDG 12: Responsible Consumption and Production | Target 12.2: By 2030, achieve the sustainable management and efficient use of natural resources. | Percentage of dietary shift from high-intensity to low-intensity meats (The article models a 50% substitution of beef with chicken). |
Source: nature.com
What is Your Reaction?
 Like
0
Like
0
 Dislike
0
Dislike
0
 Love
0
Love
0
 Funny
0
Funny
0
 Angry
0
Angry
0
 Sad
0
Sad
0
 Wow
0
Wow
0