


Watershed Upkeep in Chile
This study explores how changes in urban wetland cover and storm intensity affect flooding in Valdivia, Chile. They analyzed scenarios of wetland loss and increased rainfall volume, finding that flood volume and duration increased with wetland loss and rainfall, suggesting the need for improved stormwater management despite wetland conservation efforts.
Cities are growing and the decisions that cities make about what they will either build in or exclude from their environments may put them at greater risk of flooding. Decisions to destroy wetlands to make room for new developments may be major causes of this greater flood risk. Flood risk in cities may also increase as the climate continues to change. Flooding severity might be reduced by taking advantage of or restoring natural wetlands, or even by constructing new wetlands. In Valdivia, Chile, a city with extensive wetland cover, we had city employees and community members create positive scenarios of development in Valdivia through the year 2080. Additionally, we used climate models to estimate rainfall volume during an extreme storm event in the year 2080. We modeled how the scenarios would change the wetlands in the city, and how those changes might in turn change the amount of flooding the city experiences under climate change. We found that flooding was worse in scenarios where more wetlands were lost than in scenarios where fewer wetlands were lost. We find clear benefits in conserving, restoring, and/or constructing wetlands to reduce flooding now and into the future.
Abstract
The relationship between cities and wetland cover varies across the globe, with some cities converting wetlands to low- and high-density urban cover and others preserving, conserving, or restoring wetlands, or constructing new ones. However, the scientific literature lacks studies relating changes in systemic flood risk in an urban stormwater management systems to changes in wetland cover. Furthermore, whether and how such relationships are affected by changing storm intensity under climate change is unknown. We present a case study on the effects of changes in urban wetland extent and storm intensity on flooding in an urban drainage system in Valdivia, Chile, under several co-produced future scenarios and historical trends of development. We used data derived from stakeholder workshops and historical landcover to determine four plausible scenarios of urban development, plus one business-as-usual scenario, in Valdivia through the year 2080. Additionally, we used historical precipitation data and downscaled climate data to estimate event rainfall from extreme storms in the year 2080. We found that system flood volume and time the system was flooded increased with increasing wetland loss and rainfall volume. Mean rate and hour of peak discharge were unaffected by wetland loss. Infiltration's relative role in reducing flooding diminished as wetland loss increased. Cities may still experience dangerous and/or unacceptable flooding even with extensive wetland coverage and will likely need to pair conservation with additional improvements in their stormwater management systems and contributing watersheds.
Key Points
-
System flood volume increased with inland urban wetland loss under present-day and future extreme storms
-
The contribution of infiltration to flood mitigation decreased with wetland loss and overall wetland area
-
Visions of urban development created in stakeholder workshops resulted in lower flood risk than default development pathways
Plain Language Summary
Cities are growing and the decisions that cities make about what they will either build in or exclude from their environments may put them at greater risk of flooding. Decisions to destroy wetlands to make room for new developments may be major causes of this greater flood risk. Flood risk in cities may also increase as the climate continues to change. Flooding severity might be reduced by taking advantage of or restoring natural wetlands, or even by constructing new wetlands. In Valdivia, Chile, a city with extensive wetland cover, we had city employees and community members create positive scenarios of development in Valdivia through the year 2080. Additionally, we used climate models to estimate rainfall volume during an extreme storm event in the year 2080. We modeled how the scenarios would change the wetlands in the city, and how those changes might in turn change the amount of flooding the city experiences under climate change. We found that flooding was worse in scenarios where more wetlands were lost than in scenarios where fewer wetlands were lost. We find clear benefits in conserving, restoring, and/or constructing wetlands to reduce flooding now and into the future.
1 Introduction
Pluvial flooding is a major concern for residents of cities. Pluvial flooding is surface ponding or overland flow that occurs when rates of precipitation exceed the capacity of drainage systems and/or surfaces to remove it (Falconer et al., 2009). Pluvial floods can lead to loss of life, damage to property, and disruption of transportation networks (Chang et al., 2010; Douglas et al., 2010; Falconer et al., 2009; Yin et al., 2016). As a physical phenomenon, pluvial flooding results from interactions between rate of precipitation, urban stormwater management practices, and biophysical characteristics of the urban and peri-urban landscape (Westra et al., 2014). In many cities, one or all three of these interacting factors are changing in ways that may increase pluvial flood frequency, area, and damage. Even subdaily extreme rainfall has become more frequent and intense due to anthropogenic climate change (Westra et al., 2014; Wuebbles et al., 2014). Cities have historically prioritized mitigating the risks of fluvial and coastal flooding over pluvial flooding (Guerreiro et al., 2017). However, in recognition of pluvial flooding has in recent years garnered the attention of researchers and planners because understanding how to mitigate its causes and effects in urban areas is underdeveloped (Rosenzweig et al., 2018).
The conservation, restoration, and construction of wetlands have all been suggested as measures to mitigate the risk of various forms of flooding in many different ecosystem types. The ability of coastal wetlands to reduce coastal flooding has been explored in depth and in a diverse array of ecosystems (Arkema et al., 2013; Narayan et al., 2017; Nicholls et al., 1999; Rojas et al., 2019; Van Coppenolle & Temmerman, 2019, 2020). The effects of wetland presence on riverine flooding have received notable attention as well. Neri-Flores et al. (2019) modeled the capacity of wetland preservation to reduce riverine flooding caused by hurricane storm surges. Pomeroy et al. (2014) modeled how preserved inland wetlands can reduce riverine flooding driven by snowmelt. Yang et al. (2010) modeled how the restoration of wetlands in a Canadian prairie watershed can reduce peak river discharge and flooding. In a review of 28 modeling and empirical studies of the effects of wetlands on flow regimes in rivers, Kadykalo and Findlay (2016) found that wetlands generally reduced the frequency and magnitude of flooding, with one exception in a forest wetland system (Lundin, 1994). Historically, attributions of the positive water regulation services of wetlands have their bases in studies in non-urban riverine or coastal wetlands (Costanza et al., 1997; Millennium Ecosystem Assessment, 2005).
Only recently has research explored the abilities of inland urban wetlands to reduce urban pluvial flood risk, or how the incorporation of wetlands in an urban stormwater management system might alter the system's performance. The theory and practice of inland wetland restoration and construction in urban areas to reduce pluvial flood risk is relatively new in academia and among stormwater managers (Chan et al., 2018; Elmqvist et al., 2015), and modeling and empirical studies of the effects of wetland restoration and construction in urban areas are rare. Some cities have added inland wetlands to their portfolios of green stormwater infrastructure (GSI; otherwise referred to as a form of green infrastructure, urban ecological infrastructure (Childers et al., 2019), or, more broadly, nature-based solutions) or suggested that the construction, restoration, or incorporation of inland wetlands be included in sustainable urban drainage systems or low-impact development strategies to reduce pluvial flooding (Chan et al., 2018; Fletcher et al., 2015; Y. Li et al., 2020).
Wetlands may provide water-regulation services to cities through a variety of hydrologic processes. Depending on wetland morphology, wetland vegetation, environmental conditions, soil characteristics, water-table depth, and connectivity to drainage systems to which wetlands may be connected, wetlands may manage stormwater via some combination of impoundment (the temporary storage of water), infiltration (the removal of surface water via percolation into wetland soils), evapotranspiration (the removal of surface and soil water from the system via evaporation or plant-mediated transpiration), and conveyance (the movement of water through and out of the drainage system via passive flow; Bullock & Acreman, 2003). For many cities considering the use of wetland GSI, the key hydrologic functions of wetlands are those of detention and infiltration (Y. Li et al., 2020). Detention of stormwater in wetlands delays or reduces stormwater release to downstream waterways (Kadykalo & Findlay, 2016). Infiltration, facilitated by wetlands through their pervious soils, reduces the proportion of precipitation that converts to runoff (Fletcher et al., 2013). Widespread impervious cover in cities leads to high rates of conversion of precipitation to runoff, which in turn increases peak rates of discharge in drainage systems and can overwhelm the drainage system flood connected areas (Ogden et al., 2011).
Critically absent from the literature on the flood-mitigation services of wetlands are city-wide studies on how performance of the urban stormwater management system changes when urban wetlands are constructed, restored, or incorporated. Change in the value of water-regulation service of urban wetlands over is often estimated using simple land-use or land-cover change and look-up tables of water regulation service values according to regional wetland area (G. Li et al., 2022; Mukherjee et al., 2021). Such estimates assume water regulation services absent any details or consideration of the stormwater management system to which they are connected (C. Wang et al., 2018; Y. Wang et al., 2018; Zhang et al., 2020). But outside of an urban context, it is widely recognized that system-specific knowledge is necessary to accurately estimate effects of wetlands on the water regulation services that wetlands may provide (Acreman & Holden, 2013; Kadykalo & Findlay, 2016). Wetland dimensions, extent, antecedent storage conditions, rates of infiltration and evapotranspiration, and configuration within a stormwater management system are all likely to influence the performance of urban stormwater management systems.
While wetland GSI is often recommended to increase resilience against floods in cities under a changing climate (Stefanakis, 2019), its efficacy should not be taken for granted. Climate change will shift storm intensity and timing away from the conditions for which stormwater management systems, even those with wetland GSI, were designed, which are generally historical storms (ASCE/Environmental & Water Resources Institute, 2006). Sensitivity of the drainage system response to changes in precipitation intensity from climate change depends on, for example, the size of the contributing watershed and the size and configuration of wetland GSI within the system. Yet studies that espouse the benefits of wetland GSI for increasing resilience in the face of climate change rarely contextualize those benefits in terms of the scale of the flood risk that climate change poses, or examine how performance of systems with wetland GSI might also change with the climate.
In the present study, we modeled the coupled effects of inland wetland loss and impervious watershed expansion on stormwater management system performance under different scenarios of climate change. For the study system, Valdivia, Región los Ríos, Chile, we asked the following question: How does the loss of wetland GSI in an urban stormwater management system change the system's flood volume, peak discharge rate, and peak discharge timing? We hypothesized flood volume and rate of peak discharge would increase, and the hour of peak discharge would arrive earlier, with wetland loss. Additionally, we asked: how do the effects of wetland loss on flooding compare to the effects of changing rainfall during extreme storms? We hypothesized that there would be more systemic flooding, longer periods of flooding, and that peak discharge would be greater and arrive earlier due to increasing rainfall than by wetland loss. Finally, we asked: how much does infiltration contribute to flood reduction as wetland loss increases? We hypothesized that infiltration would contribute to lower flood volume and reduce flood duration under all extents of wetland loss.
2 Materials and Methods
2.1 Study Site
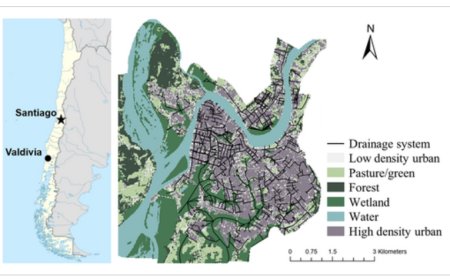
Valdivia, Chile (area: 93.94 km2) is a city of approximately 166,000 people in the southern half of Chile, 850 km south of the capital Santiago, in the Región de los Ríos (Figure 1). Citizens and stormwater managers in Valdivia must contend with a high risk of pluvial flooding owing to high average annual precipitation, a long rainy season, the city's location 12 km inland from the Pacific Ocean, at the confluence of three rivers, and patterns of land development. Valdivia's ecosystem is classified as a temperate rainforest (Amigo & Ramirez, 1998; Hajek & Di Castri, 1975). Wetlands are a characteristic feature of Valdivia, covering 20.64 km2 (22.7%) of the municipal area but are at risk from continued development.
Left: Location of study site, Valdivia, Chile (39.8336°S, 73.2154°W). Right: Valdivia's land cover based on spectral analysis of a 2010 orthophoto, and drainage system, as described in 2012 by the Chilean Ministry of Public Works.

Valdivia's average annual rainfall was approximately 1719.48 mm between 1990 and 2021 (Dirección General de Aeronáutica Civil, 2020), with pronounced droughts in the last decade. In 2015, rainfall in the region and snowpack in the Andés were low enough that the riverine potable water supply became too saline for treatment due to tidally forced saltwater intrusions from the nearby ocean, and the city was forced to pump groundwater for nearly all of its supply (Garcés-Vargas et al., 2020). In 2021, for the first time since the city began measuring precipitation at the nearby Pichoy Airport meteorological station in 1969, the city registered less than 1,000 mm of precipitation (Sepúlveda, 2021). This extreme departure from the prevailing rainfall patterns has added to concerns about sustainability and resilience in Valdivia under climate change (Garcés-Vargas et al., 2020; Sepúlveda, 2021).
Valdivia's stormwater management system is composed primarily of gray infrastructure components (e.g., pipes and canals), wetlands, and the rivers into which the system ultimately discharges. As of 2012, Valdivia's stormwater management system consists of roughly 245.7 km of drainage infrastructure, of which 41.2 km (16.8%) is wetland GSI. The origin of most of wetland cover in the city is a 1960 earthquake of magnitude 9.5, which caused up to 20 m of uplift in some areas and subsidence and rifting in others (Barrientos & Ward, 1990). Since the earthquake, the city has deliberately incorporated many of these wetlands into its stormwater management system (CMOP, 2012). In addition, the presence of wetlands in the city is owed in part to local conservation movements to maintain the cultural services of wetlands (Correa et al., 2018) and their function as habitat to charismatic species (e.g., Cygnus melancoryphus) tied to Valdivian identity (Silva et al., 2015).
2.2 General Approach
We used model estimates of future land cover change and estimates of future extreme rainfall as inputs to a 1-dimensional model of Valdivia's stormwater management system, and ultimately produced estimates of flood volume and flood location for a range of land cover and climate conditions (Figure 2). This process began by convening an in-person workshop in Valdivia, Chile to co-develop with practitioners the goals and objectives of four different scenarios of development for the city to achieve by the year 2080. We then combined historical data on land-cover change in Valdivia and scenario goals and objectives into rules governing land-cover change in the Dinamica EGO cellular automata-based model (Soares-Filho et al., 2002). The outputs of this model were five land-cover maps: one for each of the four scenarios developed in the workshop at the start of this process, along with an additional “business-as-usual” scenario estimating land-cover change in the absence of interventions to the status quo. We then used ArcGIS Pro (ESRI) to estimate changes in wetland volume and subcatchment area as a result of the changes in land cover areas in the five land cover maps. Separately, we used daily precipitation estimates from downscaled climate models to estimate rainfall of 100-year return period, 24-hr duration storms in the year 2080 under various climate conditions. Estimated changes in wetland volume and subcatchment area, as well as estimated changes to rainfall during extreme storms, were used to construct a 1-dimensional model of Valdivia's stormwater management system under various land-cover and climate configurations in the year 2080. This 1-dimensional model was then used to estimate flood characteristics that varied by land-cover and climate configurations.
Process diagram detailing convergent processes used in this study to produce estimates of flood characteristics under a range of land cover and climate conditions. The left branch represents work done to produce spatial estimates of land cover change by the year 2080 and to translate these changes to land cover to changes in the morphology of wetlands and watershed areas. The right branch represents work done to produce estimates of rainfall during 100-year interval, 24-hr duration storms.

2.3 Stormwater Management Model Characteristics and Calibration
In 2002, Chile's Ministry of Public Works (CMOP) commissioned the development a hydrologic model of the city's surface and stormwater management system flows using the Environmental Protection Agency's Stormwater Management Model (CMOP, 2012; EPA SWMM; Rossman, 2015). EPA SWMM is a 1-dimensional hydrologic model that converts rainfall to runoff for each subcatchment and routes this water through conduits and nodes. The model is commonly used to design and assess the performance of stormwater management systems in urban areas (Choo et al., 2021; Gülbaz et al., 2019; Iffland et al., 2021). Valdivia's stormwater management model (SWMM) was updated in 2012 to include system expansions and observational delineation of the city's urban subcatchments, among other updates and improvements (CMOP, 2012). The 2012 SWMM also included a tidal outfall curve to account for changing water levels in the rivers to which the stormwater management system interacts, peaking on hour two of simulation at 1.46 m above invert elevation, and on hour 14 lowering to 0.28 m above outfall invert elevations, and repeating every 12 hours until simulation completion. This curve was designed to represent an annual average difference in water levels at the outfalls under historical river and ocean-level conditions. This curve was conserved in our final models.
Valdivia's SWMM was calibrated using observed stormflow data from seven storms of different return periods, ranging from 0.67 to 24.52 years, in a sub-section of the larger SWMM (CMOP, 2012). The model was optimized to achieve similar rates of peak discharge and flood volume to those observed through manipulating parameters like Manning's roughness and rates of infiltration for pervious and impervious surfaces for the observed storms (Table 1). These calibrated values were conserved in our final models. The absolute differences between the simulated and observed flood volume and rate of peak discharge for each storm for the final values of these parameters range from 1% to 74% for flood volume and from 5% to 86% for peak discharge rates (Table 2; CMOP, 2012). Notably, the model was not calibrated using observed events with return periods greater than 24.5 years. Published reports of EPA SWMM models that estimated flooding for whole urban watersheds are uncommon, particularly those that estimate the effects of large magnitude storms (e.g., 10-year or greater) over long durations (e.g., 24-hr); however, for context, two studies examining the effects of storms of much lesser magnitude than we examined, but nonetheless in whole urban watersheds, reported relative errors between simulation and observation flood volumes between 5% and 20% (Wu et al., 2018) and between 1% and 100% (Barco et al., 2008) depending on the range of input storm magnitudes and the method of optimization.
| Parameter | Value |
|---|---|
| Manning's n, impervious (N-Imperv) | 0.03 |
| Manning's n, pervious (N-Perv) | 0.09 |
| Depression storage-impervious (Dstore-Imperv; mm) | 1.25 |
| Soil moisture retention, pervious (S-pervious; mm) | 5 |
| Percent with no depression storage (% Zero-Impervious; %) | 80 |
| Rate of infiltration, minimum | 3 |
| Rate of infiltration, maximum | 4 |
| Decay rate (seconds−1) | 2 |
| Drying time (day) | 7 |
| Evaporation (mm day−1) | 2 |
- Note. EPA SWMM parameter names and units in parentheses.
| Storm return period (years) | Simulated flood volume (%) | Simulated peak rate of discharge (%) |
|---|---|---|
| 0.67 | +1 | +20 |
| 0.88 | −3 | +5 |
| 0.94 | −29 | −36 |
| 1.78 | +24 | −15 |
| 2.40 | +74 | +86 |
| 6.56 | −3 | −5 |
| 24.5 | +1 | +20 |
2.4 Estimating Future Land Cover Scenarios and Wetland Dimensions
In May of 2017, the Urban Resilience to Extremes (UREx) Sustainability Research Network (SRN) hosted a workshop in Valdivia, Chile, to envision a series of long-term (2080) future scenarios and desirable future pathways of urban development. Participants in the workshop represented a diverse array of Valdivia's stakeholders, such as municipal and regional government employees, university professors, students, and members of community action groups. Participants collaborated to develop a suite of visions and strategies to undertake in order to achieve four unique, plausible scenarios for a future Valdivia: Inclusive City, Friendly City, Eco-Wetland City, and Resilient-to-Flood City. The scenario themes emerged from the concerns of the citizens of Valdivia and an analysis of Valdivia's governance documents as well as a publication from the Inter-American Development Bank (IDB, 2015). The visioning and scenario development process in the workshop followed methods described by Iwaniec et al. (2020).
The qualitative strategies of four scenarios—Inclusive, Flood Resilient, Friendly, and Eco-Wetland—developed in Valdivia's workshops were translated by the UREx SRN modeling team into quantitative spatial and temporal rules and introduced into cellular automata-based models of land-use/land cover (LULC). This phase represents an iterative process in which the modeling team gathered feedback from various stakeholders on the four co-produced scenarios, adjusted the quantitative rules based on that feedback, and released updated simulations. Paired with historical information on LULC changes (observed 1983 and 2010 LULC maps) in Valdivia, the cellular automata-based Dinamica Environment for Geoprocessing Objects GO model (Soares-Filho et al., 2001, 2002), hereafter Dinamica, generated predictions of LULC configuration in Valdivia in 2080 for each scenario, as well as for a “Business-as-usual” (BAU) scenario, which assumes LULC proceeded entirely according to historical patterns of development. Dinamica has been used to simulate LULC change in many studies (e.g., Gago-Silva et al., 2017; Kolb et al., 2013; Pathirana et al., 2014). Dinamica estimates LULC change quantity using a transition matrix obtained from the cross-tabulation of the observed LULC data. The transition matrix is then transformed into a Markovian Chain Probability Matrix, which computes the average percentage of each land class that changes to another class at each time-step (in our case, 1 year) which is the transition rate. Dinamica then spatially allocates the quantity of LULC change according to a transition rule with two components. The first component calculates transition probabilities of LULC-change global drivers (explanatory variables such as accessibility, elevation, and slope). The second component considers the influence of local neighbors on the transition of the LULC state of a cell. Dinamica adopts the Weights of Evidence method (Soares-Filho et al., 2002, 2004) to quantify the influence, or the weight for a set of explanatory variables, based on the occurrence of each LULC in specific ranges. Dinamica calculates the influence of local neighbors on each cell in the landscape using two complementary functions: Expander and Patcher, one to expand/contract previous LULC patches and one to generate new ones, as described in depth in Soares-Filho et al. (2002).
In all scenarios, wetland cover declined compared to the 2010 base map (Figure 3). However, co-developed scenarios showed lower wetland loss rates than the BAU scenario. Stakeholder proposals from the workshops played a significant role in determining the loss rate. For example, in the Inclusive scenario, for example, the proposal to “create a network of wetlands for connectivity within the city, and wetlands are protected and an important part of mitigating climate change impacts” by 2050 led us to introduce new wetland corridors and stop converting wetlands to other uses. Although some wetlands were lost (converted to other land uses-especially built-up) before 2050, the addition of new wetland corridors helped reduce overall loss over time. The Eco-wetland scenario did not include this specific role, resulting in a slightly higher wetland loss rate compared to the Inclusive scenario. Also in the Eco-wetland scenario, a proposal of declaring wetlands as protected zones and implementing a 100% prohibition of wetland filling by 2040 was essential for preserving more wetlands. However, some wetlands were still converted to other land uses before 2040 before the prohibition toggled on. Finally, many wetlands within the present-day and scenario land-cover maps are not included within the city's stormwater management model. As a result, the change in wetland area in the subset of wetlands in the SWMM differed from the change in wetland area for the whole city in the cellular automata-based models. In scenarios like Eco-wetland, where wetland cover overall was greater than in other scenarios like Friendly, much of its conserved or gained wetland cover was in the northwest and west where the SWMM model did not extend, while the wetland cover it lost was within the wetlands included in the SWMM model (Figure 3).
Land cover in the present day (2010) and under five scenarios of development by the year 2080. Wetland loss generally increases from left to right, and from top to bottom, compared to the present day. City-wide wetland loss for each scenario was: 9.72% in Inclusive, 13.3% in Resilient-to-flood, 18.3% in Friendly, 23.98% in Eco-wetland, and 37.3% in Business-as-usual compared to Present Day wetland coverage.

We determined change in wetland area by overlaying present-day land cover with scenario land cover in ArcGIS Pro (ESRI, 2019) and removed wetland area that existed in the present day that converted to low- or high-density urban land cover in the future scenarios. Conversion of wetland area to either form of urban land cover necessitates the in-filling and elevating of the former wetland's surface and reduces wetland storage capacity. In contrast, conversion of wetland area to either pasture/green or forest land cover types does not necessitate in-filling or affect storage capacity.
We then calculated wetland volume and change in wetland volume that resulted from change in wetland area. A 2019 contour map (1-m vertical resolution) of Valdivia was converted into a triangulated irregular network (TIN), which characterized the three-dimensional topography of the landscape. For each of the wetlands in the SWMM, for the present day and each scenario, wetland boundaries were used to generate pseudo-surfaces every 0.25 m from the base of each wetland to their lowest bank, and the volume of the TIN underneath the pseudo-surface was calculated using the Surface Volume tool in ArcGIS Pro.
The wetlands included in the SWMM were modeled as one of two elements in EPA SWMM: storage units or conduits. Wetlands with single inflows from subwatersheds, and wetlands that were spatially isolated from connecting wetlands, were generally modeled as single storage units with shape and volume determined by the previous step (Figure 4). Wetlands with multiple inflows, and that were only separated from other wetlands by short pipe segments under roadways, were generally modeled as a series of conduits linked by nodes (Figure 4). Modeling wetlands as storage units or as a series of conduits and nodes affects flow timing in the model, as a parcel of water moves in and out of a storage unit instantaneously but requires time to move through a conduit, but it is nonetheless accepted practice to model wetlands as storage units (Knighton et al., 2016).
Example wetlands in Valdivia illustrating differences in the construction of storage unit and conduit wetlands in EPA SWMM. The wetland on the left receives water from a single subcatchment and was modeled as a storage unit. The wetland on the right receives water from multiple subcatchments and was modeled as a series of conduits and nodes.

Owing to a high natural water table, proximity to three rivers, and high annual rainfall, the model developers assumed no infiltration in Valdivia's wetlands. While this may be an acceptable assumption during the rainy season (June–September) when the water table is particularly high, our own observations indicated substantial potential for infiltration in Valdivia's wetland soils during the summer months (December–February) when temperature and insolation are high and months may pass without rain. In Section 8, we attempted to account for this potential for infiltration in an experimental model subsection. Initial water levels in the calibrated model were set to zero, which may reflect summer conditions but not winter conditions. Data on groundwater inputs to wetlands were not available for this investigation, though our field data collected for as-yet unpublished research indicated primarily unidirectional flow from wetlands outward to the city's rivers. While wetlands in Valdivia are typically depressional they nonetheless are perched higher than river water levels, even at high tide.
Changes to wetland volume, as calculated in the previous step in ArcGIS Pro, were translated to the SWMM by conserving bank elevation, depth, and length, but, in the case that the wetland was modeled as a conduit its length, by altering cross-sectional width (referred to in EPA SWMM as station), such that the overall wetland volume was the same between ArcGIS and EPA SWMM. Subcatchment areas in the SWMM were increased by the amount of wetland area lost to low- and high-density urban land cover between the present day and the scenarios. In the case that a wetland was only connected to a single subcatchment, all lost wetland area was added to the subcatchment. In the case that multiple subcatchments were connected to a wetland, the subcatchments expanded according to the amount of nearby wetland lost. No other subcatchment properties, such as imperviousness or rates of infiltration, were changed, as it was assumed that new low- and high-density urban subcatchment area would be roughly the same as the present-day low- and high-density subcatchment area.
2.5 Downscaling Climate Models to Valdivia, Chile
We employed asynchronous regional regression models to downscale precipitation estimates from atmosphere-ocean general circulation models to Valdivia, Chile (Stoner et al., 2012). Input data were historical observational data on rainfall from the Pichoy Airport meteorological station, located roughly 32 km (22 miles) from Valdivia's centroid. This station has the most consistent and longest rainfall record of any station either within or around the city. These downscaled models produced estimates of daily precipitation for the years 1969–2080. Additional information on the downscaling methods can be found in Supporting Information S1.
2.6 Estimating Rainfall Volume of a 100-Year Return Period, 24-hr Storm
What is Your Reaction?
 Like
0
Like
0
 Dislike
0
Dislike
0
 Love
0
Love
0
 Funny
0
Funny
0
 Angry
0
Angry
0
 Sad
0
Sad
0
 Wow
0
Wow
0