Convergence or Divergence? A Look at GDP Growth across Richer and Poorer Countries


Cross-country Convergence in GDP Per Capita
Real national income per person or, equivalently, real gross domestic product (GDP) per capita is a popular measure of economic development. Typically, higher levels of GDP per capita are associated with higher standards of living. For example, in 2022, the U.S. had a GDP per capita of $76,320, while Cameroon, a less developed economy, had a GDP per capita of only $1,500.
The Convergence Hypothesis and Diminishing Returns
The convergence hypothesis states that per capita incomes in different countries are getting closer to each other over time, implying that poorer countries are catching up with richer countries. This hypothesis is based on the concept of diminishing returns, which suggests that richer countries with an abundance of capital grow more slowly relative to poorer countries. However, economist Lant Pritchett observed that from 1870 to 1990, the difference in income between the richest country and all others increased significantly, contradicting the convergence hypothesis.
Lack of Convergence Before 2000
To examine the lack of convergence, we analyzed the GDP per capita of the U.S., one of the richest countries in the world, and compared it to the rest of the world. Between 1960 and 1999, there was no evidence of convergence. The average GDP per capita of the rest of the world remained constant at 27% of that of the U.S. during this period. In order for the rest of the world to close the gap with the U.S., other countries must experience faster economic growth.
Change in the Relationship between Growth Rate and Level of GDP Per Capita
To better understand the lack of convergence before 2000 and the closing gap since then, we analyzed disaggregated data at the country level. From 1960 to 1999, there was a positive relationship between the average annual growth rate of GDP per capita and relative GDP per capita. This indicates divergence, as richer countries experienced higher growth rates, widening the disparity over time.
Figure 1: Average Annual Growth Rate of GDP Per Capita versus Relative GDP Per Capita, 1960-1999
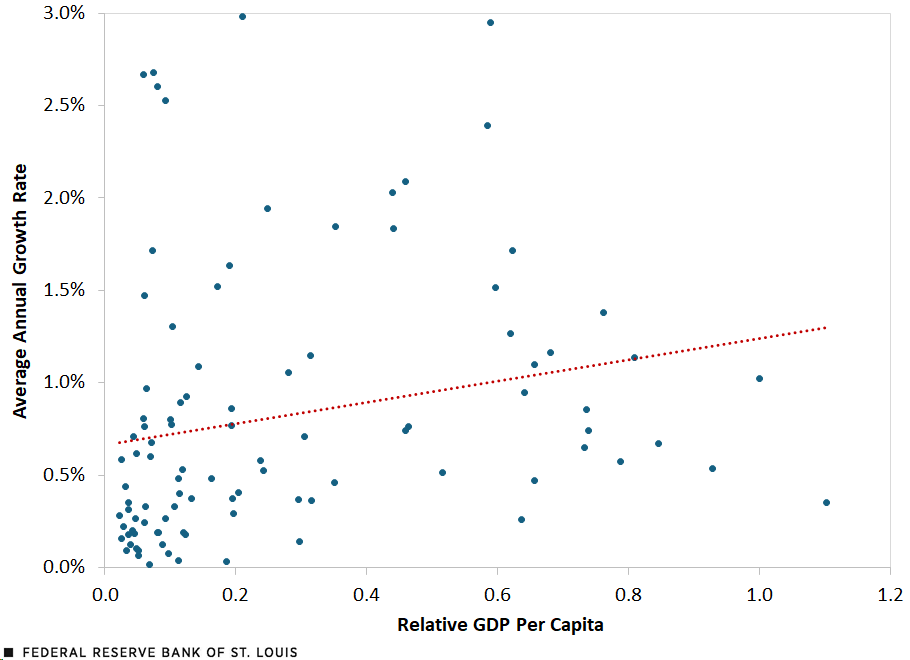
SOURCES: Penn World Tables 10.0 and authors’ calculations.
NOTES: The average annual growth rate is the time-series average of annual growth rates in per-capita GDP for each country for each year between 1960 and 1999. Relative GDP per capita is the ratio of per-capita GDP of each country to that of the U.S. We excluded countries with an average annual growth rate above 3% to understand this spread more carefully. The dotted line shows the best linear fit between the variables. There are 12 countries in the 1960-99 sample that exceed the growth rate of 3%. The best linear fit is positively sloped even if we include the 12 countries.
After 1999, the relationship between the growth rate and level of GDP per capita changed. From 2000 to 2019, there was a negative relationship between the average annual growth rate and relative GDP per capita. This suggests convergence, as poorer countries grew faster than richer ones, indicating a potential catch-up effect.
Figure 2: Average Annual Growth Rate of GDP Per Capita versus Relative GDP Per Capita, 2000-2019
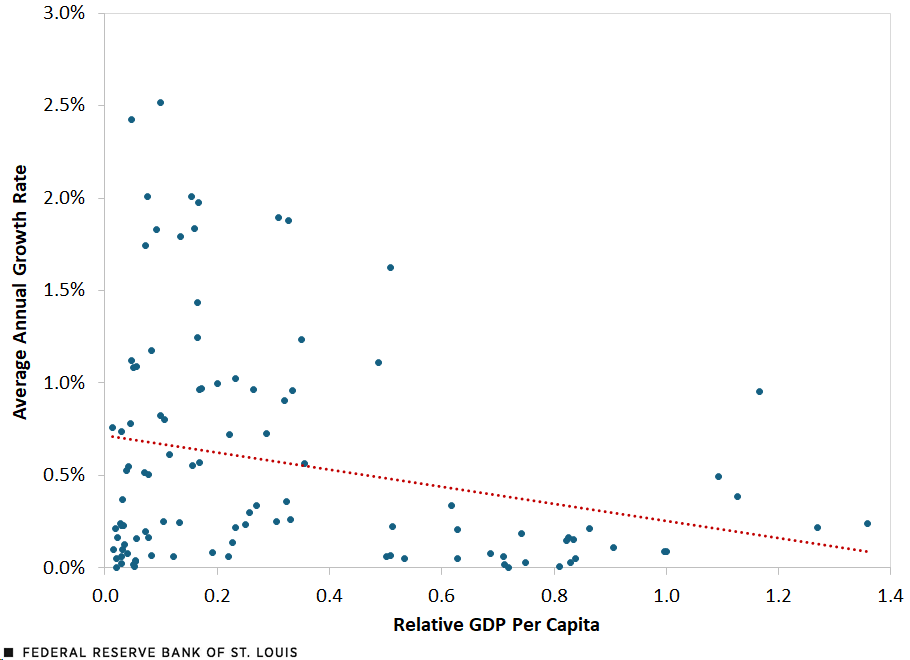
SOURCES: Penn World Tables 10.0 and authors’ calculations.
NOTES: The average annual growth rate is the time-series average of annual growth rates in per-capita GDP for each country for each year between 2000 and 2019. Relative GDP per capita is the ratio of per-capita GDP of each country to that of the U.S. We excluded countries with an average annual growth rate above 3% to understand this spread more carefully. The dotted line shows the best linear fit between the variables. There are four countries in the 2000-19 sample that exceed the growth rate of 3%. The best linear fit is negatively sloped even if we include the four countries.
Conclusion
This report highlights the change in the relationship between the growth rate and level of GDP per capita since 2000 compared to the years between 1960 and 1999. In the earlier period, richer countries experienced higher growth rates, widening the disparity. However, since 2000, poorer countries have shown higher growth rates, indicating a convergence effect and reducing the disparity between nations.
Notes
- See Pritchett’s article, “Divergence, Big Time,” in the summer 1997 issue of the Journal of Economic Perspectives.
- See Johnson and Papageorgiou’s March 2020 Journal of Economic Literature article, “What Remains of Cross-country Convergence?”
- Dev Patel, Justin Sandefur and Arvind Subramanian pointed out in their October 2018 Vox EU article, “Everything You Know about Cross-country Convergence Is (Now) Wrong,” that the convergence in the recent period “isn’t just about the growth slowdown in rich countries.”
SDGs, Targets, and Indicators
| SDGs | Targets | Indicators |
|---|---|---|
| SDG 8: Decent Work and Economic Growth | Target 8.1: Sustain per capita economic growth | GDP per capita |
| SDG 10: Reduced Inequalities | Target 10.1: Reduce income inequality | Relative GDP per capita |
1. Which SDGs are addressed or connected to the issues highlighted in the article?
SDG 8: Decent Work and Economic Growth
The article discusses the measure of real gross domestic product (GDP) per capita as a popular measure of economic development and standards of living. This aligns with SDG 8, which focuses on promoting sustained, inclusive, and sustainable economic growth, full and productive employment, and decent work for all.
SDG 10: Reduced Inequalities
The article highlights the convergence and divergence of GDP per capita between countries, indicating income inequality. SDG 10 aims to reduce inequalities within and among countries, making it relevant to the issues discussed.
2. What specific targets under those SDGs can be identified based on the article’s content?
Target 8.1: Sustain per capita economic growth
The article discusses the growth rates of GDP per capita for different countries over time, indicating the target of sustaining per capita economic growth.
Target 10.1: Reduce income inequality
The article highlights the disparity in GDP per capita between richer and poorer countries, indicating the target of reducing income inequality.
3. Are there any indicators mentioned or implied in the article that can be used to measure progress towards the identified targets?
The article mentions two indicators that can be used to measure progress towards the identified targets:
- GDP per capita: This indicator measures the economic growth and development of a country.
- Relative GDP per capita: This indicator compares the per capita GDP of each country to that of the U.S., highlighting income inequality and convergence/divergence.
4. SDGs, Targets, and Indicators
| SDGs | Targets | Indicators |
|---|---|---|
| SDG 8: Decent Work and Economic Growth | Target 8.1: Sustain per capita economic growth | GDP per capita |
| SDG 10: Reduced Inequalities | Target 10.1: Reduce income inequality | Relative GDP per capita |
Source: stlouisfed.org
![]()


