Grappling with Thailand’s Seasonal Haze
Grappling with Thailand's Seasonal Haze nasa.gov


Grappling with Thailand’s Seasonal Haze

Introduction
Each year in January and February, satellites begin to detect waves of smoke and fire in Southeast Asia, particularly in highland forests in Cambodia, Laos, Myanmar, and Thailand. Fire activity continues to increase through March and April, reaches a peak during the height of the dry season, and then fades in May with the start of the rainy season.
Individual fires are usually small and short-lived. But they are often so numerous that smoke, along with air pollution from rural and urban areas, mixes to produce thick layers of haze that blanket the landscape. Such hazes contain mixtures of small airborne particles called aerosols and gaseous pollutants such as nitrogen dioxide, sulfur dioxide, carbon monoxide, and ozone that degrade air quality and have harmful health effects.
The ASIA-AQ Campaign
In spring 2024, an international field campaign—ASIA-AQ (Airborne and Satellite Investigation of Asian Air Quality)—headed to Thailand to take a close look at the haze. During the last two weeks of March 2024, NASA’s DC-8 and Gulfstream III aircraft flew several flights over Chiang Mai, Bangkok, and rural areas surrounding the cities to sample air quality with several sensors. At the same time, satellites observed the haze from above.
Satellite Observations
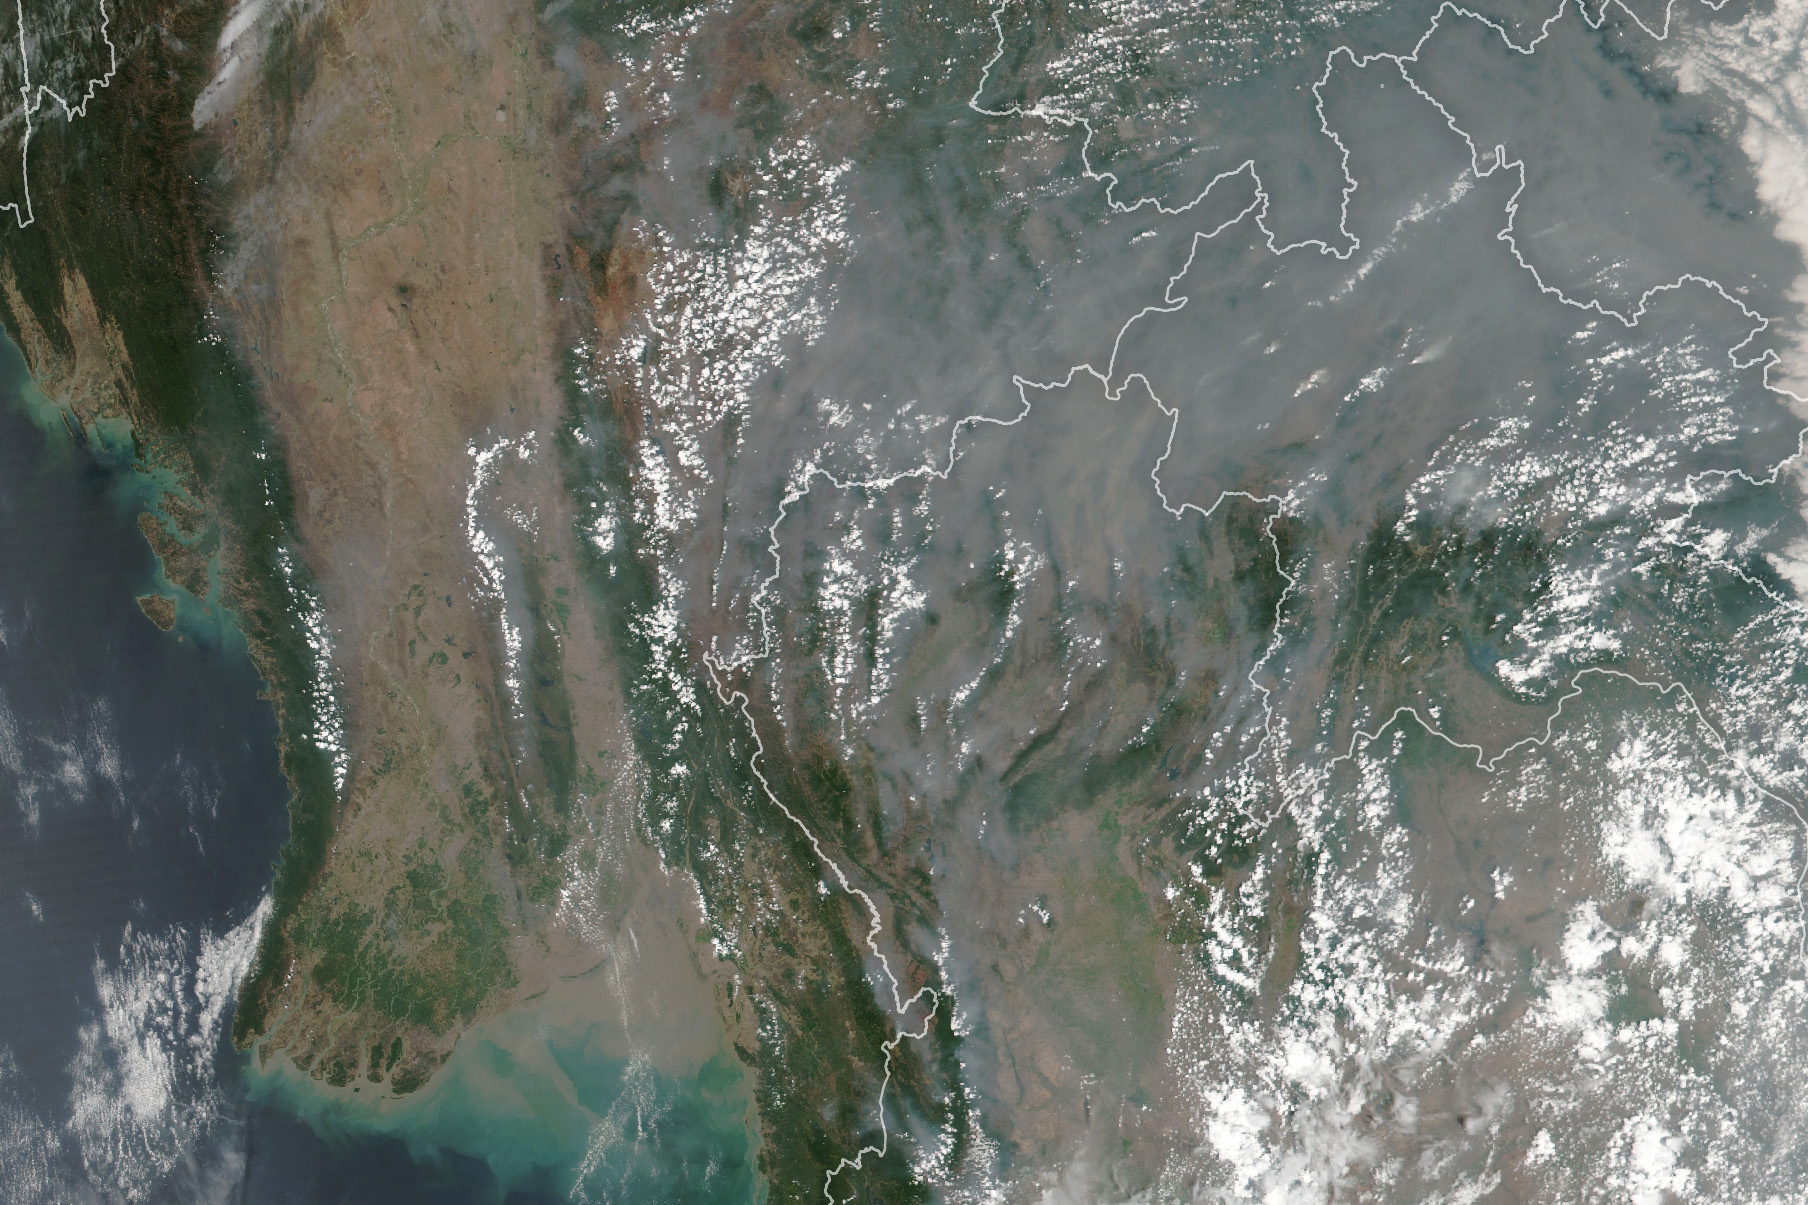
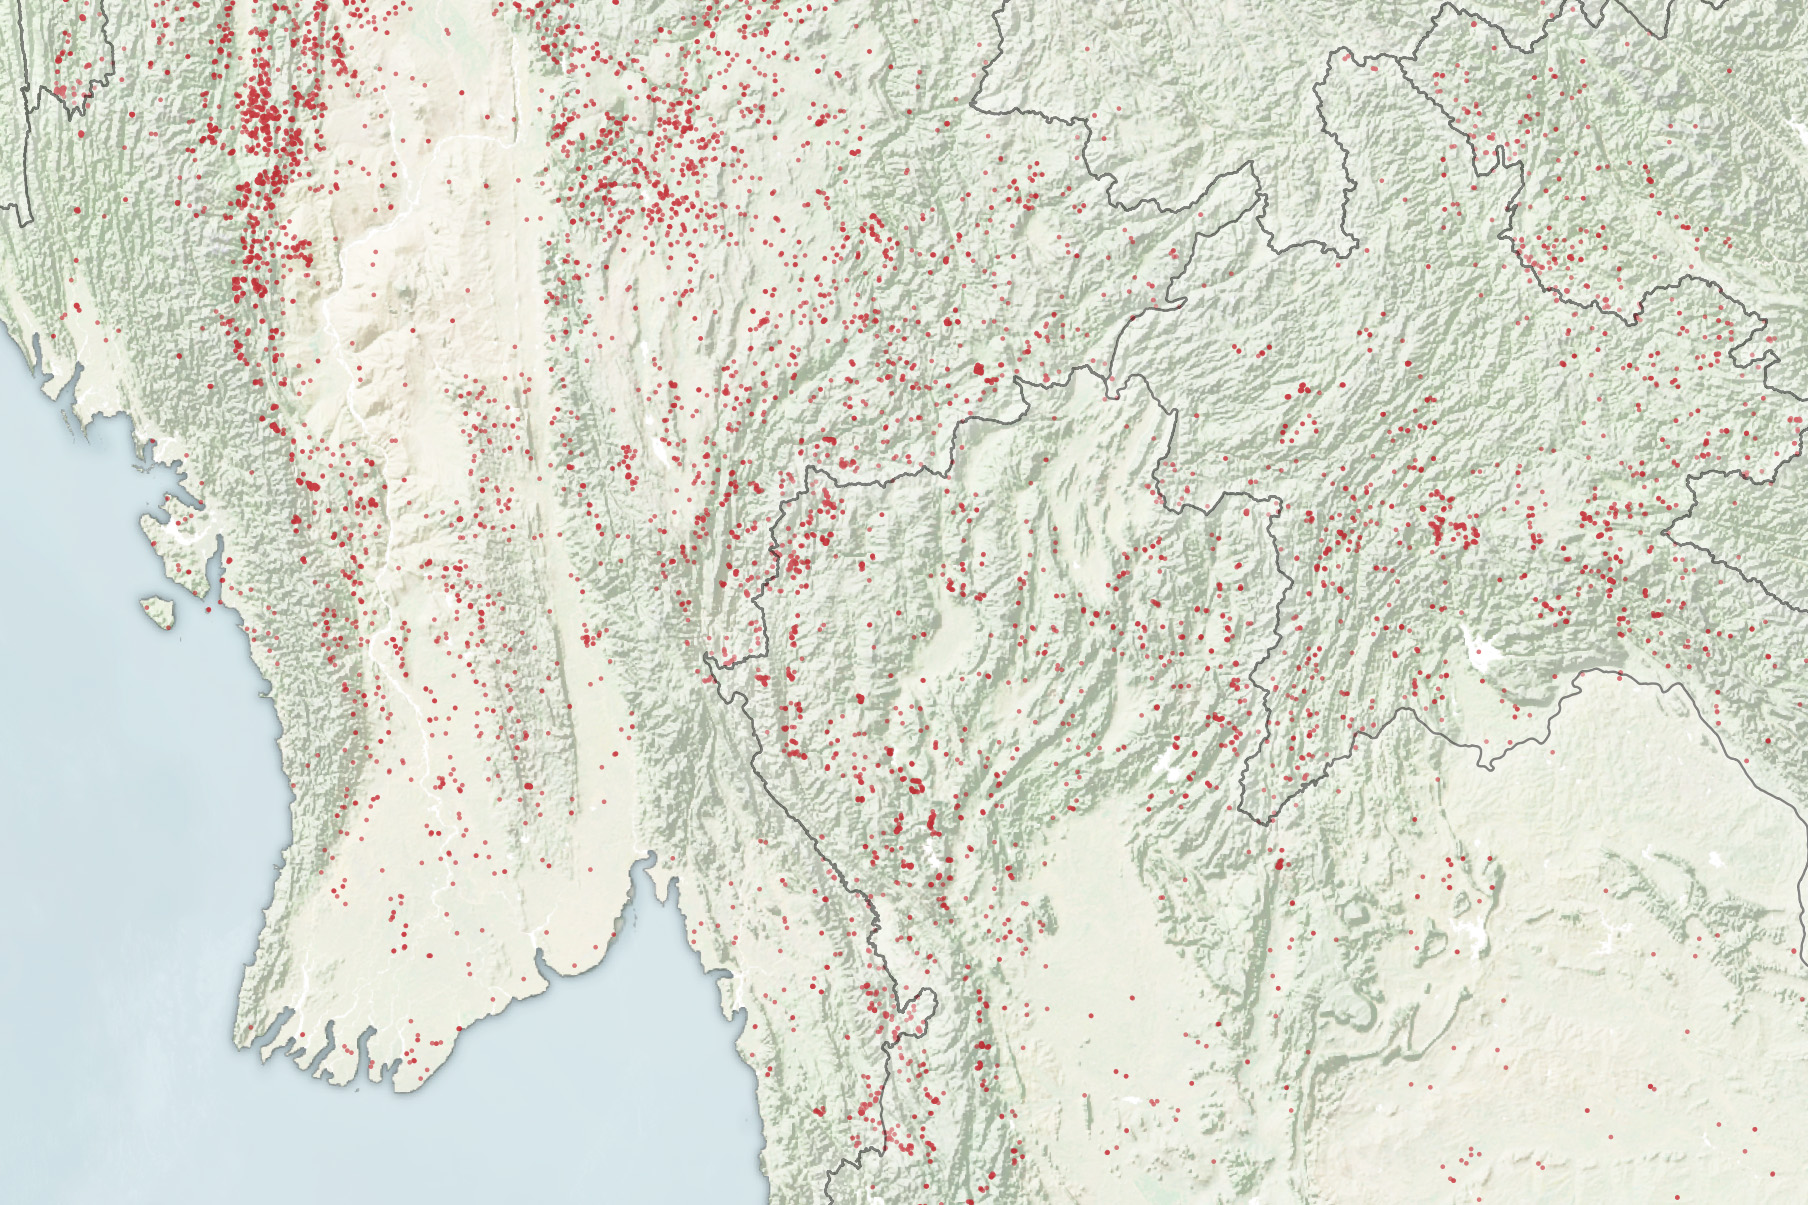
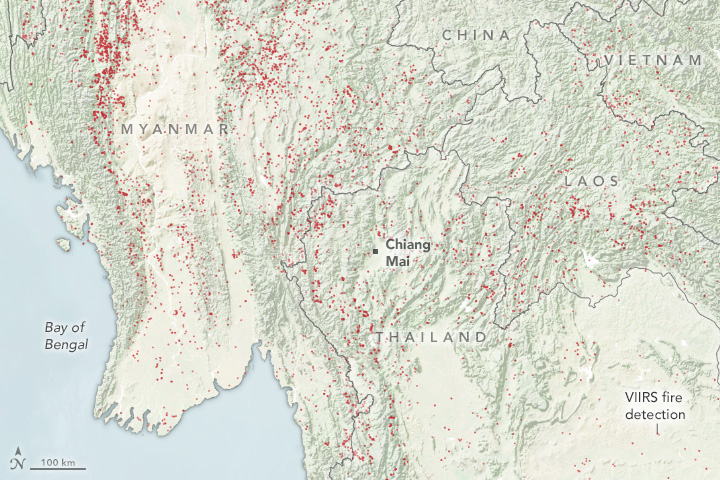
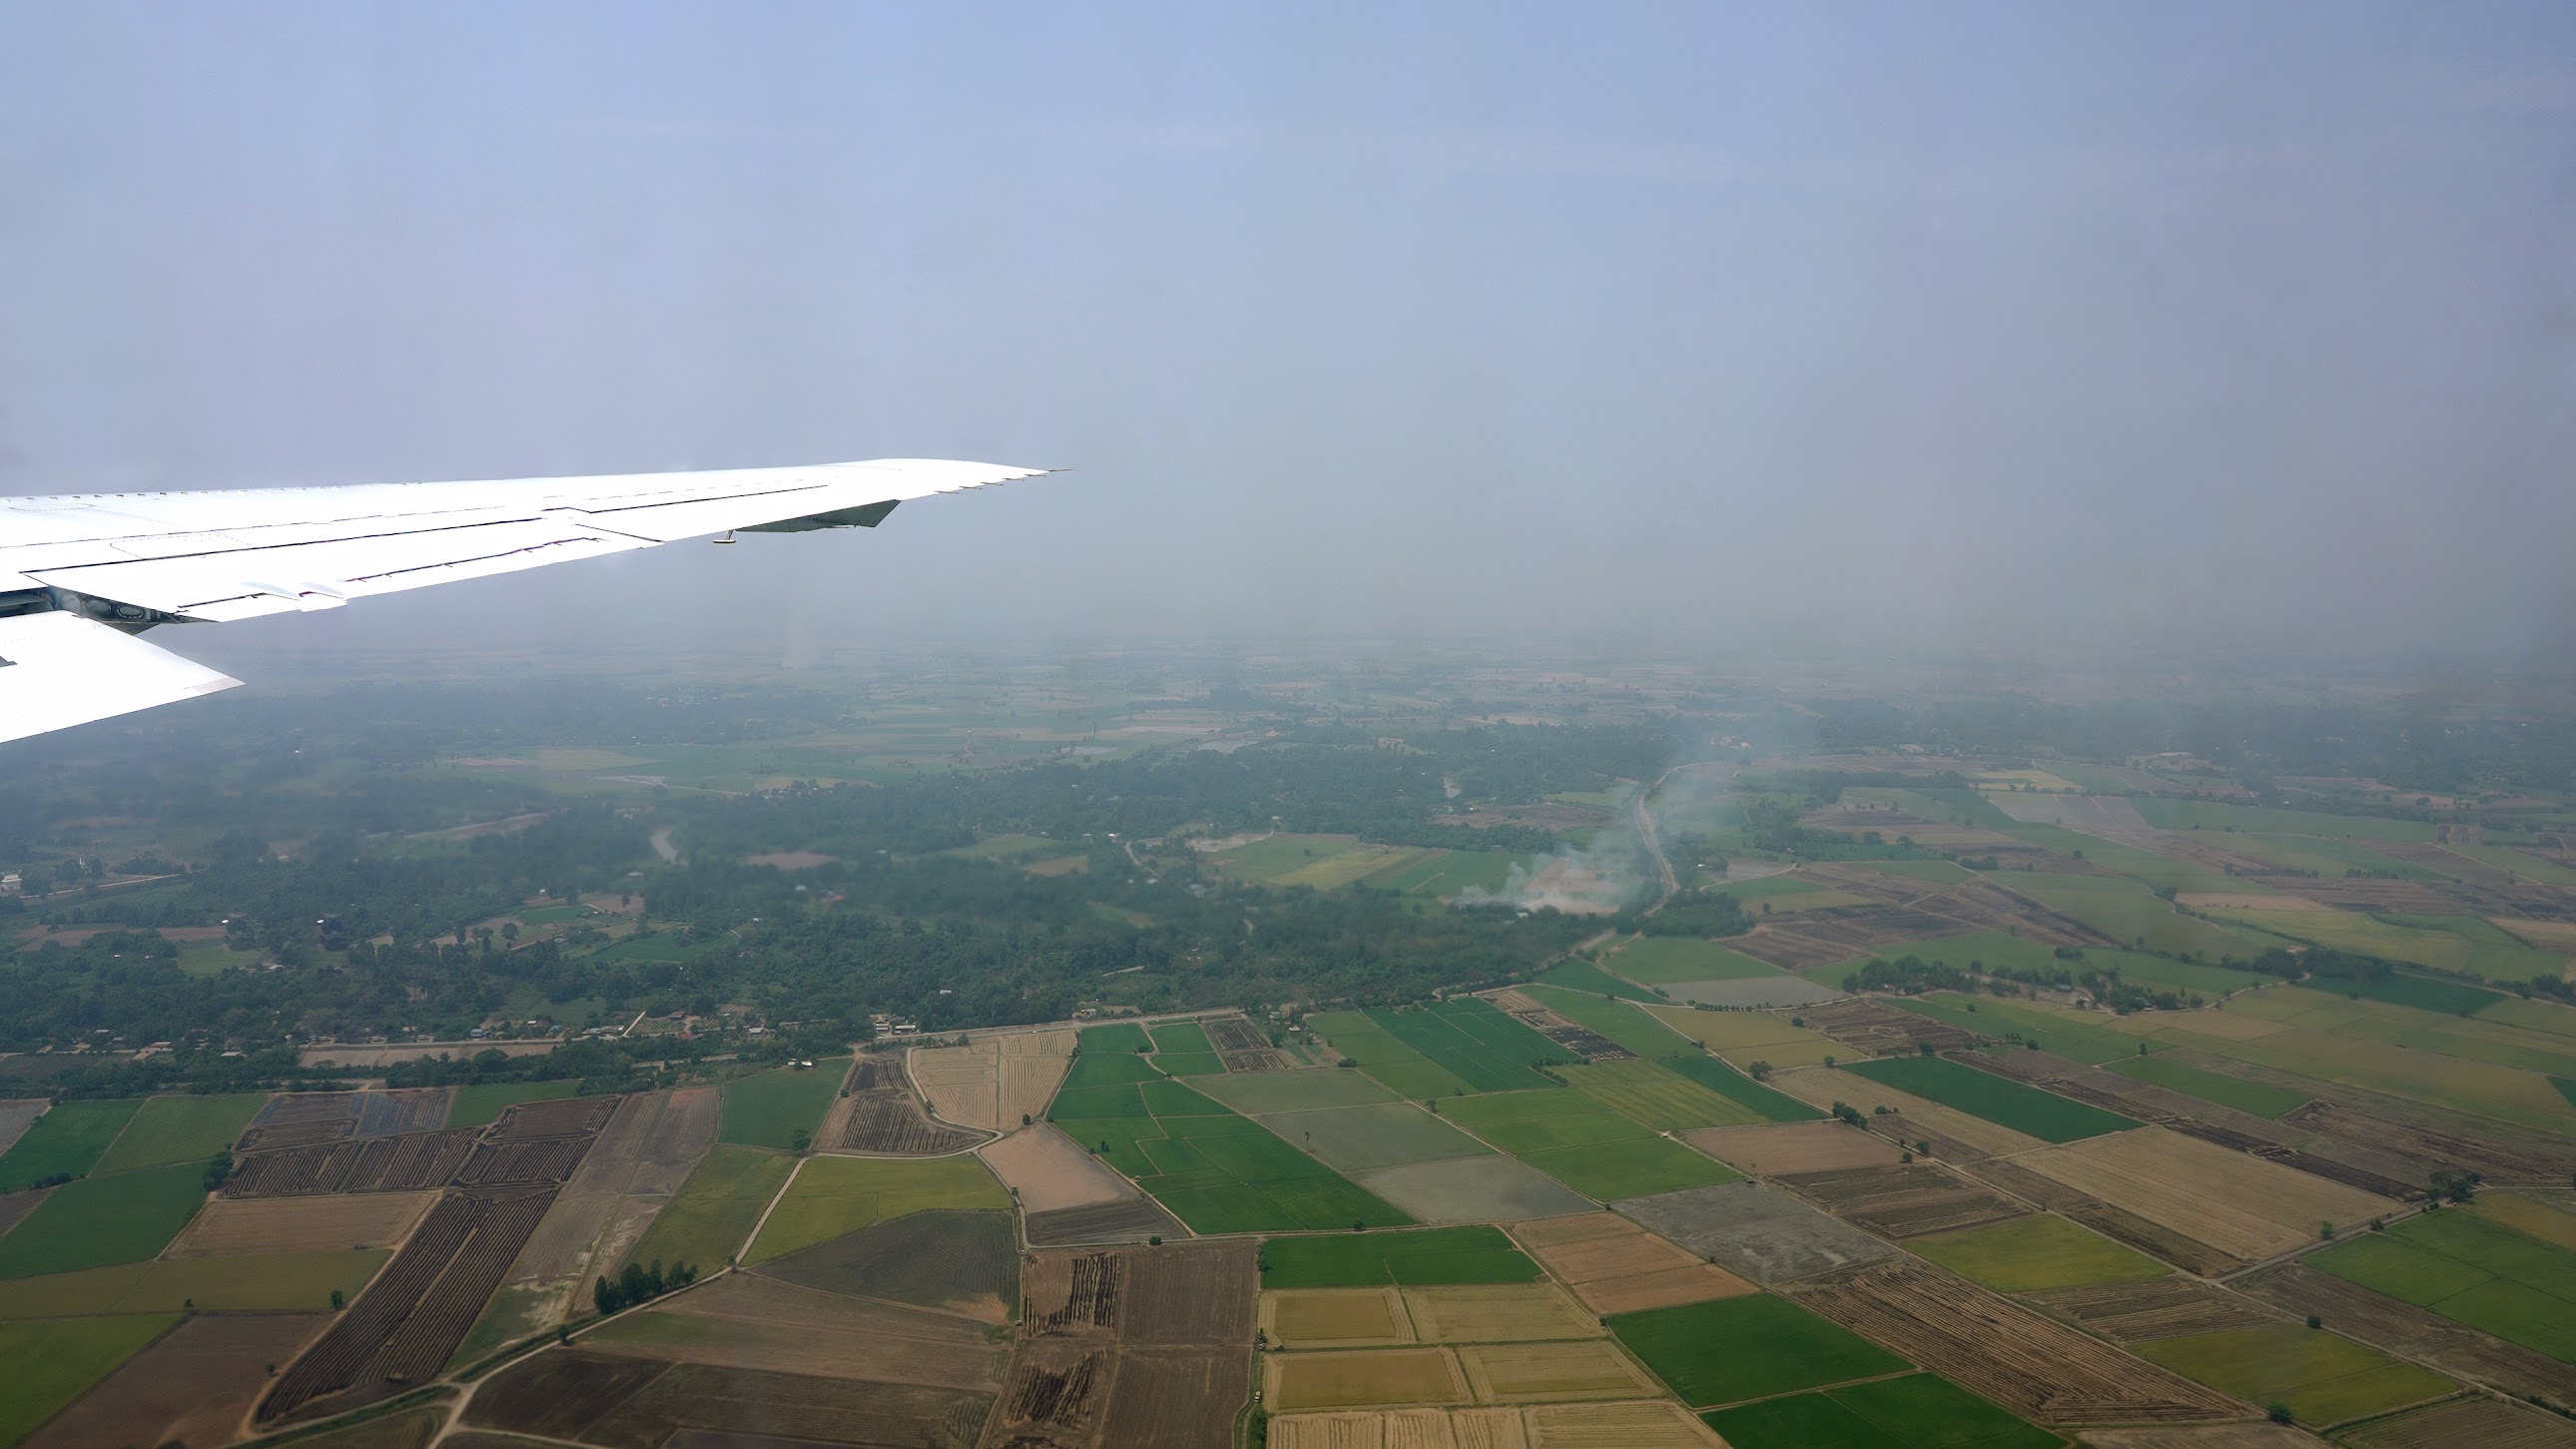
The natural-color satellite image above (left) shows a hazy day in Thailand during the region’s 2024 fire season. The image was captured by VIIRS (Visible Infrared Imaging Radiometer Suite) on the Suomi NPP (National Polar-orbiting Partnership) satellite on March 16. The map (right) shows the locations of fires detected that day by VIIRS, which identifies active fires by measuring infrared and visible light. The photographs below—showing a crop fire, haze over Bangkok, and scientists at work—were taken from the DC-8 during an ASIA-AQ flight on March 18, 2024.
Collaboration and Goals
“We’re collaborating closely with national and local government entities in Thailand,” said James Crawford, ASIA-AQ’s principal investigator. “The goal is to take as many simultaneous measurements of pollutants as possible from the ground, air, and space,” he said. The team will then use the data to refine models of how the region’s haze forms, evolves chemically over time, and moves throughout the region.
Causes of Haze
Fires, most of them lit intentionally, are a major contributor to the haze. One of the main reasons is agriculture, either to clear forests for planting or to burn post-harvest crop stubble. “Maize, which is primarily used for animal feeds, is the crop burned the most,” said Danny Marks, a Dublin City University geographer. It’s also common for people to start forest fires to aid in the collection of mushrooms and other forest products and to make it easier to hunt game. Subsistence farmers sometimes practice swidden agriculture, a technique that involves periodically cutting down trees and shrubs, letting the wood dry out for a few months, and then burning it to clear space for crops.
Health and Environmental Impacts
Haze is known to have a considerable impact on people. Particles in smoke reach deep into the lungs, entering the bloodstream and contributing to respiratory and cardiovascular diseases. Exposure to outdoor air pollution may contribute to as many as 33,000 premature deaths and millions of illnesses in Thailand per year, according to researchers. Meanwhile, haze regularly roils transportation networks, shutters schools, and triggers burning bans.
Challenges and Tools
But researchers say that the proportion of the haze that comes from urban sources, such as emissions from the transportation or industrial sectors, compared to fires or other rural sources of pollution, is unclear. And understanding the role of geographical features and meteorological factors, as well as the interactions between various pollutants, in controlling the distribution of haze remains a challenge. Chiang Mai, for instance, lies within a basin prone to temperature inversions that can prevent winds from dispersing air pollution.
NASA teams are also working with partners in the region and the USAID-NASA SERVIR program to develop tools designed to inform people about haze and smoke during the fire season. SERVIR Southeast Asia has worked with the Royal Thai Government’s Pollution Control Department (PCD) to develop the Mekong Air Quality Explorer tool. “This decision
SDGs, Targets, and Indicators Relevant to the Article
1. Which SDGs are addressed or connected to the issues highlighted in the article?
- SDG 3: Good Health and Well-being
- SDG 11: Sustainable Cities and Communities
- SDG 13: Climate Action
- SDG 15: Life on Land
The article discusses the impact of haze and air pollution on human health, the environment, and urban areas, which are all connected to the above-mentioned SDGs.
2. What specific targets under those SDGs can be identified based on the article’s content?
- SDG 3.9: By 2030, substantially reduce the number of deaths and illnesses from hazardous chemicals and air, water, and soil pollution and contamination.
- SDG 11.6: By 2030, reduce the adverse per capita environmental impact of cities, including by paying special attention to air quality and municipal and other waste management.
- SDG 13.2: Integrate climate change measures into national policies, strategies, and planning.
- SDG 15.1: By 2020, ensure the conservation, restoration, and sustainable use of terrestrial and inland freshwater ecosystems and their services.
These targets address the need to reduce pollution-related deaths and illnesses, improve air quality in cities, integrate climate change measures, and promote the conservation and sustainable use of ecosystems.
3. Are there any indicators mentioned or implied in the article that can be used to measure progress towards the identified targets?
- Number of premature deaths and illnesses related to air pollution
- Air quality index in urban areas
- Reduction in fire activity and haze
- Monitoring and forecasting of air quality
- Presence of low-cost sensors in cities
These indicators can be used to measure progress towards reducing pollution-related health impacts, improving air quality, and implementing effective monitoring and mitigation measures.
Table: SDGs, Targets, and Indicators
| SDGs | Targets | Indicators | |
|---|---|---|---|
| SDG 3: Good Health and Well-being | 3.9: By 2030, substantially reduce the number of deaths and illnesses from hazardous chemicals and air, water, and soil pollution and contamination. | – Number of premature deaths and illnesses related to air pollution | |
| SDG 11: Sustainable Cities and Communities | 11.6: By 2030, reduce the adverse per capita environmental impact of cities, including by paying special attention to air quality and municipal and other waste management. | – Air quality index in urban areas | – Presence of low-cost sensors in cities |
| SDG 13: Climate Action | 13.2: Integrate climate change measures into national policies, strategies, and planning. | – Reduction in fire activity and haze | |
| SDG 15: Life on Land | 15.1: By 2020, ensure the conservation, restoration, and sustainable use of terrestrial and inland freshwater ecosystems and their services. | – Monitoring and forecasting of air quality |
Behold! This splendid article springs forth from the wellspring of knowledge, shaped by a wondrous proprietary AI technology that delved into a vast ocean of data, illuminating the path towards the Sustainable Development Goals. Remember that all rights are reserved by SDG Investors LLC, empowering us to champion progress together.
Source: earthobservatory.nasa.gov
![]()
Join us, as fellow seekers of change, on a transformative journey at https://sdgtalks.ai/welcome, where you can become a member and actively contribute to shaping a brighter future.


