Here are the worst areas for air pollution in DC, according to satellite imagery – WTOP News
Here are the worst areas for air pollution in DC, according to satellite imagery WTOP

Air Quality Monitoring Using Satellite Images
Air quality is often measured near the surface using handheld monitors or devices run by state agencies or the Environmental Protection Agency.
Now researchers are using satellite images to quickly identify pollution problems that cause health issues.
“Satellite data provides a first look at what the pollution looks like, and then we can use other ground-based sensors that can narrow-in on the problem,” said Dan Goldberg, an assistant research professor at The George Washington University Milken School of Public Health.
Satellite Data for Pollution Monitoring
Goldberg spoke to WTOP shortly before leading a panel discussion on the topic with NASA specialists at South by Southwest in Austin, Texas.
“Orbiters that are about 700 kilometers up above us, orbiting every day and taking measurements of a pollutant called nitrogen dioxide in very high spatial resolution, of about one or two miles wide,” said Goldberg. “The bloom that I look at mostly comes from tailpipes and smokestacks, so there’s higher concentrations near cities, near lots of cars, construction equipment and industrial operations.”
Air Pollution in the Nation’s Capital
Goldberg was asked to provide an overview of where air pollution is the worst in and around the nation’s capital.
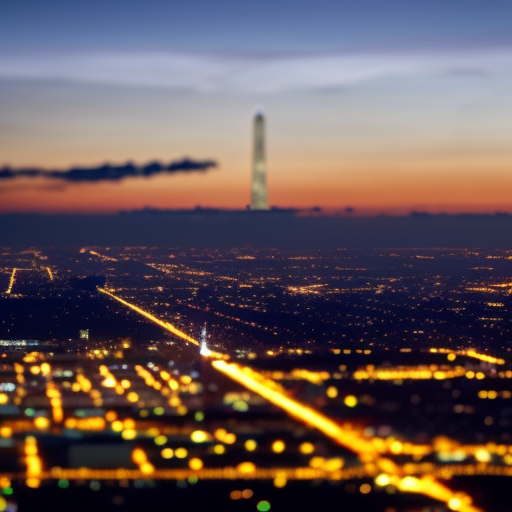
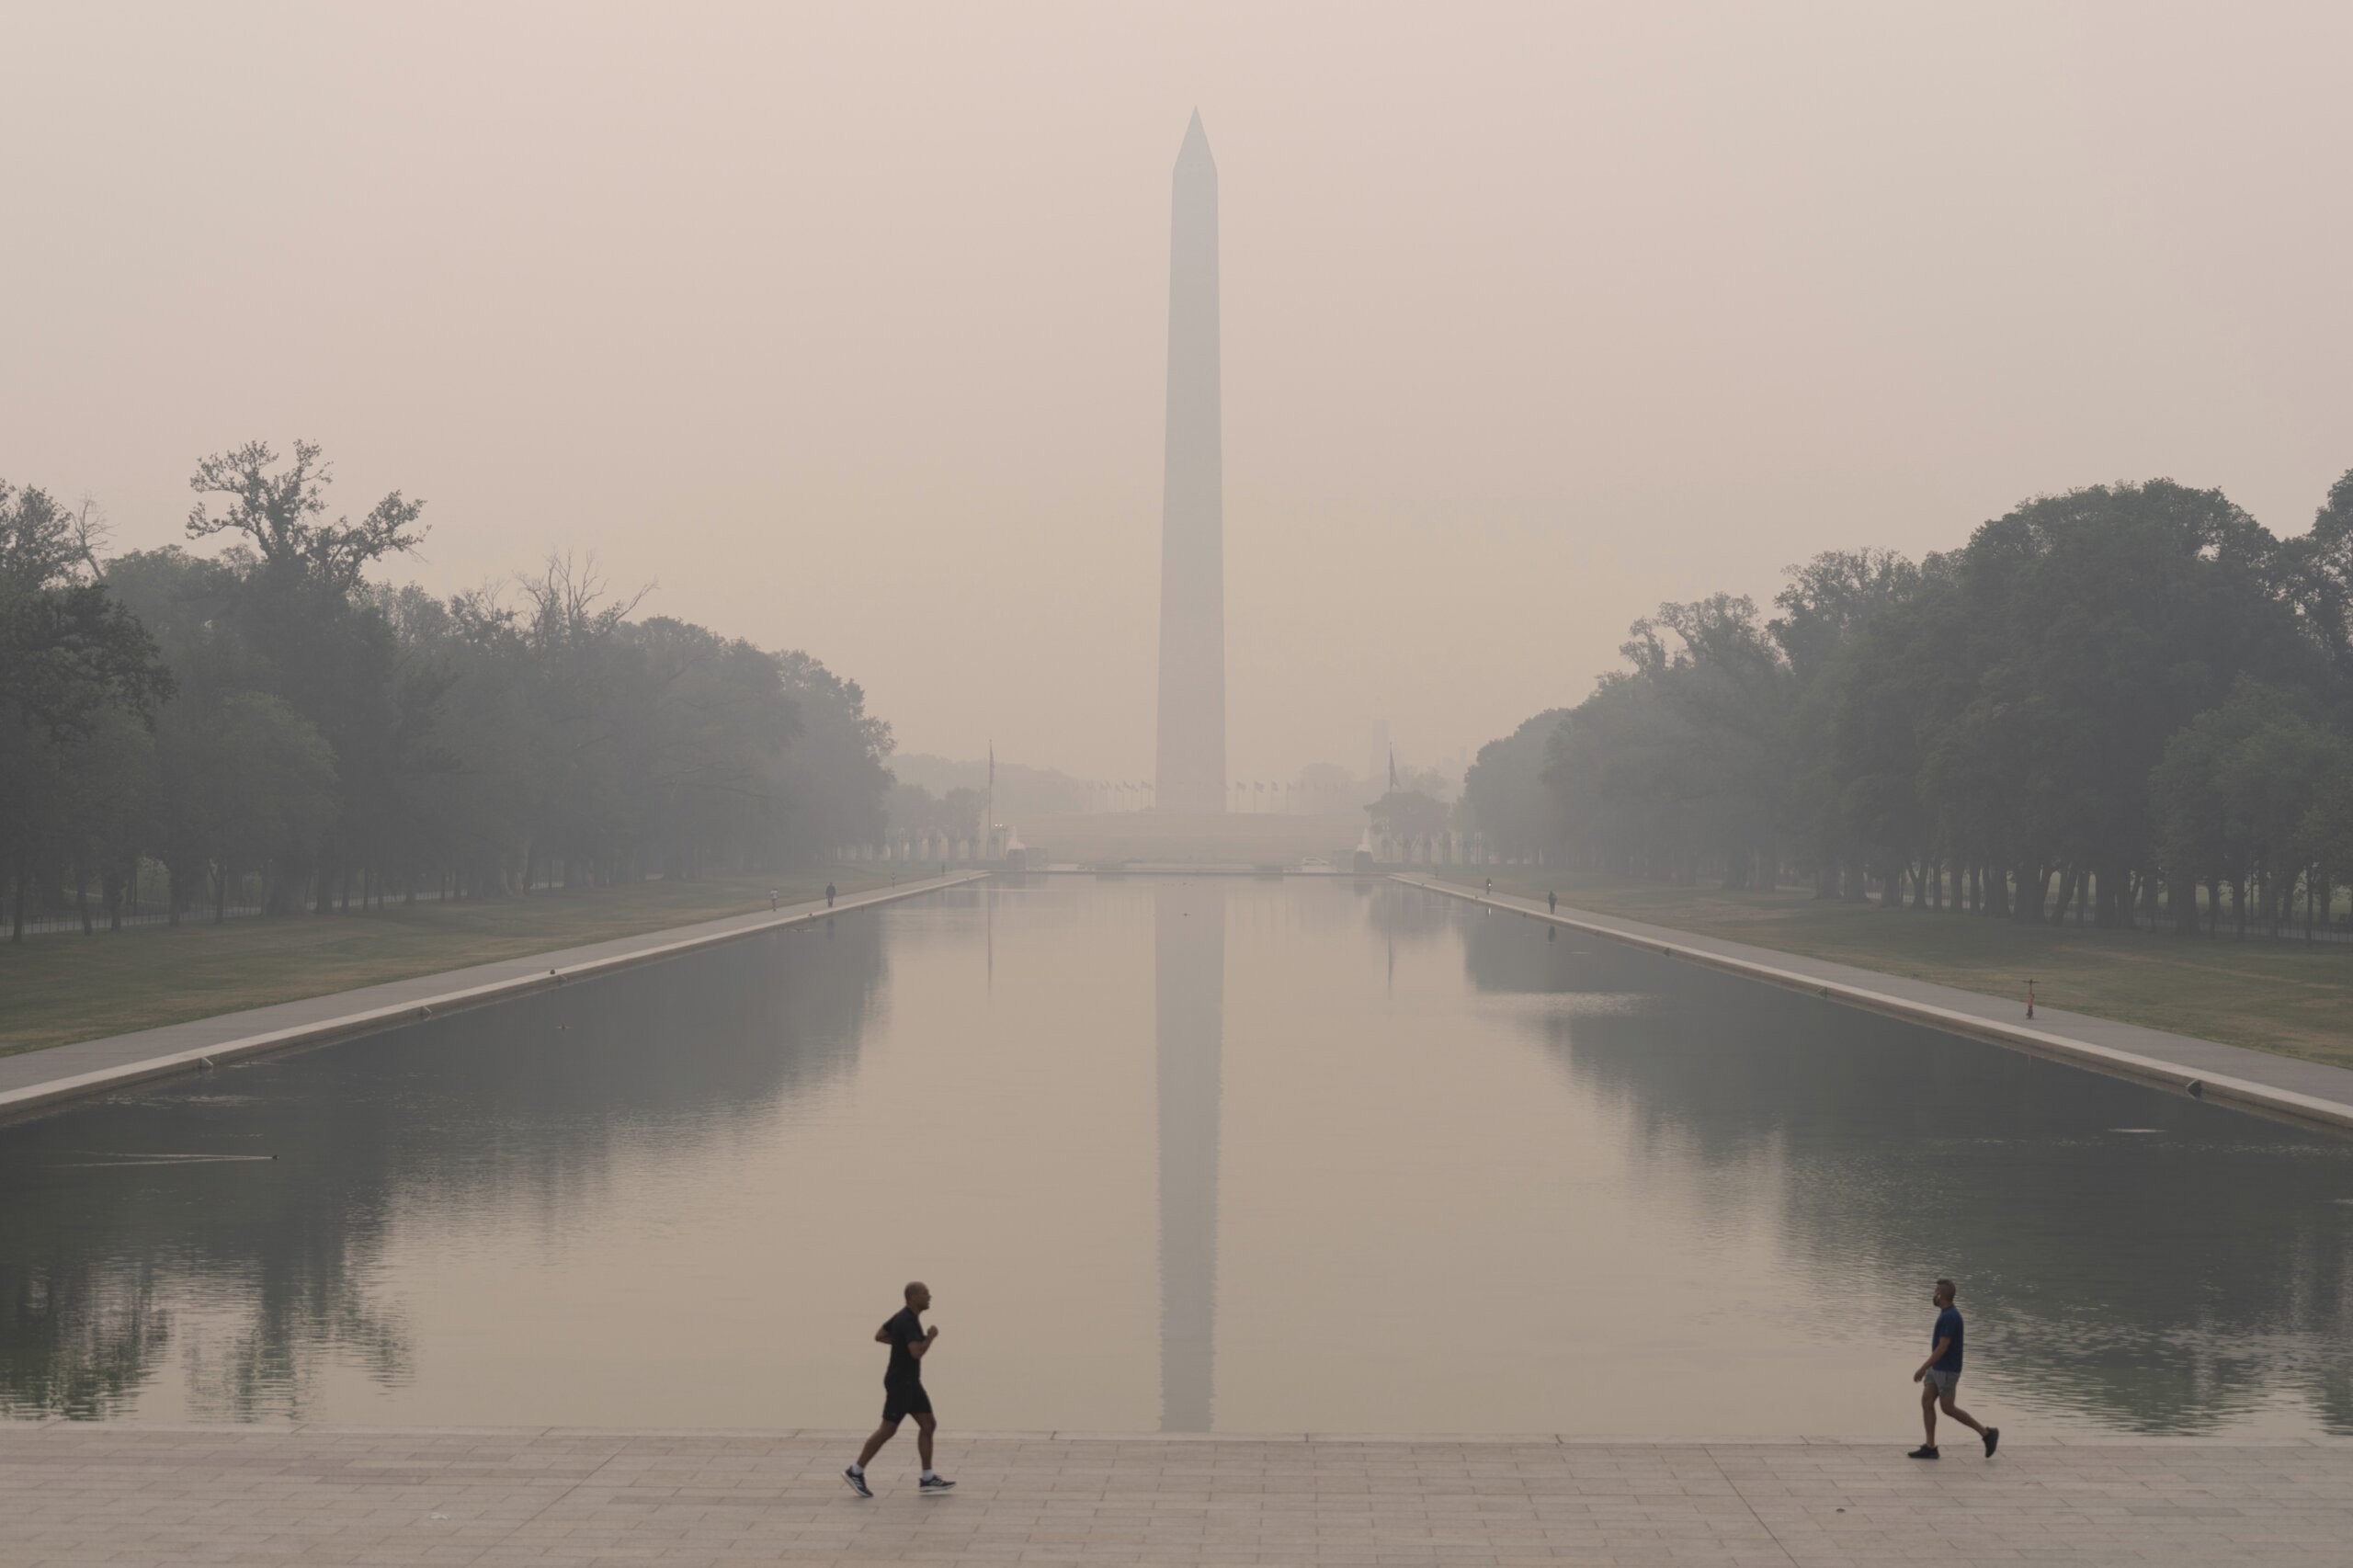
“For nitrogen dioxide, the highest concentrations are near the center of the city, sort of between the National Mall and National Airport,” Goldberg said. “There’s obviously a lot of vehicles in that location, you have planes taking off quite often from National, so there’s a lot of pollution in that general area.”
Goldberg said the satellite images show enhanced levels of pollution from diesel trucks along area highways.
In Washington, “These diesel trucking routes, and the communities near them, tend to be more on the eastern side of D.C.,” said Goldberg. The higher levels of pollution exacerbate some of the health issues that disproportionately affect people of color.
“The communities on the eastern side of D.C. have other social determinants of health, such as poor nutrition and low quality of health care that makes them a little more susceptible to air pollution — it’s just one extra burden on top of other burdens they’re facing,” Goldberg said.
He added that satellite images often show increased levels of pollution in Baltimore.
“They have pretty big ports, where there’s coal exports, a lot of things going throughout the world, so there’s a lot of industrial operations that D.C. doesn’t always have,” Goldberg said. “Baltimore tends to be a little more polluted than Washington, D.C.”
Monitoring Beyond Air Pollution
Air pollution isn’t the only problem that can be monitored by satellites. Researchers, doctors, and health care policy experts are using new technologies to predict and track disease, monitor disease-spreading mosquitoes, and wildfire emissions and pollution.
Conclusion
By utilizing satellite images, researchers are able to quickly identify and monitor pollution problems that impact public health. The data obtained from satellites, combined with ground-based sensors, provides valuable insights into the sources and concentrations of pollutants. This information can be used to develop targeted interventions and policies to improve air quality and mitigate the health risks associated with pollution.
References
- Get breaking news and daily headlines delivered to your email inbox by signing up here.
- © 2024 WTOP. All Rights Reserved. This website is not intended for users located within the European Economic Area.
SDGs, Targets, and Indicators Analysis
1. Which SDGs are addressed or connected to the issues highlighted in the article?
- SDG 3: Good Health and Well-being
- SDG 11: Sustainable Cities and Communities
- SDG 13: Climate Action
The article discusses air pollution and its impact on health, particularly in urban areas. This connects to SDG 3, which aims to ensure healthy lives and promote well-being for all at all ages. It also mentions the concentration of pollution near cities and the impact on communities, highlighting the importance of sustainable cities and communities (SDG 11). Additionally, the article mentions the sources of pollution, including tailpipes and smokestacks, which are contributors to climate change (SDG 13).
2. What specific targets under those SDGs can be identified based on the article’s content?
- SDG 3.9: By 2030, substantially reduce the number of deaths and illnesses from hazardous chemicals and air, water, and soil pollution and contamination.
- SDG 11.6: By 2030, reduce the adverse per capita environmental impact of cities, including by paying special attention to air quality and municipal and other waste management.
- SDG 13.2: Integrate climate change measures into national policies, strategies, and planning.
The article highlights the need to address air pollution to reduce health issues caused by hazardous chemicals and pollution. This aligns with SDG 3.9. It also emphasizes the importance of improving air quality in cities, which relates to SDG 11.6. Furthermore, the mention of pollution from tailpipes and smokestacks connects to the need for integrating climate change measures into policies and planning, as stated in SDG 13.2.
3. Are there any indicators mentioned or implied in the article that can be used to measure progress towards the identified targets?
- Number of deaths and illnesses related to air pollution
- Concentration levels of nitrogen dioxide (NO2) near cities
- Levels of pollution from diesel trucks along highways
The article mentions the health issues caused by air pollution, indicating that the number of deaths and illnesses related to air pollution can be used as an indicator to measure progress towards SDG 3.9. It also discusses the concentration levels of nitrogen dioxide (NO2) near cities, which can be measured to assess air quality and progress towards SDG 11.6. Additionally, the article highlights the pollution from diesel trucks along highways, which can be monitored to track progress in reducing pollution levels and achieving SDG 11.6.
4. Table: SDGs, Targets, and Indicators
| SDGs | Targets | Indicators |
|---|---|---|
| SDG 3: Good Health and Well-being | SDG 3.9: By 2030, substantially reduce the number of deaths and illnesses from hazardous chemicals and air, water, and soil pollution and contamination. | Number of deaths and illnesses related to air pollution |
| SDG 11: Sustainable Cities and Communities | SDG 11.6: By 2030, reduce the adverse per capita environmental impact of cities, including by paying special attention to air quality and municipal and other waste management. | Concentration levels of nitrogen dioxide (NO2) near cities |
| SDG 13: Climate Action | SDG 13.2: Integrate climate change measures into national policies, strategies, and planning. | Levels of pollution from diesel trucks along highways |
Behold! This splendid article springs forth from the wellspring of knowledge, shaped by a wondrous proprietary AI technology that delved into a vast ocean of data, illuminating the path towards the Sustainable Development Goals. Remember that all rights are reserved by SDG Investors LLC, empowering us to champion progress together.
Source: wtop.com
![]()
Join us, as fellow seekers of change, on a transformative journey at https://sdgtalks.ai/welcome, where you can become a member and actively contribute to shaping a brighter future.


