2024 Second Quarter State-Level GDP Data


Real GDP Growth in US States and Regions
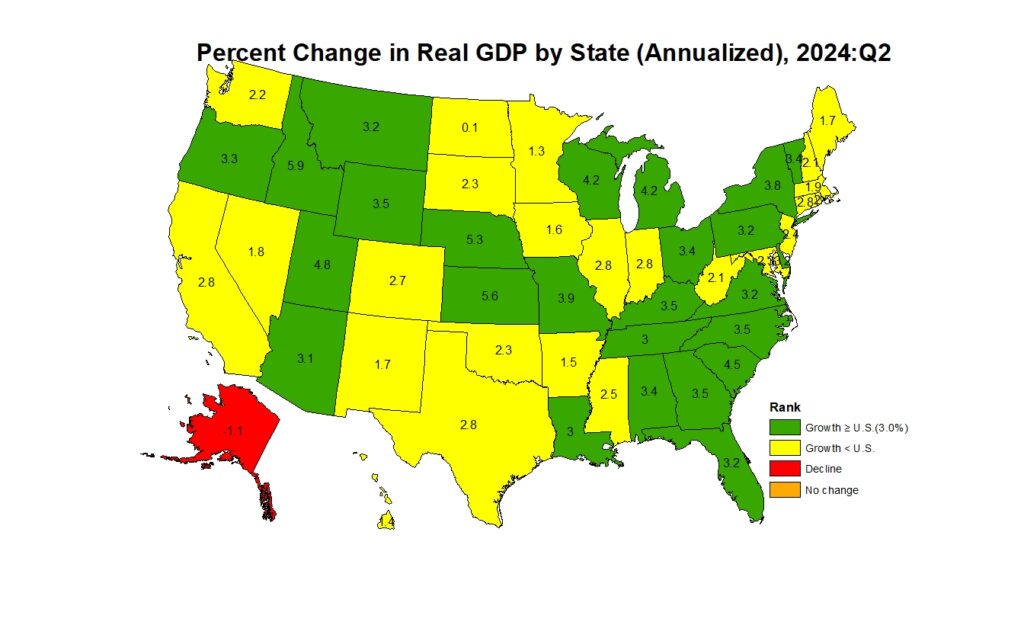
In the second quarter of 2024, real gross domestic product (GDP) increased in 49 states and the District of Columbia, according to the U.S. Bureau of Economic Analysis (BEA). However, Alaska reported an economic contraction during this time. The percent change in real GDP ranged from a 5.9 percent increase at an annual rate in Idaho to a 1.1 percent decline in Alaska.
Nationwide Growth
Nationwide, growth in real GDP (measured on a seasonally adjusted annual rate basis) increased 3.0 percent in the second quarter of 2024, which is higher than the first quarter level of 1.6 percent. The leading contributors to the increase in real GDP across the country were nondurable-goods manufacturing, finance and insurance, and health care and social assistance.
Regional Growth
Regionally, real GDP growth increased in all eight regions between the first and second quarter. The percent change in real GDP ranged from a 3.7 percent increase in the Rocky Mountain region (Colorado, Idaho, Montana, Utah, and Wyoming) to a 2.2 percent increase in the New England region (Connecticut, Maine, Massachusetts, New Hampshire, Rhode Island, and Vermont).

State-Level Growth
At the state level, Idaho posted the highest GDP growth rate (5.9 percent), followed by Kansas (5.6 percent) and Nebraska (5.3 percent). However, Alaska experienced an economic contraction in the second quarter of 2024. The agriculture, forestry, fishing, and hunting industry was the leading contributor to growth in 11 states, including Idaho, Kansas, Nebraska, and the states with the highest increases in real GDP. On the other hand, mining, which declined in 33 states, was the leading contributor to the decrease in real GDP in Alaska, the only state with a decline in real GDP.
Discover more from Eye On Housing
Subscribe to get the latest posts sent to your email.
SDGs, Targets, and Indicators
-
SDG 8: Decent Work and Economic Growth
- Target 8.1: Sustain per capita economic growth in accordance with national circumstances and, in particular, at least 7 percent gross domestic product growth per annum in the least developed countries.
- Indicator 8.1.1: Annual growth rate of real GDP per capita.
-
SDG 9: Industry, Innovation, and Infrastructure
- Target 9.2: Promote inclusive and sustainable industrialization and, by 2030, significantly raise industry’s share of employment and gross domestic product, in line with national circumstances, and double its share in least developed countries.
- Indicator 9.2.1: Manufacturing value added as a proportion of GDP and per capita.
-
SDG 11: Sustainable Cities and Communities
- Target 11.3: By 2030, enhance inclusive and sustainable urbanization and capacity for participatory, integrated, and sustainable human settlement planning and management in all countries.
- Indicator 11.3.1: Ratio of land consumption rate to population growth rate.
Table: SDGs, Targets, and Indicators
| SDGs | Targets | Indicators |
|---|---|---|
| SDG 8: Decent Work and Economic Growth | Target 8.1: Sustain per capita economic growth in accordance with national circumstances and, in particular, at least 7 percent gross domestic product growth per annum in the least developed countries. | Indicator 8.1.1: Annual growth rate of real GDP per capita. |
| SDG 9: Industry, Innovation, and Infrastructure | Target 9.2: Promote inclusive and sustainable industrialization and, by 2030, significantly raise industry’s share of employment and gross domestic product, in line with national circumstances, and double its share in least developed countries. | Indicator 9.2.1: Manufacturing value added as a proportion of GDP and per capita. |
| SDG 11: Sustainable Cities and Communities | Target 11.3: By 2030, enhance inclusive and sustainable urbanization and capacity for participatory, integrated, and sustainable human settlement planning and management in all countries. | Indicator 11.3.1: Ratio of land consumption rate to population growth rate. |
Analysis
1. Which SDGs are addressed or connected to the issues highlighted in the article?
The issues highlighted in the article are connected to SDG 8: Decent Work and Economic Growth, SDG 9: Industry, Innovation, and Infrastructure, and SDG 11: Sustainable Cities and Communities.
2. What specific targets under those SDGs can be identified based on the article’s content?
Based on the article’s content, the specific targets that can be identified are:
- Target 8.1: Sustain per capita economic growth in accordance with national circumstances and, in particular, at least 7 percent gross domestic product growth per annum in the least developed countries.
- Target 9.2: Promote inclusive and sustainable industrialization and, by 2030, significantly raise industry’s share of employment and gross domestic product, in line with national circumstances, and double its share in least developed countries.
- Target 11.3: By 2030, enhance inclusive and sustainable urbanization and capacity for participatory, integrated, and sustainable human settlement planning and management in all countries.
3. Are there any indicators mentioned or implied in the article that can be used to measure progress towards the identified targets?
Yes, there are indicators mentioned in the article that can be used to measure progress towards the identified targets:
- Indicator 8.1.1: Annual growth rate of real GDP per capita.
- Indicator 9.2.1: Manufacturing value added as a proportion of GDP and per capita.
- Indicator 11.3.1: Ratio of land consumption rate to population growth rate.
The article provides information on the real GDP growth rates of different states and regions, which can be used to calculate the annual growth rate of real GDP per capita (Indicator 8.1.1). It also mentions the leading contributors to GDP growth, such as the manufacturing sector, which can be used to measure manufacturing value added as a proportion of GDP and per capita (Indicator 9.2.1). Additionally, the article discusses the growth in different regions, which can be used to assess the ratio of land consumption rate to population growth rate (Indicator 11.3.1).
Source: eyeonhousing.org
![]()


