New method for mapping air pollution reveals disproportionate burden in disadvantaged communities

Disparities in Exposure to Toxic Pollutants: A Report on Environmental Justice
In recent years, environmental justice researchers have uncovered wide disparities in exposure to toxic pollutants between people living in low-income neighborhoods and those living in wealthier communities.
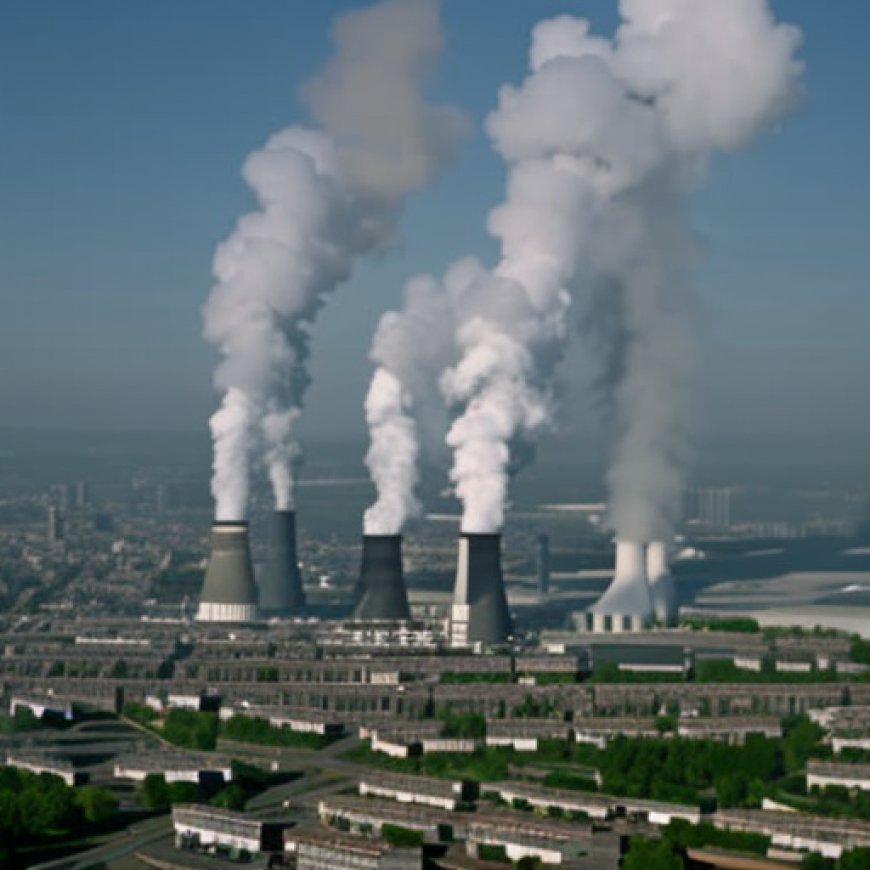
Much of the research has focused on air pollution emitted from factories, along with diesel truck and automobile exhaust from highways—which are generally situated far from high-income neighborhoods. Higher levels of air pollutants can cause adverse health outcomes.
But these previous studies have relied on limited data. They’ve generally used regulatory pollution monitoring reports that are collected as little as once a year—often from monitoring stations that are miles away from people’s homes—which don’t give an accurate, granular picture.
Research Study on Air Pollution Disparities
Jason G. Su, an environmental health sciences researcher at UC Berkeley School of Public Health, is changing that. Su led a study published in Science Advances that drew on a massive amount of data to create a nearly block-by-block picture of three air pollutants around the state of California.
“Our research revealed significant air pollution exposure disparities among vulnerable populations,” Su said. “However, what was pleasantly surprising was the observed decline in overall disparities related to traffic marker NO2 (nitrogen dioxide) and fine particulate matter exposure. This suggests that the gap in exposure is narrowing, which is an encouraging trend for public health.”
Su’s researchers used terabytes of data from 850 monitoring stations, weather and traffic reports; and other data from 2012 to 2019 to create daily air pollution maps for Fresno, Los Angeles, Sacramento, and the San Francisco Bay Area. They then matched the reports on three pollutants: NO2, particulate matter (PM2.5), and ozone, against census tract data showing race, ethnicity, and income.
Findings and Implications
“We found that communities with a higher proportion of minority populations were exposed to elevated concentrations of NO2 and PM2.5, compared to predominantly white communities,” the authors wrote.
“Our study revealed that disadvantaged communities are consistently exposed to higher air pollution concentrations than advantaged communities. Disadvantaged communities are often located near industrial facilities and manufacturing plants, major roadways, and other sources of pollution, leading to higher concentrations in nearby areas.”
The authors wrote that from 2012 to 2019, while the disadvantaged communities, described by lower-income census tracts, had higher levels of nitrogen dioxide and particulate matter than their more wealthy counterparts, their overall levels had declined, due to pollution reduction measures. They also wrote that ozone had increased in the wealthier communities, compared to the lower-income neighborhoods.
“Other people have done this, but not as elegantly as we have shown neighborhood levels of air pollution,” said Dr. John Balmes, emeritus professor of environmental health sciences at UC Berkeley School of Public Health and emeritus professor at UCSF, who co-authored the report.
By combining these different data sources through machine learning, Balmes said, Su was able to harness a massive amount of data from multiple sources, to create an air pollution map that shows distinctions neighborhood by neighborhood.
Future Research and Sustainable Development Goals
Balmes said that the research team will follow this study with an epidemiological study, examining the effect of air pollution on children’s school performance.
“The lower-income areas saw the biggest decline because they had the most pollution to begin with,” Balmes said. “Freeways, ports, railyards. They don’t put rail yards in Piedmont [a wealthy enclave that is surrounded by the city of Oakland].”
Su said his research team has expanded its fine-resolution data from eight years to over 30 years across California. This comprehensive dataset is now being utilized in several critical studies, including the impacts of air pollution on emergency department visits, hospitalizations, and mortality; preterm birth and low birth weight outcomes; life expectancy across multiple generations and cognitive decline.
“These studies will provide deeper insights into the health effects of air pollution, especially the impacts on vulnerable populations,” Su said.
SDGs, Targets, and Indicators
-
SDG 3: Good Health and Well-being
- Target 3.9: By 2030, substantially reduce the number of deaths and illnesses from hazardous chemicals and air, water, and soil pollution and contamination.
- Indicator 3.9.1: Mortality rate attributed to household and ambient air pollution.
- Indicator 3.9.2: Mortality rate attributed to unsafe water, unsafe sanitation, and lack of hygiene.
-
SDG 10: Reduced Inequalities
- Target 10.2: By 2030, empower and promote the social, economic, and political inclusion of all, irrespective of age, sex, disability, race, ethnicity, origin, religion, or economic or other status.
- Indicator 10.2.1: Proportion of people living below 50 percent of median income, by age, sex, and persons with disabilities.
- Indicator 10.2.2: Proportion of people living in households with access to basic services.
-
SDG 11: Sustainable Cities and Communities
- Target 11.6: By 2030, reduce the adverse per capita environmental impact of cities, including by paying special attention to air quality and municipal and other waste management.
- Indicator 11.6.2: Annual mean levels of fine particulate matter (e.g., PM2.5 and PM10) in cities (population weighted).
Table: SDGs, Targets, and Indicators
| SDGs | Targets | Indicators |
|---|---|---|
| SDG 3: Good Health and Well-being | Target 3.9: By 2030, substantially reduce the number of deaths and illnesses from hazardous chemicals and air, water, and soil pollution and contamination. | Indicator 3.9.1: Mortality rate attributed to household and ambient air pollution. Indicator 3.9.2: Mortality rate attributed to unsafe water, unsafe sanitation, and lack of hygiene. |
| SDG 10: Reduced Inequalities | Target 10.2: By 2030, empower and promote the social, economic, and political inclusion of all, irrespective of age, sex, disability, race, ethnicity, origin, religion, or economic or other status. | Indicator 10.2.1: Proportion of people living below 50 percent of median income, by age, sex, and persons with disabilities. Indicator 10.2.2: Proportion of people living in households with access to basic services. |
| SDG 11: Sustainable Cities and Communities | Target 11.6: By 2030, reduce the adverse per capita environmental impact of cities, including by paying special attention to air quality and municipal and other waste management. | Indicator 11.6.2: Annual mean levels of fine particulate matter (e.g., PM2.5 and PM10) in cities (population weighted). |
Analysis
1. Which SDGs are addressed or connected to the issues highlighted in the article?
The issues highlighted in the article are connected to SDG 3: Good Health and Well-being, SDG 10: Reduced Inequalities, and SDG 11: Sustainable Cities and Communities.
2. What specific targets under those SDGs can be identified based on the article’s content?
Based on the article’s content, the specific targets that can be identified are:
– Target 3.9: By 2030, substantially reduce the number of deaths and illnesses from hazardous chemicals and air, water, and soil pollution and contamination.
– Target 10.2: By 2030, empower and promote the social, economic, and political inclusion of all, irrespective of age, sex, disability, race, ethnicity, origin, religion, or economic or other status.
– Target 11.6: By 2030, reduce the adverse per capita environmental impact of cities, including by paying special attention to air quality and municipal and other waste management.
3. Are there any indicators mentioned or implied in the article that can be used to measure progress towards the identified targets?
Yes, there are indicators mentioned or implied in the article that can be used to measure progress towards the identified targets. These indicators include:
– Indicator 3.9.1: Mortality rate attributed to household and ambient air pollution.
– Indicator 3.9.2: Mortality rate attributed to unsafe water, unsafe sanitation, and lack of hygiene.
– Indicator 10.2.1: Proportion of people living below 50 percent of median income, by age, sex, and persons with disabilities.
– Indicator 10.2.2: Proportion of people living in households with access to basic services.
– Indicator 11.6.2: Annual mean levels of fine particulate matter (e.g., PM2.5 and PM10) in cities (population weighted).
These indicators can be used to measure progress towards reducing deaths and illnesses from pollution, promoting social and economic inclusion, and improving air quality in cities.
Overall, the article highlights the disparities in exposure to toxic pollutants, particularly air pollution, between low-income neighborhoods and wealthier communities. It emphasizes the need for accurate and granular data to understand these disparities and their impact on public health. The research conducted by Jason G. Su and his team provides a detailed picture of air pollution disparities at a neighborhood level in California. The findings reveal that disadvantaged communities, often located near industrial facilities and major roadways, are consistently exposed to higher air pollution concentrations. However, the study also shows a decline in overall disparities related to certain pollutants, indicating progress in reducing exposure gaps. The article mentions the importance of addressing air pollution’s impact on health, particularly among vulnerable populations, and highlights future studies that will further explore the health effects of air pollution.
Source: publichealth.berkeley.edu
![]()


