What does poverty look like in the Comox Valley? – Vancouver Island Free Daily

Report on the Comox Valley Poverty Reduction Initiative: The “Data Walk”
Introduction
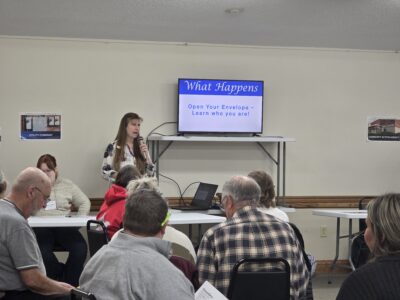
A new community initiative, “Thriving Together, Comox Valley’s Poverty Reduction Table,” has been launched to inform residents about the realities of local poverty. This project, a strategic partnership between The Comox Valley Community Health Network (CVCHN) and the Comox Valley Regional District (CVRD), utilizes an informational display known as the “Data Walk.” The initiative is designed to foster a deeper understanding of socio-economic challenges within the region and mobilize community action in alignment with global development objectives.
Initiative Objectives and Methodology
The primary objective of the Data Walk is to educate and engage the community on the root causes and extent of poverty in the Comox Valley. This is achieved through an interactive and engaging display of data-driven posters.
- Inform: To present localized data on critical issues such as access to affordable childcare, the risk of homelessness, living wage requirements, and food insecurity.
- Engage: To create a platform for conversation and reflection, allowing participants to share reactions and thoughts via QR codes linked to feedback forms.
- Mobilize: To empower community members to explore and participate in strategies aimed at reducing and ultimately eliminating poverty.
Alignment with United Nations Sustainable Development Goals (SDGs)
The Comox Valley Poverty Data Walk directly supports the achievement of several key Sustainable Development Goals (SDGs) by translating global ambitions into local, measurable action.
- SDG 1: No Poverty: The initiative’s core mission is the reduction and elimination of poverty, addressing the primary target of this goal at a community level.
- SDG 2: Zero Hunger: By displaying data on local food insecurity, the project raises awareness and encourages solutions to ensure all residents have access to sufficient and nutritious food.
- SDG 3: Good Health and Well-being: The leadership of the Comox Valley Community Health Network underscores the link between poverty and health outcomes, aiming to build a “healthy, thriving, resilient community.”
- SDG 8: Decent Work and Economic Growth: The focus on the “living wage” highlights the importance of fair compensation for sustainable livelihoods, a key component of decent work.
- SDG 10: Reduced Inequalities: The Data Walk exposes the disparities within the community, generating discussion and action to address the root causes of inequality.
- SDG 11: Sustainable Cities and Communities: By addressing local challenges such as the risk of being unhoused, the initiative contributes to making the Comox Valley more inclusive, safe, and resilient.
- SDG 17: Partnerships for the Goals: The collaboration between the CVCHN, the CVRD, local organizations, businesses, and government exemplifies the multi-stakeholder partnership model essential for achieving the SDGs.
Implementation and Community Access
The Data Walk is accessible to the public from August through October through multiple channels to ensure broad community reach.
Access Points:
- Physical Locations: Displays are situated in various indoor and outdoor public spaces, including municipal parks (Civic Park, Comox), trails (Idiens Trail, Courtenay), the Comox Valley Farmers’ Market, the Black Creek Fall Fair, and locations on Denman and Hornby Islands.
- Virtual Access: A complete virtual experience of the Data Walk is available online at EngageComoxValley.ca/PovertyReduction.
- Feedback and Information: Community members can provide feedback through the virtual portal or contact the Comox Valley Regional District directly for information on locations and how to contribute ideas.
Conclusion
The “Thriving Together” Data Walk serves as a critical tool for community education and mobilization. By grounding the abstract concept of poverty in local data, the initiative effectively connects community challenges to the global framework of the Sustainable Development Goals. It aims to foster a collective commitment to creating a sustainable and equitable future for all residents of the Comox Valley, where the root causes of poverty are eliminated. Interested parties can find more information at www.CVCHN.ca.
1. Which SDGs are addressed or connected to the issues highlighted in the article?
The article highlights several interconnected issues that directly relate to the following Sustainable Development Goals (SDGs):
- SDG 1: No Poverty – The central theme of the article is the “Thriving Together, Comox Valley’s Poverty Reduction Table” and its “Data Walk” initiative, which aims to inform the community about the reality of living in poverty and explore ways to reduce and eliminate it.
- SDG 2: Zero Hunger – The article explicitly mentions that the Data Walk includes information on “food insecurity,” which is a primary focus of SDG 2.
- SDG 11: Sustainable Cities and Communities – The issue of housing is directly addressed, with the article stating the Data Walk shares information on the “risk of being unhoused” and poses the question, “How many people are unhoused or at risk of being unhoused?”.
2. What specific targets under those SDGs can be identified based on the article’s content?
Based on the specific issues discussed in the article, the following targets can be identified:
-
SDG 1: No Poverty
- Target 1.2: “By 2030, reduce at least by half the proportion of men, women and children of all ages living in poverty in all its dimensions according to national definitions.”
- Explanation: The entire initiative described in the article, the “Comox Valley’s Poverty Reduction Table,” is focused on reducing and eliminating poverty in the region. The Data Walk’s purpose is to “inform community members about the reality of living in poverty” and asks the question, “how many households live under the poverty line?”, which directly aligns with the goal of reducing the proportion of people living in poverty.
-
SDG 2: Zero Hunger
- Target 2.1: “By 2030, end hunger and ensure access by all people, in particular the poor and people in vulnerable situations, including infants, to safe, nutritious and sufficient food all year round.”
- Explanation: The article states that the Data Walk displays information on “food insecurity.” This term directly relates to the challenge of ensuring people have access to sufficient food, which is the core objective of Target 2.1.
-
SDG 11: Sustainable Cities and Communities
- Target 11.1: “By 2030, ensure access for all to adequate, safe and affordable housing and basic services and upgrade slums.”
- Explanation: The article highlights housing as a key issue by mentioning the “risk of being unhoused” and posing the question, “How many people are unhoused or at risk of being unhoused?”. This directly addresses the challenge of ensuring access to adequate and affordable housing as outlined in Target 11.1.
3. Are there any indicators mentioned or implied in the article that can be used to measure progress towards the identified targets?
The article implies several indicators through the specific data points and questions mentioned in the “Data Walk” initiative:
-
For Target 1.2 (Reduce poverty)
- Implied Indicator 1.2.1: “Proportion of population living below the national poverty line, by sex and age.”
- Explanation: The article mentions that the Data Walk prompts participants to reflect on “how many households live under the poverty line?”. This question directly corresponds to measuring the proportion of the population living in poverty, which is the essence of Indicator 1.2.1.
-
For Target 2.1 (End hunger)
- Implied Indicator 2.1.2: “Prevalence of moderate or severe food insecurity in the population, based on the Food Insecurity Experience Scale (FIES).”
- Explanation: The article explicitly states that the Data Walk shares information on “food insecurity.” Measuring the prevalence of food insecurity is the direct purpose of Indicator 2.1.2.
-
For Target 11.1 (Access to adequate housing)
- Implied Indicator 11.1.1: “Proportion of urban population living in slums, informal settlements or inadequate housing.”
- Explanation: The article’s focus on the “risk of being unhoused” and the question “How many people are unhoused or at risk of being unhoused?” directly relates to measuring the proportion of the population without adequate housing, which is what Indicator 11.1.1 aims to track. The term “unhoused” is a direct reference to a lack of adequate housing.
4. Table of SDGs, Targets, and Indicators
| SDGs | Targets | Indicators (Implied from the Article) |
|---|---|---|
| SDG 1: No Poverty | 1.2: Reduce at least by half the proportion of people living in poverty in all its dimensions according to national definitions. | 1.2.1: Proportion of population living below the national poverty line (implied by the question “how many households live under the poverty line?”). |
| SDG 2: Zero Hunger | 2.1: End hunger and ensure access by all people to safe, nutritious and sufficient food all year round. | 2.1.2: Prevalence of moderate or severe food insecurity in the population (implied by the mention of “food insecurity” as a data point). |
| SDG 11: Sustainable Cities and Communities | 11.1: Ensure access for all to adequate, safe and affordable housing and basic services. | 11.1.1: Proportion of population living in inadequate housing (implied by the question “How many people are unhoused or at risk of being unhoused?”). |
Source: vancouverislandfreedaily.com

What is Your Reaction?
 Like
0
 Dislike
0
 Love
0
 Funny
0
 Angry
0
 Sad
0
Sad
0
 Wow
0
Wow
0


