


;Resize=620#)


Paying With Their Time: Increasing Traffic Congestion Erodes Benefits of Boston’s Fare-Free Buses – Streetsblog Massachusetts

Report on Boston’s Fare-Free Bus Service and Sustainable Development Goal Alignment
Introduction and Key Findings
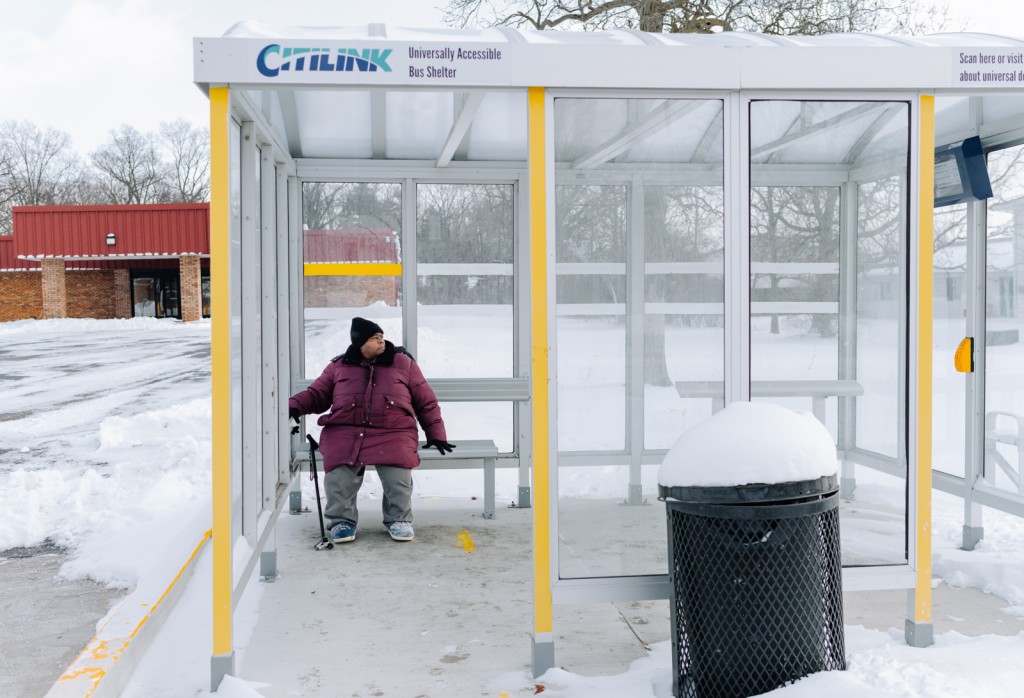
An analysis of Boston’s fare-free bus program, based on data from TransitMatters, reveals significant operational inefficiencies that undermine the program’s benefits and conflict with key Sustainable Development Goals (SDGs). The fare-free routes 23 and 28, serving the Roxbury and Mattapan neighborhoods, are now among the slowest in the entire Massachusetts Bay Transportation Authority (MBTA) system. The economic cost of time lost to delays frequently negates the financial savings of the free fare, disproportionately impacting residents in predominantly Black neighborhoods.
- Extreme Slowness: Routes 23 and 28 register average speeds of only 6.6 and 6.7 mph, respectively.
- Service Degradation: The average travel time on Route 28 increased by eight minutes between 2023 and 2024.
- Negative Economic Impact: The value of time lost in traffic often exceeds the $1.70 fare, creating a net loss for many riders.
- Equity Concerns: The service failures are concentrated in routes serving Boston’s Black communities, exacerbating inequality and directly challenging the objectives of SDG 10.
Analysis of Performance and Economic Impact
Bus Route Speed and Reliability
The performance of the fare-free routes has declined significantly. The “Pokey/Schleppie Awards” report from TransitMatters highlights the following data points:
- Route 28 Performance Decline: The average speed of Route 28, the MBTA’s busiest, dropped from 8.5 mph in 2023 to 6.7 mph in 2024. This extended the average 4.3-mile journey between Nubian and Mattapan Squares by eight minutes.
- System-Wide Congestion: From fall 2021 to fall 2025, average scheduled trip times for the MBTA’s 10 highest-ridership routes increased by 15 percent due to roadway congestion.
Economic Implications and SDG 8: Decent Work and Economic Growth
The severe delays have direct economic consequences for riders, undermining SDG 8 (Decent Work and Economic Growth). For any passenger whose time is valued at the state minimum wage of $15 per hour, the cost of an additional eight-minute delay is approximately $2.00, which is greater than the $1.70 fare savings. This lost time represents lost wages, reduced productivity, and a significant barrier to accessing economic opportunities, particularly for low-income individuals who rely on public transit.
Alignment with Sustainable Development Goals (SDGs)
SDG 10: Reduced Inequalities
The operational failures of the bus service in Roxbury and Mattapan represent a severe misalignment with SDG 10 (Reduced Inequalities). Data indicates a significant racial disparity in transit service quality.
- Pre-pandemic research found that Black bus riders in Boston spent an average of 64 more hours per year on MBTA buses than their white counterparts.
- Nine of the ten slowest bus routes identified in the 2024 report travel through Roxbury, one of Boston’s most densely populated Black neighborhoods.
This inequitable distribution of service quality perpetuates systemic disadvantages and widens the racial disparity gap within the city.
SDG 11: Sustainable Cities and Communities
The goal of providing fare-free transit is consistent with SDG 11.2, which calls for “safe, affordable, accessible and sustainable transport systems for all.” However, a transport system that is profoundly unreliable and slow fails to meet the definition of sustainable or effective. The current state of the service does not provide a viable alternative to private vehicles, thereby failing to contribute to the broader goals of creating sustainable urban environments.
Causal Factors and Infrastructure Deficiencies
The Role of Dedicated Bus Lanes
A primary factor contributing to the slow speeds is the lack of dedicated bus infrastructure. Other high-ridership MBTA routes that are not on the “slowest” list, such as the 111, Silver Line 3, and 57, benefit from dedicated bus lanes for significant portions of their routes. In contrast, the 23 and 28 routes, despite being the third-busiest and busiest in the system, lack this critical infrastructure and are therefore subject to general traffic congestion.
Delays in Infrastructure Projects
Plans to address these deficiencies have stalled, indicating a failure in project execution. Key projects that would directly benefit the affected communities remain unimplemented:
- Proposed bus lanes on Warren Street.
- A center-running transitway on Blue Hill Avenue.
- An extended transitway on Columbus Avenue.
Notably, the Blue Hill Avenue project received a major federal grant in 2021 but, four years later, remains in the early conceptual design phase. This delay prevents the realization of benefits for riders and the fulfillment of the city’s equity and sustainability commitments.
Conclusion
While the intention behind Boston’s fare-free bus program is to enhance equity and accessibility, its implementation is critically flawed by a lack of investment in supporting infrastructure. The resulting service is so slow and unreliable that it imposes significant time and economic costs on its riders, undermining the program’s goals. This failure has profound implications for sustainable urban development, directly contradicting the principles of SDG 8 (Decent Work and Economic Growth), SDG 10 (Reduced Inequalities), and SDG 11 (Sustainable Cities and Communities). Without immediate and decisive action to implement dedicated bus lanes and other transit priority measures, the service will continue to exacerbate the very inequalities it was designed to alleviate.
Analysis of Sustainable Development Goals in the Article
1. Which SDGs are addressed or connected to the issues highlighted in the article?
-
SDG 10: Reduced Inequalities
- The article directly addresses racial inequality in public transportation. It highlights that the slowest bus routes predominantly serve Black neighborhoods like Roxbury and Mattapan. It cites a pre-pandemic study showing that Black bus riders spent significantly more time (64 hours per year) on buses compared to white riders, which points to a clear inequality of outcome based on race and geographic location.
-
SDG 11: Sustainable Cities and Communities
- The core subject of the article is the quality and accessibility of public transportation in an urban environment (Boston). It discusses the inefficiency of the bus system, the impact of traffic congestion, and the need for infrastructure like dedicated bus lanes to create a more sustainable and efficient transport system for city residents.
-
SDG 8: Decent Work and Economic Growth
- The article connects the inefficiency of the bus system to economic productivity. It quantifies the cost of wasted time for riders, stating that for anyone earning minimum wage, the economic loss from delays outweighs the savings from fare-free rides. The 64 additional hours spent on buses by Black riders is framed as the equivalent of “8 full working days’ worth of lost wages every year,” directly linking transit quality to economic well-being and productivity.
-
SDG 9: Industry, Innovation and Infrastructure
- The article examines the quality and reliability of public transit infrastructure. The discussion of slow bus speeds, increased travel times, and the delayed implementation of infrastructure projects like the Blue Hill Avenue transitway points to a failure to develop quality, reliable, and equitable infrastructure to support the city’s population.
2. What specific targets under those SDGs can be identified based on the article’s content?
-
Under SDG 10 (Reduced Inequalities):
- Target 10.2: “By 2030, empower and promote the social, economic and political inclusion of all, irrespective of age, sex, disability, race, ethnicity, origin, religion or economic or other status.” The article shows how the current state of the bus system disproportionately affects residents in Black neighborhoods, creating a barrier to economic inclusion by costing them valuable time and money. The unreliability of the service perpetuates geographic and racial segregation.
- Target 10.3: “Ensure equal opportunity and reduce inequalities of outcome…” The fact that “nine out of the 10 slowest bus routes” serve a predominantly Black neighborhood demonstrates a clear inequality of outcome in public service delivery. The article implies that policy decisions, such as removing bus lanes in other areas and delaying projects in Roxbury, contribute to this unequal outcome.
-
Under SDG 11 (Sustainable Cities and Communities):
- Target 11.2: “By 2030, provide access to safe, affordable, accessible and sustainable transport systems for all…” The article focuses on the failure to provide an “accessible and sustainable” transport system. While the fare-free program addresses affordability, the extreme slowness of the buses makes the system inaccessible for those who need to be on time, as articulated by the student Osvaldo Cabral. The system’s inefficiency due to congestion makes it unsustainable for meeting the community’s needs.
-
Under SDG 8 (Decent Work and Economic Growth):
- Target 8.2: “Achieve higher levels of economic productivity through diversification, technological upgrading and innovation…” The article illustrates how poor infrastructure directly hampers economic productivity. The wasted time on slow buses represents a significant loss of productive hours for the workforce, directly contradicting the goal of achieving higher productivity levels.
-
Under SDG 9 (Industry, Innovation and Infrastructure):
- Target 9.1: “Develop quality, reliable, sustainable and resilient infrastructure… with a focus on affordable and equitable access for all.” The MBTA bus system, as described, is not “quality” or “reliable” for residents of Roxbury and Mattapan. The article highlights the lack of equitable access to efficient service, as other bus routes with dedicated lanes are not on the “Pokey/Schleppie” list, while the busiest routes serving Black neighborhoods lack this critical infrastructure.
3. Are there any indicators mentioned or implied in the article that can be used to measure progress towards the identified targets?
- Average bus speed: The article explicitly states the average speeds of the fare-free 23 and 28 buses are 6.6 mph and 6.7 mph, respectively. It also notes the speed of the 28 bus decreased from 8.5 mph in 2023. This is a direct indicator of transport efficiency.
- Travel time and delays: The article quantifies the increase in travel time, stating that the trip between Nubian and Mattapan Squares is now “8 minutes longer” than in 2023. This measures the reliability and quality of the service.
- Disparity in travel time by race: The statistic that “Black bus riders in the Boston area spent an average of 64 more hours per year on MBTA buses when compared to their bus riders who were white” is a powerful indicator for measuring racial inequality in access to public services (Target 10.3).
- Economic cost of wasted time: The article provides a framework for an indicator by calculating that “the cost of those longer bus trips outweighs the $1.70 savings” for anyone earning minimum wage. This measures the economic impact of inefficient transit on individuals (Target 8.2).
- Geographic distribution of service quality: The finding that “nine out of the 10 slowest bus routes identified in the Pokey/Schleppie report pass through Roxbury” serves as an indicator of inequitable infrastructure and service distribution (Target 9.1 and 10.3).
- Ridership numbers: The article mentions that the 28 and 23 routes are the “busiest” and “third-busiest” routes, respectively. This data, when correlated with service quality indicators like speed, helps measure whether the system is adequately serving high-demand areas.
4. Summary Table of SDGs, Targets, and Indicators
| SDGs | Targets | Indicators |
|---|---|---|
| SDG 10: Reduced Inequalities | 10.2: Promote social and economic inclusion of all, irrespective of race or ethnicity.
10.3: Ensure equal opportunity and reduce inequalities of outcome. |
|
| SDG 11: Sustainable Cities and Communities | 11.2: Provide access to safe, affordable, accessible, and sustainable transport systems for all. |
|
| SDG 8: Decent Work and Economic Growth | 8.2: Achieve higher levels of economic productivity. |
|
| SDG 9: Industry, Innovation and Infrastructure | 9.1: Develop quality, reliable, sustainable, and resilient infrastructure with a focus on equitable access for all. |
|
Source: mass.streetsblog.org
What is Your Reaction?
 Like
0
Like
0
 Dislike
0
Dislike
0
 Love
0
Love
0
 Funny
0
Funny
0
 Angry
0
Angry
0
 Sad
0
Sad
0
 Wow
0
Wow
0