Continent-wide DNA analysis of soil eukaryotes reveals cropland biodiversity
Continent-wide DNA analysis of soil eukaryotes reveals cropland ... EU Science Hub

Little is known about soil organisms
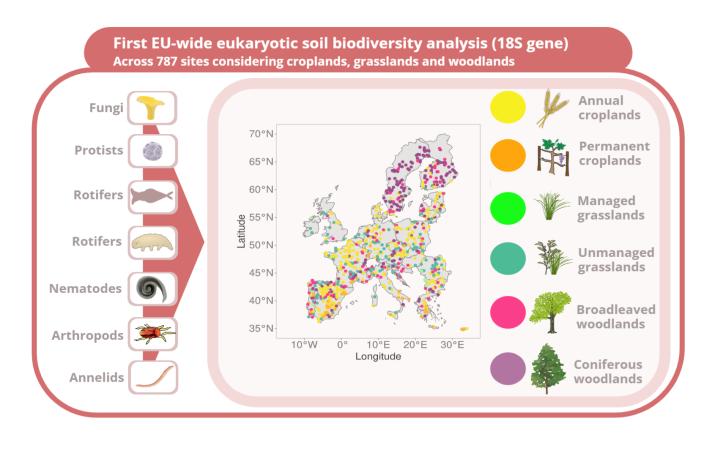
Little is known about the organisms that live in our soils. In recent years, DNA analyses have helped to better understand soil life. However, the majority of studies focused on microbial communities (bacteria and fungi). A first-ever continent-wide DNA-analysis investigated the diversity of soil eukaryotes. Soil life comprises prokaryotes (bacteria and archaea) and eukaryotes (fungi, protists, rotifers, tardigrades, nematodes, arthropods and earthworms).
Study aims to identify drivers of soil eukaryotic diversity
The study, Ecosystem type drives eukaryotic soil biodiversity across Europe, carried out by JRC soil and partner scientists, aimed to identify the drivers behind soil eukaryotic diversity by investigating (among others) soil properties, climate and ecosystem type. The study considered sites ranging from croplands, managed and unmanaged grasslands and coniferous and broad-leaved woodlands.
Importance of soil life for terrestrial ecosystems
There has been a growing recognition of the crucial role played by soil biodiversity in maintaining ecosystem services. Prokaryotes (bacteria and archaea) and eukaryotes (fungi, protists, rotifers, tardigrades, nematodes, arthropods and earthworms) form a complex and dynamic network.
- They decompose organic material
- They provide antibiotics
- They allow soils to filter and store water
- They provide nutrients to plants and enhance their resilience to stressors
- They suppress soil-borne pathogens and pests
Need for more knowledge on soil life
For the past decades, molecular analysis of DNA has helped reveal the hidden realm of soil life. Soils are among the most diverse habitats on Earth. They are teeming with a diverse array of organisms, ranging from microorganisms (bacteria, fungi and protists) and microfauna (rotifers, nematodes and tardigrades), to mesofauna (mites, collembola and enchytraeids) and macrofauna (earthworms and larger insects), up to megafauna, including mice and moles (Orgiazzi et al., 2016).
However, the heterogeneous nature of soil life makes it difficult to comprehend the distribution patterns of soil organisms, especially at large, continental scale. Understanding the relationships between soil life and its environment is crucial for maintaining healthy soils.
Currently, there is no baseline for soil organisms that is comparable to above-ground organisms. Only known organisms can be monitored and integrated into conservation activities, like being included in a “red” list. Therefore, missing baselines prevent conservation activities.
Ecosystem type driving the diversity
In this context, the JRC-led study finds the ecosystem type to be the dominant driver of eukaryotic diversity. The findings also show that soil properties are more influential than climatic variables. Long-term variables for climate and land-use were found to be more important than variables measured over the sampling month.
The study was published in Global Change Biology by the JRC’s Soil Team and partner scientists, mainly from the University of Vigo, in the framework of JRC’s initiative Collaborative Doctoral Partnership.
First EU-wide eukaryotic soil biodiversity analysis
© EU, 2023
Greatest diversity in croplands as a legacy effect of past land uses
Surprisingly, croplands exhibited greater biodiversity despite intensive land use. Croplands were also more homogeneous compared to the composition of other ecosystems. High numbers of taxa of eukaryotic groups overlapped in croplands, grasslands and woodlands. For the majority of the groups, croplands hosted the most unique taxa.
The study proposes a possible explanation for the greater diversity detected in agricultural areas. In recent decades, many grasslands and woodlands across Europe were converted into croplands. The high diversity observed in croplands and the great proportion of overlapping taxa between ecosystems might reflect DNA accumulation from previous land uses.
The higher soil biodiversity in croplands could be a legacy effect from the DNA of dormant or dead organisms. This might also explain why long-term variables for land use and climate were more relevant compared to monthly variables.
The way forward: learnings for future monitoring activities
The study provides a first baseline of soil eukaryotes and their drivers to inform future monitoring activities. It also reveals methodological limitations to DNA analysis. For example, the current method does not differentiate between the DNA of living
SDGs, Targets, and Indicators
SDGs Addressed:
- SDG 15: Life on Land
Specific Targets:
- Target 15.1: By 2020, ensure the conservation, restoration, and sustainable use of terrestrial and inland freshwater ecosystems and their services, in particular forests, wetlands, mountains, and drylands, in line with obligations under international agreements.
- Target 15.5: Take urgent and significant action to reduce the degradation of natural habitats, halt the loss of biodiversity, and protect and prevent the extinction of threatened species.
Indicators:
- Indicator 15.1.1: Forest area as a proportion of total land area.
- Indicator 15.5.1: Red List Index.
Explanation:
1. The issues highlighted in the article are connected to SDG 15: Life on Land. The article discusses the importance of soil biodiversity and its role in maintaining ecosystem services and supporting terrestrial life.
2. Based on the article’s content, the specific targets under SDG 15 that can be identified are Target 15.1 (conservation and sustainable use of terrestrial ecosystems) and Target 15.5 (reducing habitat degradation and protecting threatened species).
3. The article does not explicitly mention any indicators related to the identified targets. However, Indicator 15.1.1 (forest area as a proportion of total land area) can be relevant to measuring progress towards Target 15.1, as forests are part of terrestrial ecosystems. Indicator 15.5.1 (Red List Index) can be used to measure progress towards Target 15.5, as it assesses the extinction risk of species.
4. Table:
| SDGs | Targets | Indicators |
|————|————–|————-|
| SDG 15 | Target 15.1: By 2020, ensure the conservation, restoration, and sustainable use of terrestrial and inland freshwater ecosystems and their services, in particular forests, wetlands, mountains, and drylands, in line with obligations under international agreements. | Indicator 15.1.1: Forest area as a proportion of total land area. |
| SDG 15 | Target 15.5: Take urgent and significant action to reduce the degradation of natural habitats, halt the loss of biodiversity, and protect and prevent the extinction of threatened species. | Indicator 15.5.1: Red List Index. |
Behold! This splendid article springs forth from the wellspring of knowledge, shaped by a wondrous proprietary AI technology that delved into a vast ocean of data, illuminating the path towards the Sustainable Development Goals. Remember that all rights are reserved by SDG Investors LLC, empowering us to champion progress together.
Source: joint-research-centre.ec.europa.eu
![]()
Join us, as fellow seekers of change, on a transformative journey at https://sdgtalks.ai/welcome, where you can become a member and actively contribute to shaping a brighter future.


