Planning for Accessibility: Proximity is More Important than Mobility
Planning for Accessibility: Proximity is More Important than Mobility Planetizen
We are currently in a paradigm shift from mobility- to accessibility-based planning
We are currently in a paradigm shift from mobility- to accessibility-based planning, changing how we define transportation problems and evaluate potential solutions. Mobility-based planning assumes that the goal is to maximize the speed and distance that people can travel. Accessibility-based planning recognizes that mobility is seldom an end in itself; the ultimate goal of most travel is to access services and activities. Many factors can affect this ability including mobility, transportation system connectivity, proximity, user information, affordability, and mobility substitutes that reduce the need for physical travel.
Old (Mobility-Based)
- Mobility (vehicle traffic speeds)
New (Accessibility-Based)
- Vehicle traffic speeds
- Non-auto travel conditions
- Transport network connectivity
- Proximity (distances between destinations)
- User information
- Affordability
- Mobility substitutes (telecommunications and delivery services)
The old paradigm assumed that the goal is to maximize mobility. The new paradigm recognizes that our ultimate goal is to maximize accessibility so an efficient transportation system minimizes the distances that people must travel to reach desired services and activities.
A Better Understanding of Smart Growth Benefits
My recent column, A Better Understanding of Smart Growth Benefits, examined the various benefits of compact, multimodal communities. One of the largest benefits is increased accessibility, particularly for non-drivers. Smart Growth communities have less mobility — people drive less and rely more on slower modes, traffic speeds are lower, trips are shorter, and people travel fewer miles — but they have more total accessibility and less disparity between drivers and non-drivers. Smart Growth communities provide better access by non-auto modes than what is provided by automobile travel in automobile-dependent, sprawled areas, at a fraction of the financial cost. Let’s examine this bold claim.
Evaluating Accessibility in the Chicago Region
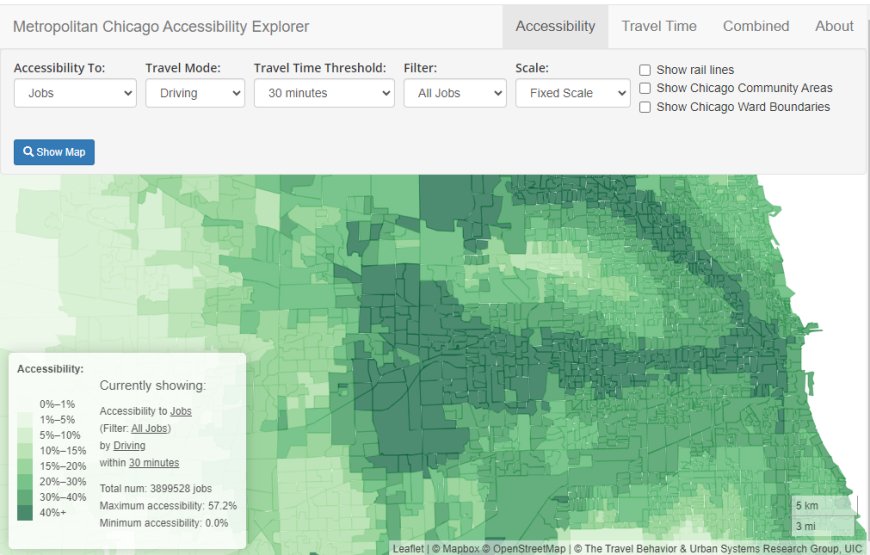
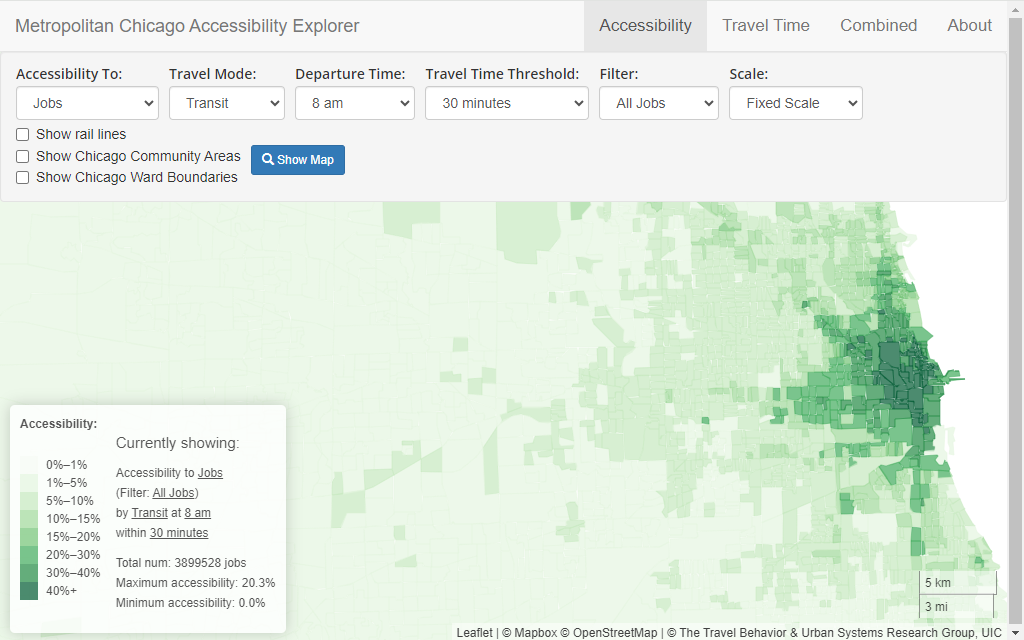
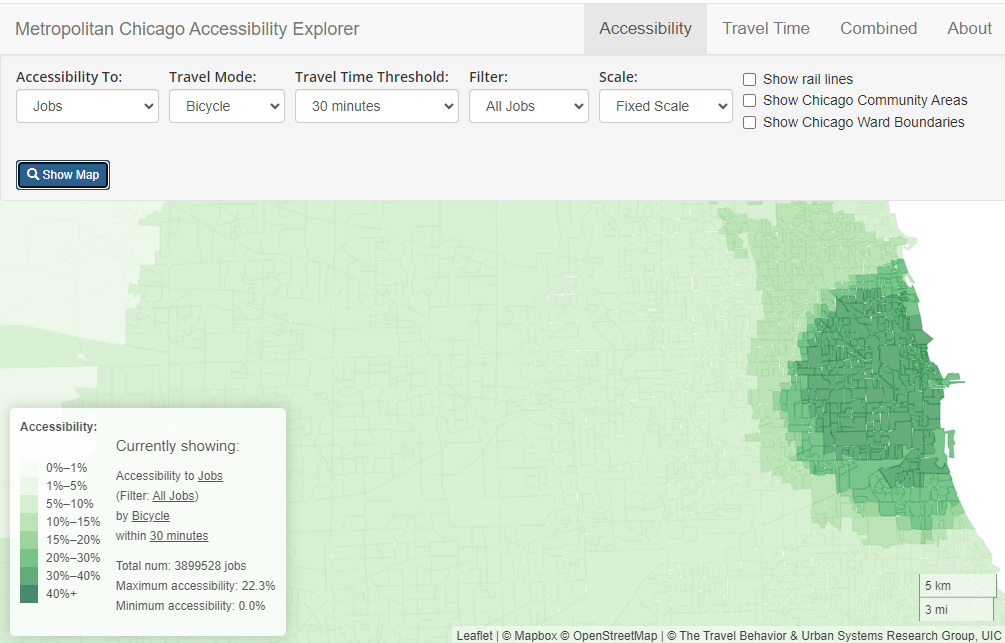
A good tool for evaluating accessibility is the Accessibility Explorer which heatmaps the number of services and activities that can be reached within a defined time period by various modes in the Chicago region. For example, it can report the number of jobs, grocery stores, schools, hospitals, libraries, parks, or fire stations that a person can reach within 20, 30, or 60 minutes by walking, bicycling, public transit, or driving, from any block group.
Automobile accessibility

Transit accessibility
Bicycling accessibility
Job Access and Commute Duration
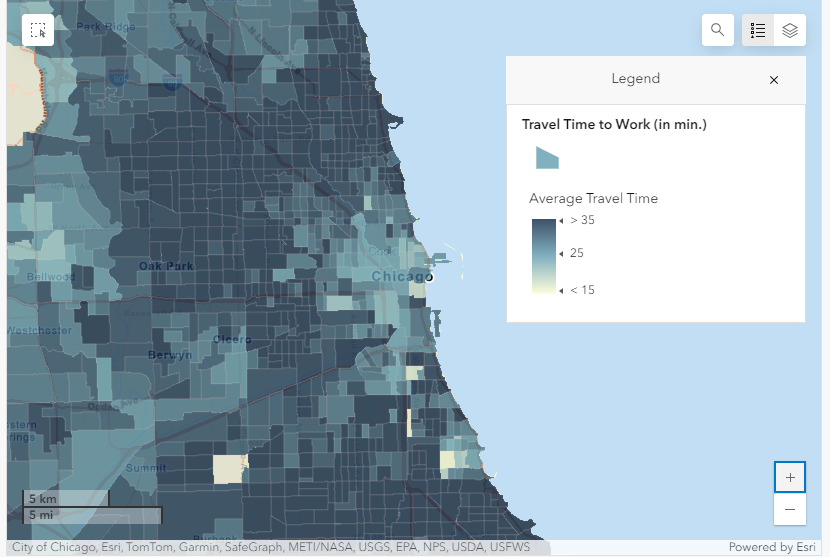
Another indicator of job access is commute duration, the number of minutes workers must spend traveling to jobs. The Commute Duration Dashboard heatmaps this information, as illustrated below. It shows that central neighborhood workers spend as much time commuting as those in outlying areas, despite higher non-auto mode shares (they rely more on slower modes such as walking and public transit) and more intense traffic congestion.
Chicago-area commute durations
Proximity and Walkability
Of course, worksites are only one of many activities that people must access. In fact, commuting represents less than 20 percent of total trips and this is declining due to more telecommuting and working at home. The Walk Score is a good indicator of access to commonly-used services such as shops, restaurants, and bars. A Walk Score over 70, shown in dark green in the following heatmap, indicates that numerous services are located within
SDGs, Targets, and Indicators
1. Which SDGs are addressed or connected to the issues highlighted in the article?
- SDG 11: Sustainable Cities and Communities
- SDG 9: Industry, Innovation, and Infrastructure
- SDG 10: Reduced Inequalities
2. What specific targets under those SDGs can be identified based on the article’s content?
- SDG 11.2: By 2030, provide access to safe, affordable, accessible, and sustainable transport systems for all.
- SDG 9.1: Develop quality, reliable, sustainable, and resilient infrastructure, including regional and transborder infrastructure, to support economic development and human well-being.
- SDG 10.2: By 2030, empower and promote the social, economic, and political inclusion of all, irrespective of age, sex, disability, race, ethnicity, origin, religion or economic or other status.
3. Are there any indicators mentioned or implied in the article that can be used to measure progress towards the identified targets?
- Number of services and activities that can be reached within a defined time period by various modes of transportation (e.g., walking, bicycling, public transit, driving)
- Percentage of regional jobs accessible within a certain commuting time by different modes of transportation
- Commute duration for workers in different areas
- Walk Score indicating access to commonly-used services within walking distance
Table: SDGs, Targets, and Indicators
| SDGs | Targets | Indicators |
|---|---|---|
| SDG 11: Sustainable Cities and Communities | 11.2: By 2030, provide access to safe, affordable, accessible, and sustainable transport systems for all. | – Number of services and activities that can be reached within a defined time period by various modes of transportation. – Percentage of regional jobs accessible within a certain commuting time by different modes of transportation. – Commute duration for workers in different areas. – Walk Score indicating access to commonly-used services within walking distance. |
| SDG 9: Industry, Innovation, and Infrastructure | 9.1: Develop quality, reliable, sustainable, and resilient infrastructure, including regional and transborder infrastructure, to support economic development and human well-being. | – Number of services and activities that can be reached within a defined time period by various modes of transportation. – Percentage of regional jobs accessible within a certain commuting time by different modes of transportation. – Commute duration for workers in different areas. – Walk Score indicating access to commonly-used services within walking distance. |
| SDG 10: Reduced Inequalities | 10.2: By 2030, empower and promote the social, economic, and political inclusion of all, irrespective of age, sex, disability, race, ethnicity, origin, religion or economic or other status. | – Number of services and activities that can be reached within a defined time period by various modes of transportation. – Percentage of regional jobs accessible within a certain commuting time by different modes of transportation. – Commute duration for workers in different areas. – Walk Score indicating access to commonly-used services within walking distance. |
Behold! This splendid article springs forth from the wellspring of knowledge, shaped by a wondrous proprietary AI technology that delved into a vast ocean of data, illuminating the path towards the Sustainable Development Goals. Remember that all rights are reserved by SDG Investors LLC, empowering us to champion progress together.
Source: planetizen.com
![]()
Join us, as fellow seekers of change, on a transformative journey at https://sdgtalks.ai/welcome, where you can become a member and actively contribute to shaping a brighter future.


