The 1990s Paradox (at Least to Some): Rising Income Inequality, Falling Concern
The 1990s Paradox (At Least to Some): Rising Income Inequality, Falling Concern American Enterprise Institute


Concerns about Income Inequality and the Sustainable Development Goals
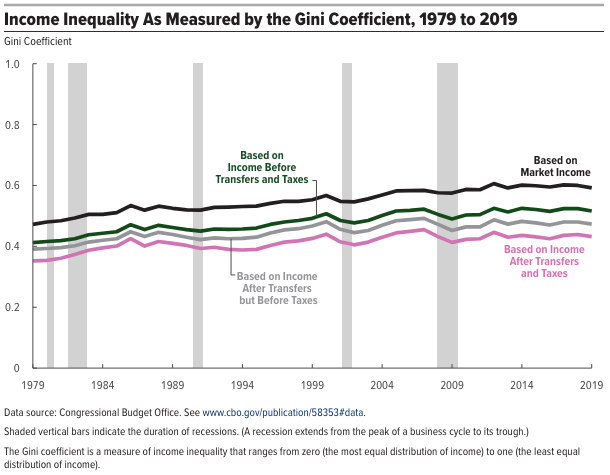
Income inequality is a topic that is frequently discussed in national conversations. However, it is important to approach this issue in a serious and analytical manner. While many believe that the gap between the rich and the poor continues to widen, there is evidence that challenges this perception. According to the Congressional Budget Office (CBO), when looking at inequality based on post-tax-and-transfer income, which provides a comprehensive view of income by considering all economic resources available to individuals, income inequality grew by seven percent from 1990 to 2019. However, this increase occurred solely between 1990 and 2007, as inequality has actually decreased by five percent since 2007.
Research on Income Inequality
In addition to the CBO’s findings, recent research conducted by Gerald Auten of the US Treasury Department and David Splinter of the Congressional Joint Committee on Taxation sheds further light on income inequality. Auten and Splinter focus on the impact of the 1986 tax reform, which aimed to reduce the ability of wealthy individuals to use tax shelters to lower their reported income and tax liabilities. This reform resulted in an apparent increase in top incomes.
Furthermore, Auten and Splinter made adjustments to the methodology used by renowned inequality scholars Thomas Piketty, Emmanuel Saez, and Gabriel Zucman. These adjustments include focusing on individuals rather than tax units (typically households filing a single tax return) and incorporating employer-provided benefits, such as health insurance, in their calculations. Overall, Auten and Splinter found that the top one percent of earners accounted for approximately nine percent of national income in 2019, compared to the 15 percent reported by Piketty, Saez, and Zucman. This suggests that there has been minimal change in the share of income held by the top one percent since the 1960s, in contrast to the significant increase found by Piketty, Saez, and Zucman.
Public Opinion and Income Inequality
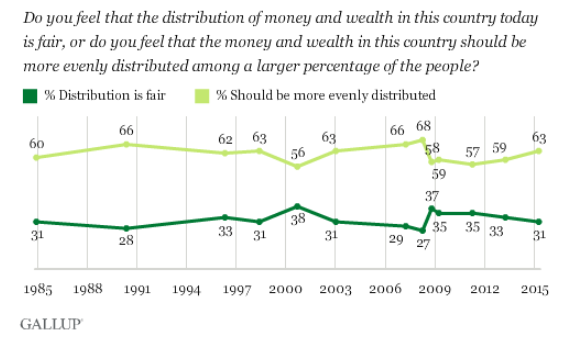
It is crucial to consider public opinion on income inequality. The CBO chart highlights a significant rise in inequality during the 1990s, a period characterized by robust economic growth, productivity, and wage increases. Surprisingly, public opinion data from that decade shows a decline in the percentage of Americans who believed that money and wealth should be more evenly distributed among a larger portion of the population. This suggests that individuals are primarily concerned with their own financial well-being rather than the income distribution among others.
As my AEI colleague, Michael Strain has written:
“Even though inequality was rising in the 1990s, average wages were also increasing; Americans were not concerned about whether they were growing faster for some groups than for others. But after the 2008 financial crisis, average wages plummeted. In fact, they fell so sharply for the bottom half of workers that it took until 2014 for the median real wage to recover its 2007 level. This prolonged period of wage stagnation fomented anger and a sense of injustice—of a ‘rigged’ economic game—which gave rise to populism.”
“The lesson is clear: people care about how they themselves are doing, and not about a group of people with whom they seldom interact. People are not as dripping with envy as the debate over inequality would have you think. Anyone concerned about the health of American democracy should be more worried about wage growth for the bottom half of workers than the income gap.”
These findings suggest that if individuals perceive their own financial situation to be improving, they may not be as concerned about the relative income growth of others. The focus should therefore be on promoting wage growth for the bottom half of workers, as this is more crucial for the well-being of American democracy.
SDGs, Targets, and Indicators Analysis
1. Which SDGs are addressed or connected to the issues highlighted in the article?
- SDG 1: No Poverty
- SDG 8: Decent Work and Economic Growth
- SDG 10: Reduced Inequalities
The article addresses income inequality and its impact on different groups of people, which is connected to SDG 1 (No Poverty) and SDG 10 (Reduced Inequalities). It also discusses wage growth for the bottom half of workers, which is related to SDG 8 (Decent Work and Economic Growth).
2. What specific targets under those SDGs can be identified based on the article’s content?
- Target 1.4: By 2030, ensure that all men and women, in particular the poor and the vulnerable, have equal rights to economic resources, as well as access to basic services, ownership, and control over land and other forms of property.
- Target 8.5: By 2030, achieve full and productive employment and decent work for all women and men, including for young people and persons with disabilities, and equal pay for work of equal value.
- Target 10.4: Adopt policies, especially fiscal, wage, and social protection policies, and progressively achieve greater equality.
Based on the article’s content, the targets identified are related to ensuring equal rights to economic resources (Target 1.4), achieving full and productive employment (Target 8.5), and adopting policies to achieve greater equality (Target 10.4).
3. Are there any indicators mentioned or implied in the article that can be used to measure progress towards the identified targets?
- Indicator 1.4.2: Proportion of men, women, and children of all ages living in poverty in all its dimensions according to national definitions.
- Indicator 8.5.1: Average hourly earnings of female and male employees, by occupation, age group, and persons with disabilities.
- Indicator 10.4.1: Labour share of GDP, comprising wages and social protection transfers.
The article mentions income inequality, wage growth, and the distribution of national income, which can be used as indicators to measure progress towards the identified targets. The indicators include the proportion of people living in poverty (Indicator 1.4.2), average hourly earnings (Indicator 8.5.1), and the labor share of GDP (Indicator 10.4.1).
4. Table: SDGs, Targets, and Indicators
| SDGs | Targets | Indicators |
|---|---|---|
| SDG 1: No Poverty | Target 1.4: By 2030, ensure that all men and women, in particular the poor and the vulnerable, have equal rights to economic resources, as well as access to basic services, ownership, and control over land and other forms of property. | Indicator 1.4.2: Proportion of men, women, and children of all ages living in poverty in all its dimensions according to national definitions. |
| SDG 8: Decent Work and Economic Growth | Target 8.5: By 2030, achieve full and productive employment and decent work for all women and men, including for young people and persons with disabilities, and equal pay for work of equal value. | Indicator 8.5.1: Average hourly earnings of female and male employees, by occupation, age group, and persons with disabilities. |
| SDG 10: Reduced Inequalities | Target 10.4: Adopt policies, especially fiscal, wage, and social protection policies, and progressively achieve greater equality. | Indicator 10.4.1: Labour share of GDP, comprising wages and social protection transfers. |
Behold! This splendid article springs forth from the wellspring of knowledge, shaped by a wondrous proprietary AI technology that delved into a vast ocean of data, illuminating the path towards the Sustainable Development Goals. Remember that all rights are reserved by SDG Investors LLC, empowering us to champion progress together.
Source: aei.org
![]()
Join us, as fellow seekers of change, on a transformative journey at https://sdgtalks.ai/welcome, where you can become a member and actively contribute to shaping a brighter future.


