Why does South Asia have the world’s worst air pollution?
Why does South Asia have the world’s worst air pollution? Al Jazeera English


What does the 2023 World Air Quality Report say?
The 2023 World Air Quality Report provides an overview of PM2.5 air quality data from 7,812 cities worldwide. PM2.5 refers to fine particulate matter that is 2.5 microns or smaller in diameter and can be harmful when inhaled. These particles can be released during natural events like dust storms and wildfires, or as a result of human activities such as coal burning or agricultural work.
According to the World Health Organization (WHO), the average annual levels of PM2.5 should not exceed 5 micrograms per cubic meter. However, only 10 countries listed in the report meet this standard. These countries include French Polynesia, New Zealand, Finland, and Estonia, among others.
Unfortunately, Bangladesh’s PM2.5 levels are at 79.9 micrograms per cubic meter, nearly 16 times higher than the WHO recommendation. Pakistan scored 73.7, while India’s air had 54.4 micrograms of PM2.5 particles per cubic meter on average over the last year.
How do South Asian cities rank in terms of air quality?
Within each of the South Asian countries monitored by IQAir, air quality can vary significantly from city to city.
Begusarai, the industrial and financial capital of India’s Bihar, had an average of 118.9 micrograms of PM2.5 particles per cubic meter in 2023. New Delhi had 92.7, while Dhaka in Bangladesh had 80.2 and Lahore in Pakistan recorded an average of 99.5.
A total of 83 cities in India have air with more than 10 times the recommended limit of 5 micrograms per cubic meter.
Comparatively, San Juan in Puerto Rico, the least polluted city in the world, had only 2.7 micrograms of PM2.5 particles per cubic meter on average in 2023. Wellington in New Zealand came second with 3.1 micrograms, and Canberra in Australia had 3.8 micrograms.
Why is the air quality in South Asian cities so poor?
The report found that poor air quality in South Asia is often due to “brick kiln and other industrial emissions, agricultural waste burning, and cremation practices”. The burning of solid fuel for cooking and heating, especially during colder months, also contributes to air pollution.
In Bangladesh, there are approximately 8,000 brick kilns, some of which operate illegally. Plastic rubbish incineration and vehicle fumes further contribute to the deteriorating air quality. During crop burning season, smoke from India, Nepal, and Pakistan can also drift into Bangladesh.
Northern India and Delhi have particularly poor air quality due to biomass burning, coal burning, and vehicle emissions. Annual crop burning by farmers in India and Pakistan is also a significant contributor to air pollution.
The geography of South Asia plays a role in the accumulation of air pollution. Pollutants emitted across the Indo-Gangetic Plain mix with pollutants brought in by winds from the coast and become trapped by the Himalayas bordering the north.
What is the effect of poor air in Asia?
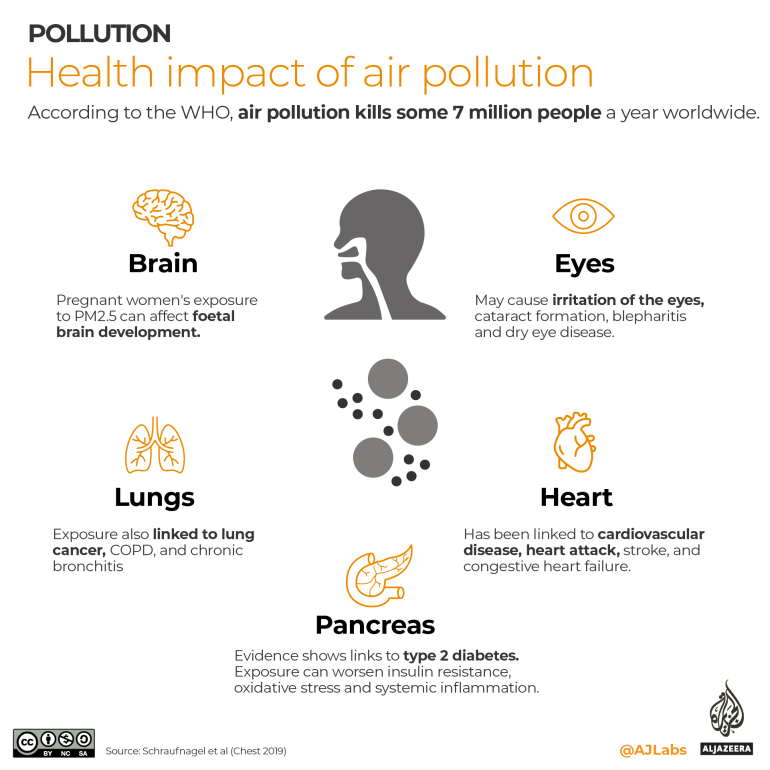
A review published by the Environmental Research Group at Imperial College London found connections between air pollution and various health issues, including the health of newborn babies, low birth weight, miscarriages, stillbirths, and hindered development.
According to the Air Quality Life Index (AQLI) published by the Energy Policy Institute at the University of Chicago, PM2.5 pollution reduces the average Indian’s life expectancy by 5.3 years. In New Delhi, life expectancy is reduced by 10 years. The report also states that if air quality in Pakistan met WHO guidelines, the average Pakistani would live for 3.9 years longer.

In addition to health effects, air pollution in Pakistan and India also impacts everyday activities such as education and business.
In November 2023, due to dangerous levels of air pollution, public places were closed in Lahore, Gujranwala, and Hafizabad in Pakistan’s Punjab province. Schools were also shuttered and construction was halted in Delhi, India’s capital territory. Face masks were later made mandatory in Lahore.
What can be done to remedy South Asia’s air quality crisis?
The IQAir report recommends that governments invest in renewable energy initiatives, introduce incentives for cleaner vehicles, improve infrastructure to enable better pedestrian mobility, and ban agricultural burning practices.
The report also highlights a lack of government-operated air quality monitoring stations in South Asia. The majority of stations reporting air quality data in Lahore and Peshawar in Pakistan, as well as Dhaka in Bangladesh, are not affiliated with the countries’ governments.
Some attempts have been made by South Asian governments to curb air pollution. For example, coal burning was banned in Delhi’s National Capital Region in January 2023. Older vehicles were also banned in Delhi in 2018, resulting in a decrease in the number of cars on the road. However, vehicle emissions remain the largest contributor to air pollution in the city.
Pakistan’s Punjab province has banned crop burning and launched public transport projects to reduce private vehicle usage. However, illegal crop burning still occurs, possibly due to the unaffordability of alternatives.
Cloud seeding has been used in India and Pakistan to prompt artificial rain and curb smog. While it has shown some temporary improvements in air quality, long-term solutions are still needed.
In Bangladesh, the Ministry of Environment, Forest and Climate Change plans to use a brick kiln tracker to identify harmful brick kilns and improve enforcement.
SDGs, Targets, and Indicators Relevant to the Article
1. Which SDGs are addressed or connected to the issues highlighted in the article?
- SDG 3: Good Health and Well-being
- SDG 7: Affordable and Clean Energy
- SDG 11: Sustainable Cities and Communities
- SDG 13: Climate Action
- SDG 15: Life on Land
2. What specific targets under those SDGs can be identified based on the article’s content?
- SDG 3.9: By 2030, substantially reduce the number of deaths and illnesses from hazardous chemicals and air, water, and soil pollution and contamination.
- SDG 7.1: By 2030, ensure universal access to affordable, reliable, and modern energy services.
- SDG 11.6: By 2030, reduce the adverse per capita environmental impact of cities, including by paying special attention to air quality and municipal and other waste management.
- SDG 13.1: Strengthen resilience and adaptive capacity to climate-related hazards and natural disasters in all countries.
- SDG 15.1: By 2020, ensure the conservation, restoration, and sustainable use of terrestrial and inland freshwater ecosystems and their services.
3. Are there any indicators mentioned or implied in the article that can be used to measure progress towards the identified targets?
- Indicator for SDG 3.9: PM2.5 levels (micrograms per cubic meter) as a measure of air pollution.
- Indicator for SDG 7.1: Proportion of the population with access to clean cooking fuels and technologies.
- Indicator for SDG 11.6: PM2.5 levels (micrograms per cubic meter) in cities as a measure of air quality.
- Indicator for SDG 13.1: Average annual levels of PM2.5 as a measure of air pollution and climate-related hazards.
- Indicator for SDG 15.1: Proportion of land area covered by forests and other ecosystems.
Table: SDGs, Targets, and Indicators
| SDGs | Targets | Indicators |
|---|---|---|
| SDG 3: Good Health and Well-being | Target 3.9: By 2030, substantially reduce the number of deaths and illnesses from hazardous chemicals and air, water, and soil pollution and contamination. | PM2.5 levels (micrograms per cubic meter) as a measure of air pollution. |
| SDG 7: Affordable and Clean Energy | Target 7.1: By 2030, ensure universal access to affordable, reliable, and modern energy services. | Proportion of the population with access to clean cooking fuels and technologies. |
| SDG 11: Sustainable Cities and Communities | Target 11.6: By 2030, reduce the adverse per capita environmental impact of cities, including by paying special attention to air quality and municipal and other waste management. | PM2.5 levels (micrograms per cubic meter) in cities as a measure of air quality. |
| SDG 13: Climate Action | Target 13.1: Strengthen resilience and adaptive capacity to climate-related hazards and natural disasters in all countries. | Average annual levels of PM2.5 as a measure of air pollution and climate-related hazards. |
| SDG 15: Life on Land | Target 15.1: By 2020, ensure the conservation, restoration, and sustainable use of terrestrial and inland freshwater ecosystems and their services. | Proportion of land area covered by forests and other ecosystems. |
Behold! This splendid article springs forth from the wellspring of knowledge, shaped by a wondrous proprietary AI technology that delved into a vast ocean of data, illuminating the path towards the Sustainable Development Goals. Remember that all rights are reserved by SDG Investors LLC, empowering us to champion progress together.
Source: aljazeera.com

Join us, as fellow seekers of change, on a transformative journey at https://sdgtalks.ai/welcome, where you can become a member and actively contribute to shaping a brighter future.


