Even short-term exposure to air pollution may raise risk of stroke, study finds
Even short-term exposure to air pollution may raise risk of stroke, study finds NBC News


Wildfire Smoke Increases Risk of Stroke, Study Finds
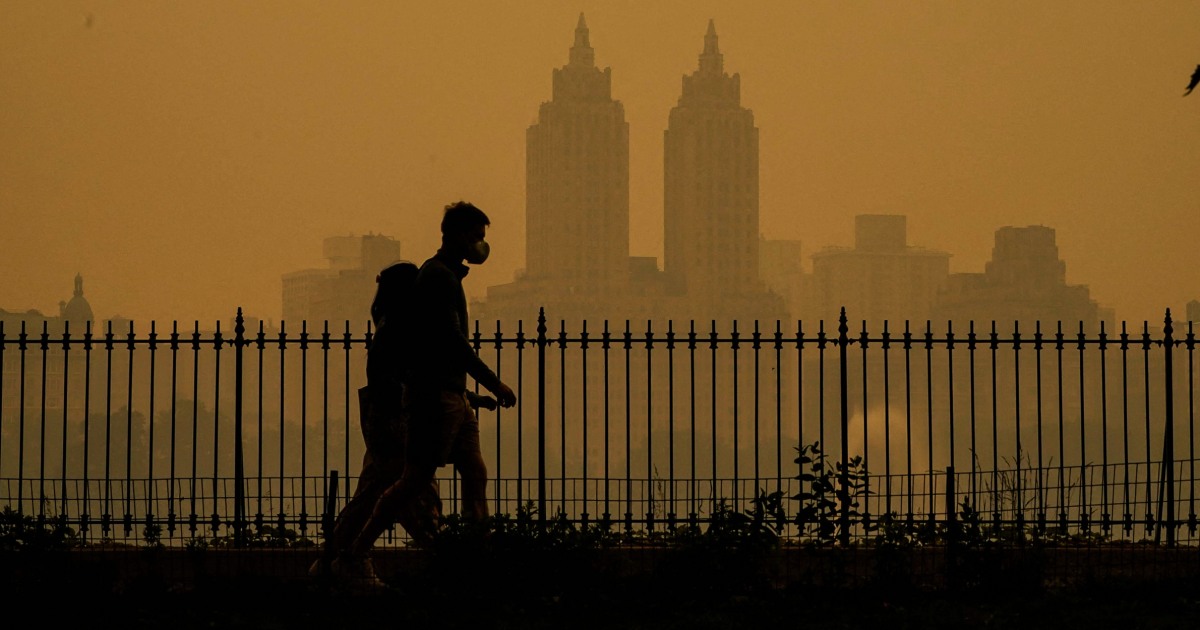
This past summer, wildfire smoke periodically blanketed the United States, bringing stinging air and hazy skies to the Northeast and the Midwest, regions that are unaccustomed to the itchy eyes, scratchy throats and breathing problems that come from being downwind of such natural disasters.
But with air pollution comes more serious health problems, too. Among them, a meta-analysis published Wednesday in the journal Neurology finds that exposure to air pollution may increase a person’s risk of stroke within five days.
Air Pollution and Stroke Risk
“Air pollution’s impact on human health extends beyond the lung and eyes. It also involves the brain and cardiovascular system,” said Dr. Ahmad Tubasi, a researcher with the faculty of medicine at the University of Jordan, who led the research.
In the study, Tubasi and his team looked at data from 110 observational studies from Asia, Europe and North and South America. The studies looked at incidence of stroke, as well as the concentrations of common pollutants, including nitrogen dioxide, ozone, carbon monoxide and sulfur dioxide, present in the air within five days of people having a stroke.
They also looked at exposure to particulate matter — microscopic particles from dust, dirt, soot or smoke that can be harmful when inhaled. Particulate matter can range in size from less than 1 micron in diameter (referred to as PM1) to up to 10 times that size (PM10).
More on air pollution and health
In the U.S., vehicle emissions, burning fuel to heat homes, power plants and chemical production are the main sources of air pollution. Traffic is a key reason air pollution is usually worse in cities than in rural areas. Vehicles that burn gas release carbon monoxide and nitrogen oxide, which are dangerous on their own. But these compounds also react with sunlight to create ozone, usually called smog, which damages cells. Smoke from fires, including wildfires, is also a source of air pollution.
The meta-analysis included more than 18 million cases of ischemic stroke, the most common type of stroke, which is caused by a blood clot traveling to the brain.
The researchers found that stroke risk was nearly 30% higher when people had been exposed to nitrogen dioxide up to five days prior. For carbon monoxide exposure, the risk was 26% higher; for sulfur dioxide, 15% higher; and for ozone exposure, 5% higher.
The risk of dying from a stroke also went up with exposure to certain pollutants, the meta-analysis found. Short-term exposure to nitrogen dioxide was linked to a 33% increased risk of death from stroke, and for sulfur dioxide, a 60% increased risk.
For particulate matter, the greatest increase was seen for PM2.5 particles, which are less than 2.5 microns in diameter. PM2.5 particle exposure was associated with a 15% increased risk of stroke, the study found. Exposure to increased amounts of PM1 was associated with a 9% greater risk of stroke, and exposure to increased amounts of PM10 was associated with a 14% greater risk.
A Cascading Effect
Breathing in particulate matter, especially the smaller molecules, causes inflammation and irritation in the lungs, which triggers the body’s immune response, said Michael Kleinman, co-director of the Air Pollution Health Effects Laboratory at the University of California, Irvine, who was not involved with the study.
This creates a cascading effect that impacts the cardiovascular system, Kleinman said. “There is a direct link between what goes on in the lung and what goes on in the heart,” he said.
When air pollution sets off the immune response, inflammation spreads throughout the body in an effort to fight off intruders. This inflammation causes the arteries and veins to constrict, creating a more narrow pathway for blood, clots and plaque. At the same time, the body increases production of thrombin, a clotting agent in the blood.
“The longer a person is exposed to air pollution, and the more intense the exposure, the greater the risk,” said Dr. Julius Latorre, director of the Upstate University Hospital Comprehensive Stroke Center in Syracuse, New York, who was not involved with the new research.
Since nitrogen dioxide and sulfur dioxide molecules are so tiny, they are more likely to pass through the lung’s filters and cause damage, either by irritating the lungs enough to cause an inflammatory response, or by making their way into the body’s cells, Latorre said. This may be why these two pollutants were
SDGs, Targets, and Indicators
-
SDG 3: Good Health and Well-being
- Target 3.9: By 2030, substantially reduce the number of deaths and illnesses from hazardous chemicals and air, water, and soil pollution and contamination.
- Indicator 3.9.1: Mortality rate attributed to household and ambient air pollution.
- Indicator 3.9.2: Mortality rate attributed to unsafe water, unsafe sanitation, and lack of hygiene.
-
SDG 11: Sustainable Cities and Communities
- Target 11.6: By 2030, reduce the adverse per capita environmental impact of cities, including by paying special attention to air quality and municipal and other waste management.
- Indicator 11.6.2: Annual mean levels of fine particulate matter (e.g., PM2.5 and PM10) in cities (population-weighted).
-
SDG 13: Climate Action
- Target 13.1: Strengthen resilience and adaptive capacity to climate-related hazards and natural disasters in all countries.
- Indicator 13.1.2: Number of deaths, missing persons, and directly affected persons attributed to disasters per 100,000 population.
| SDGs | Targets | Indicators |
|---|---|---|
| SDG 3: Good Health and Well-being | Target 3.9: By 2030, substantially reduce the number of deaths and illnesses from hazardous chemicals and air, water, and soil pollution and contamination. | Indicator 3.9.1: Mortality rate attributed to household and ambient air pollution. Indicator 3.9.2: Mortality rate attributed to unsafe water, unsafe sanitation, and lack of hygiene. |
| SDG 11: Sustainable Cities and Communities | Target 11.6: By 2030, reduce the adverse per capita environmental impact of cities, including by paying special attention to air quality and municipal and other waste management. | Indicator 11.6.2: Annual mean levels of fine particulate matter (e.g., PM2.5 and PM10) in cities (population-weighted). |
| SDG 13: Climate Action | Target 13.1: Strengthen resilience and adaptive capacity to climate-related hazards and natural disasters in all countries. | Indicator 13.1.2: Number of deaths, missing persons, and directly affected persons attributed to disasters per 100,000 population. |
Analysis
1. Which SDGs are addressed or connected to the issues highlighted in the article?
The issues highlighted in the article are connected to SDG 3: Good Health and Well-being, SDG 11: Sustainable Cities and Communities, and SDG 13: Climate Action.
2. What specific targets under those SDGs can be identified based on the article’s content?
Based on the article’s content, the specific targets that can be identified are:
– Target 3.9: By 2030, substantially reduce the number of deaths and illnesses from hazardous chemicals and air, water, and soil pollution and contamination.
– Target 11.6: By 2030, reduce the adverse per capita environmental impact of cities, including by paying special attention to air quality and municipal and other waste management.
– Target 13.1: Strengthen resilience and adaptive capacity to climate-related hazards and natural disasters in all countries.
3. Are there any indicators mentioned or implied in the article that can be used to measure progress towards the identified targets?
Yes, there are indicators mentioned or implied in the article that can be used to measure progress towards the identified targets:
– Indicator 3.9.1: Mortality rate attributed to household and ambient air pollution.
– Indicator 3.9.2: Mortality rate attributed to unsafe water, unsafe sanitation, and lack of hygiene.
– Indicator 11.6.2: Annual mean levels of fine particulate matter (e.g., PM2.5 and PM10) in cities (population-weighted).
– Indicator 13.1.2: Number of deaths, missing persons, and directly affected persons attributed to disasters per 100,000 population.
These indicators can help track the impact of air pollution on health, the quality of air in cities, and the effects of climate-related hazards and natural disasters.
SDGs, Targets, and Indicators
| SDGs | Targets | Indicators |
|---|---|---|
| SDG 3: Good Health and Well-being | Target 3.9: By 2030, substantially reduce the number of deaths and illnesses from hazardous chemicals and air, water, and soil pollution and contamination. | Indicator 3.9.1: Mortality rate attributed to household and ambient air pollution. Indicator 3.9.2: Mortality rate attributed to unsafe water, unsafe sanitation, and lack of hygiene. |
| SDG 11: Sustainable Cities and Communities | Target 11.6: By 2030, reduce the adverse per capita environmental impact of cities, including by paying special attention to air quality and municipal and other waste management. | Indicator 11.6.2: Annual mean levels of fine particulate matter (e.g., PM2.5 and PM10) in cities (population-weighted). |
| SDG 13: Climate Action | Target 13.1: Strengthen resilience and adaptive capacity to climate-related hazards and natural disasters in all countries. | Indicator 13.1.2: Number of deaths, missing persons, and directly affected persons attributed to disasters per 100,000 population. |


