Filling an Air Pollution Data Gap
Filling an Air Pollution Data Gap nasa.gov


Filling an Air Pollution Data Gap
The combined effects of outdoor and household air pollution contribute to 6.7 million premature deaths every year, making air pollution one of the world’s leading risk factors for death and chronic diseases, according to the World Health Organization and the Institute for World Health Metrics and Evaluation. Yet for most people, especially in low- and middle-income countries, access to information about local air quality is often limited.
Addressing the Data Shortage with Satellite Observations
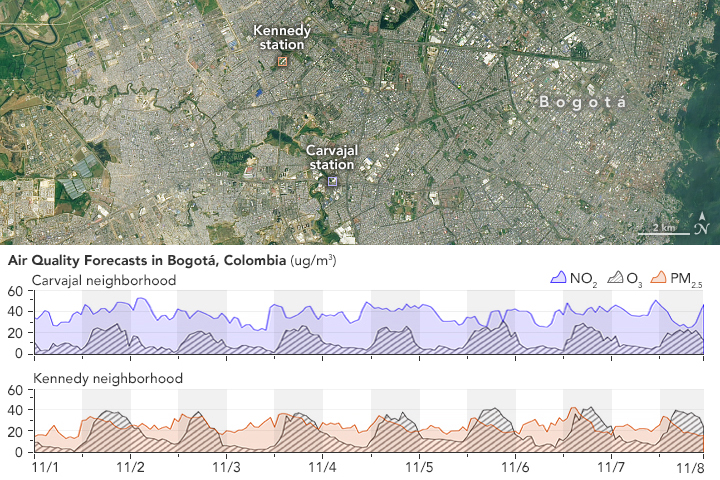
A team of NASA-funded researchers is trying to address the data shortage by developing a different way of tracking air pollution—a technique powered by satellite observations, modeling, and supercomputing. As part of an effort to make this approach more useful for cities in developing countries, the NASA team has partnered with the World Resources Institute (WRI) on a pilot project called CityAQ.
Most countries have limited or no access to expensive but accurate “reference” air quality monitoring stations to measure fine particulate matter (PM2.5) and other harmful pollutants such as nitrogen dioxide (NO2), ozone (O3), and sulfur dioxide (SO2). The lack of monitoring has consequences. A 2022 analysis of air pollution data shared by U.S. embassies in 40 countries found that cities given access to real-time air quality data saw significant drops in air pollution levels.
Even in large cities, the most reliable air quality monitors are scarce. By one estimate, there are 5,500 PM2.5 monitors for the world’s 1,700 cities with more than 300,000 or more people, an average of just three monitors per city. In sub-Saharan Africa, there is roughly one monitor for every 16 million people; in India, there is one monitor for every 7 million people.
The Role of GEOS-CF in Tracking Air Pollution
To address the shortage, Christoph Keller and Emma Knowland and colleagues at NASA’s Global Modeling and Assimilation Office, Morgan State University, and Harvard University have developed a global model capable of hindcasting and forecasting the composition of the atmosphere, including several common air pollutants. The tool, Goddard Earth Observing System Composition Forecast (GEOS-CF), incorporates timely weather observations and insights from years of satellite observations, plus a range of historical emissions inventories. It generates five-day forecasts for the whole atmosphere every day.
Example animations from GEOS-CF—showing the global distribution of ground-level PM2.5 and O3 for parts of September and October 2023—are shown above and below. During that period, major wildfires raged in Canada, large dust storms blew through the Sahara Desert and parts of South Asia, industrial pollution gathered over the Indo-Gangetic Plain and East Asia, and seasonal fires burned in South America and sub-Saharan Africa.

GEOS-CF is a version of a broader modeling and data assimilation system called the
SDGs, Targets, and Indicators
1. Which SDGs are addressed or connected to the issues highlighted in the article?
- SDG 3: Good Health and Well-being
- SDG 11: Sustainable Cities and Communities
- SDG 13: Climate Action
2. What specific targets under those SDGs can be identified based on the article’s content?
- SDG 3.9: By 2030, substantially reduce the number of deaths and illnesses from hazardous chemicals and air, water, and soil pollution and contamination.
- SDG 11.6: By 2030, reduce the adverse per capita environmental impact of cities, including by paying special attention to air quality and municipal and other waste management.
- SDG 13.2: Integrate climate change measures into national policies, strategies, and planning.
3. Are there any indicators mentioned or implied in the article that can be used to measure progress towards the identified targets?
Yes, the article mentions indicators that can be used to measure progress towards the identified targets:
- Number of premature deaths caused by air pollution (indicator for SDG 3.9)
- Availability of air quality monitoring stations (indicator for SDG 11.6)
- Inclusion of climate change measures in national policies and planning (indicator for SDG 13.2)
Table: SDGs, Targets, and Indicators
| SDGs | Targets | Indicators |
|---|---|---|
| SDG 3: Good Health and Well-being | SDG 3.9: By 2030, substantially reduce the number of deaths and illnesses from hazardous chemicals and air, water, and soil pollution and contamination. | Number of premature deaths caused by air pollution |
| SDG 11: Sustainable Cities and Communities | SDG 11.6: By 2030, reduce the adverse per capita environmental impact of cities, including by paying special attention to air quality and municipal and other waste management. | Availability of air quality monitoring stations |
| SDG 13: Climate Action | SDG 13.2: Integrate climate change measures into national policies, strategies, and planning. | Inclusion of climate change measures in national policies and planning |
Behold! This splendid article springs forth from the wellspring of knowledge, shaped by a wondrous proprietary AI technology that delved into a vast ocean of data, illuminating the path towards the Sustainable Development Goals. Remember that all rights are reserved by SDG Investors LLC, empowering us to champion progress together.
Source: earthobservatory.nasa.gov
![]()
Join us, as fellow seekers of change, on a transformative journey at https://sdgtalks.ai/welcome, where you can become a member and actively contribute to shaping a brighter future.


