Global aid 2023: comparing apples with apples – Devpolicy Blog from the Development Policy Centre
Global aid 2023: comparing apples with apples devpolicy.org


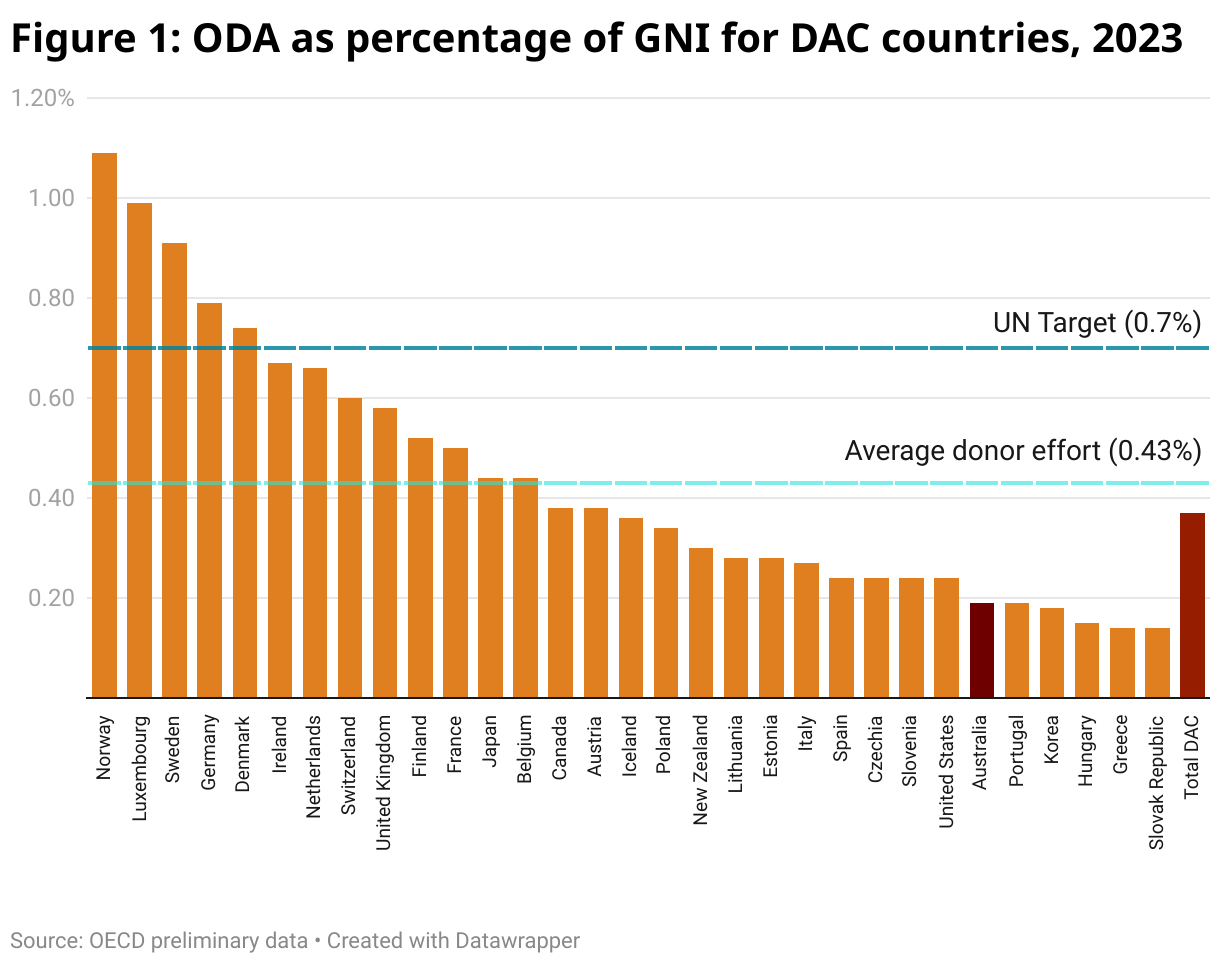
Last night the Organisation for Economic Cooperation and Development (OECD) released its preliminary data on Official Development Assistance (ODA) spending by the 31 country members of its Development Assistance Committee (DAC) in the 2023 calendar year.
Once again, total aid from these donors has increased (by 1.8% in real terms, to US$224 billion) year-on-year. And, once again, Australia languishes near the bottom of the rankings when it comes to aid generosity (just in front of Portugal, at 26 out of 31 bilateral donors), despite a real increase in aid spending of 7.8% relative to 2022 “due to new bilateral funding for [its] development programme in 2023 and its financial year reporting cycle”.
But there are well-known limitations to this data and the accompanying comparisons.
Limitations of the Data
- One limitation is the aforementioned difference between the DAC’s calendar year reporting cycle and the financial year cycle of donors like Australia.
- A more significant limitation is that some countries count as ODA the cost of providing “temporary sustenance” to recognised refugees from developing countries during their first year in donor countries — an “in-donor” cost which is allowable under DAC rules — while others do not.
Australia falls into the latter category, having only claimed, and only sometimes, costs associated with asylum seekers rather than recognised refugees. (Such costs are ODA-eligible under the same DAC rules.)
This difference has become particularly pronounced in the wake of Russia’s invasion of Ukraine in February 2022. Since the invasion, many newer DAC donors — particularly those in eastern Europe that are bearing the brunt of the region’s biggest refugee crisis since the end of the Second World War — have counted large amounts of in-donor refugee assistance as ODA.
In the case of Estonia, 31% of its reported ODA was spent on such support in 2023. In the case of Czechia, the proportion was even greater, 53%. Even traditional DAC members like Ireland (52%), the UK (28%) and Germany (19%) continued to count a significant proportion of first-year refugee sustenance towards their ODA spend in 2023. However, as a share of total DAC ODA, in-donor refugee support declined by 6.2% relative to 2022 levels.
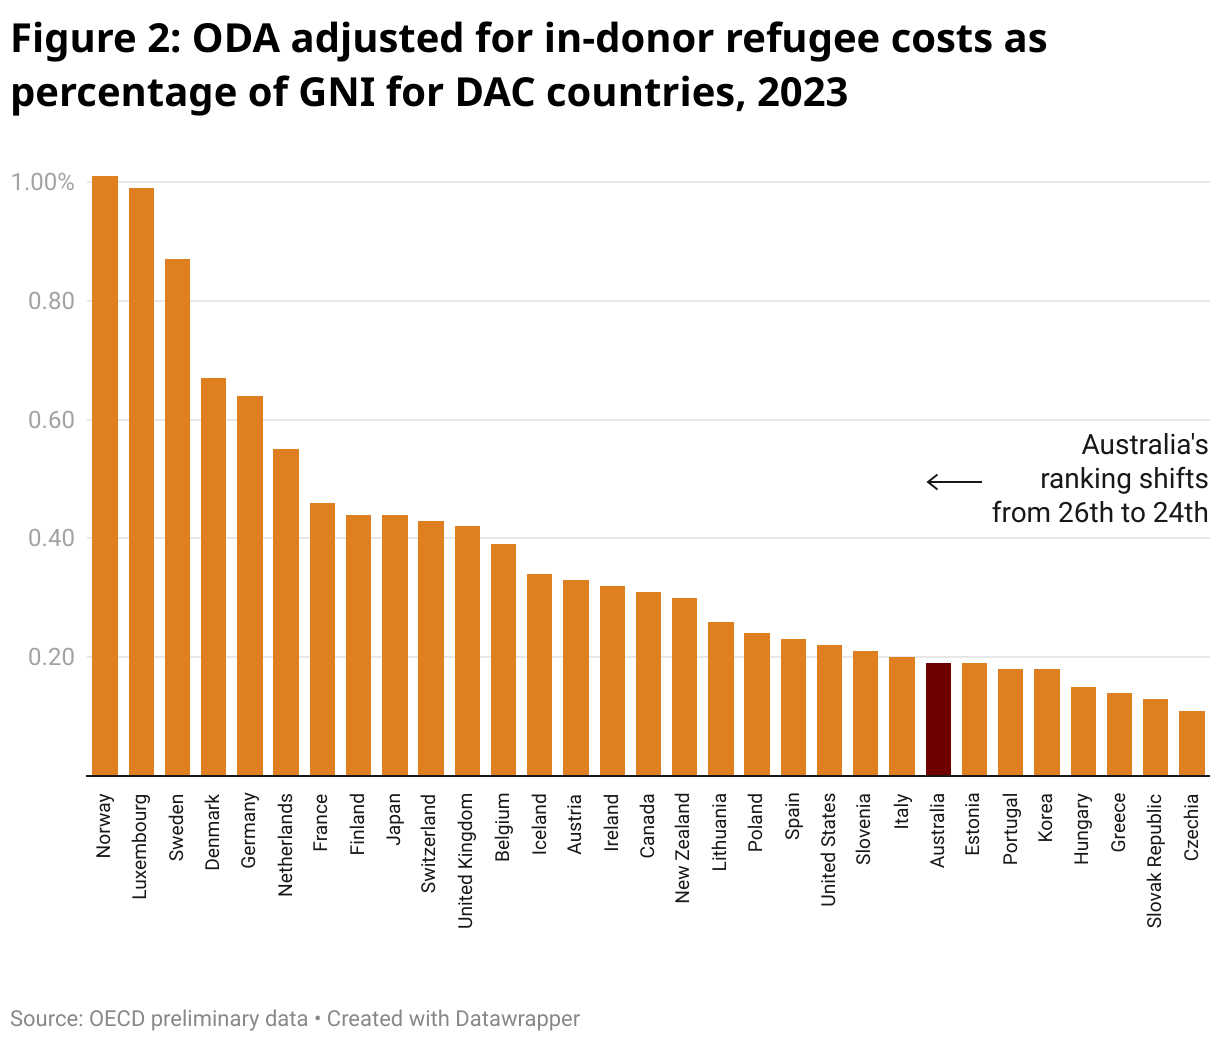
So, what happens to Australia’s ranking when we discount other donors’ in-donor refugee aid? As shown in Figure 2, it does make a difference – Australia moves from 26/31 to 24/31. (It’s not possible to do the comparison the other way around by adding in Australia’s in-donor refugee costs as we don’t have the data.)
Even with this adjustment, there is still a big disparity between Australia’s economic size — the ninth largest economy in the OECD — and its ranking on aid generosity. And the decline is not just a relative one; we are a much less generous nation when compared to ourselves over time.
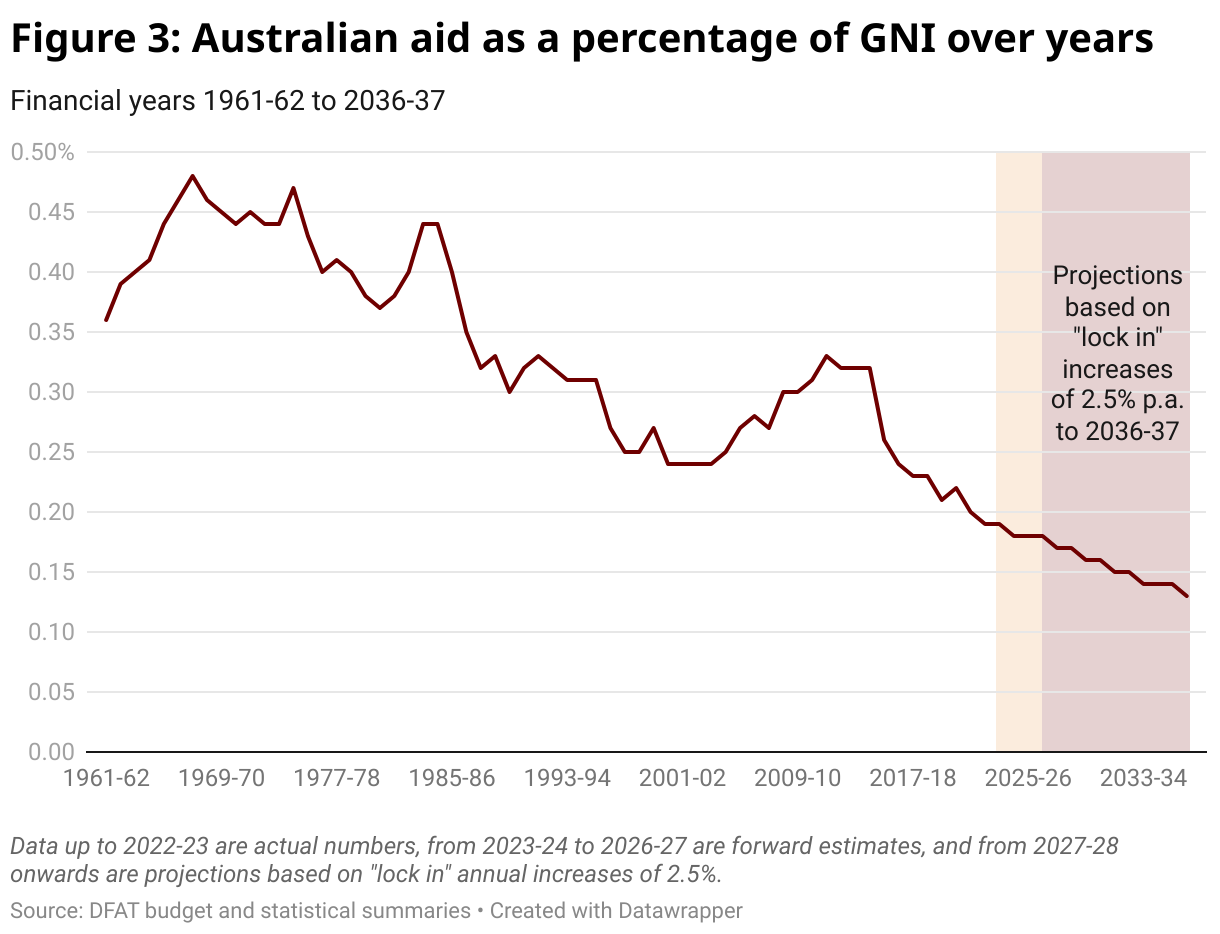
In the last Cold War, Australian aid peaked at 0.48% of GNI (1967-68) as Australia sought to extend our influence amid great power competition and proxy wars in Southeast Asia. In the last full year of John Howard’s tenure as Prime Minister (2006-07), it reached 0.28% as his government committed to double aid spending by 2010 in response to heightened security and fragility concerns after 9/11 and on the back of the resources boom. And during the Rudd/Gillard years it peaked at 0.33% (2011-12) as part of Labor’s last big aid scale-up.
By contrast, on current projections, Australia’s aid generosity could fall as low as 0.13% by 2036-37. This is despite the Albanese government’s characterisation of development as “at the heart of statecraft” and its promise, via an annual 2.5% nominal increase from 2026-27 to 2036-37, to undertake “a long-term rebuild of Australia’s international development program” following the successive and severe cuts inflicted by the Coalition prior to COVID-19.
Options for Improving Australia’s Ranking
So, what options are open to Australia if it wants to improve its ranking? In our view, there are three.
Option 1: Change DAC Rules
The first is that Australia could argue in the DAC for a change to the rules to disallow the counting of in-donor refugee assistance. But this would be hard given that Australia, as a long-standing member of the DAC, helped create these rules. Given the number of donors that count this support as part of their ODA, Australia’s OECD representatives would likely face stiff resistance. Ultimately, as shown, this could be a lot of diplomatic effort for a change that would do little to improve our ranking.
Option 2: Count In-Donor Refugee Assistance as Aid
A second option is that Australia joins other donors and counts first-year, in-donor refugee assistance as aid. Given that this assistance is dispersed across multiple parts of the budget, it is not clear to us what the current quantum of this support is and, therefore, how it might affect Australia’s relative position. When Australia last counted first-year asylum seeker costs (not refugee costs) in 2013-14, at a time of high boat arrivals, these were worth $375 million (around 7.5% of total aid) per annum. Even if counting first-year refugee costs were to add this much to Australia’s ODA volume, which is unlikely, it would have very little effect on its overall ODA/GNI ranking. The government would also experience pressure to demonstrate this support was not coming at the expense of bilateral and multilateral aid.
Option 3: Increase ODA Volume
A third (and preferred) option is that the government produces a strategy to arrest the structural decline in Australia’s ODA volume and increase Australia’s aid generosity, either through either a medium-term ODA/GNI target or year-on-year ODA/GNI increases. Labor has supported a target before, as has the Coalition. The Albanese government is not a
SDGs, Targets, and Indicators
1. Which SDGs are addressed or connected to the issues highlighted in the article?
- SDG 1: No Poverty
- SDG 10: Reduced Inequalities
- SDG 16: Peace, Justice, and Strong Institutions
- SDG 17: Partnerships for the Goals
2. What specific targets under those SDGs can be identified based on the article’s content?
- Target 1.2: By 2030, reduce at least by half the proportion of men, women, and children of all ages living in poverty in all its dimensions according to national definitions.
- Target 10.7: Facilitate orderly, safe, regular, and responsible migration and mobility of people, including through the implementation of planned and well-managed migration policies.
- Target 16.6: Develop effective, accountable, and transparent institutions at all levels.
- Target 17.2: Increase significantly the availability of high-quality, timely, and reliable data disaggregated by income, gender, age, race, ethnicity, migratory status, disability, geographic location, and other characteristics relevant in national contexts.
3. Are there any indicators mentioned or implied in the article that can be used to measure progress towards the identified targets?
- Indicator 1.2.1: Proportion of population living below the national poverty line, by sex and age.
- Indicator 10.7.1: Recruitment cost borne by employee as a proportion of yearly income earned in country of destination.
- Indicator 16.6.1: Primary government expenditures as a proportion of original approved budget, by sector (or by budget codes or similar).
- Indicator 17.18.2: Number of countries that have national statistical legislation that complies with the Fundamental Principles of Official Statistics.
Table: SDGs, Targets, and Indicators
| SDGs | Targets | Indicators |
|---|---|---|
| SDG 1: No Poverty | Target 1.2: By 2030, reduce at least by half the proportion of men, women, and children of all ages living in poverty in all its dimensions according to national definitions. | Indicator 1.2.1: Proportion of population living below the national poverty line, by sex and age. |
| SDG 10: Reduced Inequalities | Target 10.7: Facilitate orderly, safe, regular, and responsible migration and mobility of people, including through the implementation of planned and well-managed migration policies. | Indicator 10.7.1: Recruitment cost borne by employee as a proportion of yearly income earned in country of destination. |
| SDG 16: Peace, Justice, and Strong Institutions | Target 16.6: Develop effective, accountable, and transparent institutions at all levels. | Indicator 16.6.1: Primary government expenditures as a proportion of original approved budget, by sector (or by budget codes or similar). |
| SDG 17: Partnerships for the Goals | Target 17.2: Increase significantly the availability of high-quality, timely, and reliable data disaggregated by income, gender, age, race, ethnicity, migratory status, disability, geographic location, and other characteristics relevant in national contexts. | Indicator 17.18.2: Number of countries that have national statistical legislation that complies with the Fundamental Principles of Official Statistics. |
Behold! This splendid article springs forth from the wellspring of knowledge, shaped by a wondrous proprietary AI technology that delved into a vast ocean of data, illuminating the path towards the Sustainable Development Goals. Remember that all rights are reserved by SDG Investors LLC, empowering us to champion progress together.
Source: devpolicy.org
![]()
Join us, as fellow seekers of change, on a transformative journey at https://sdgtalks.ai/welcome, where you can become a member and actively contribute to shaping a brighter future.


