Atmospheric carbon dioxide levels at 4-million-year high, El Nino could boost numbers in 2023, WMO says
Atmospheric carbon dioxide levels at 4-million-year high, El Nino ... Fox Weather
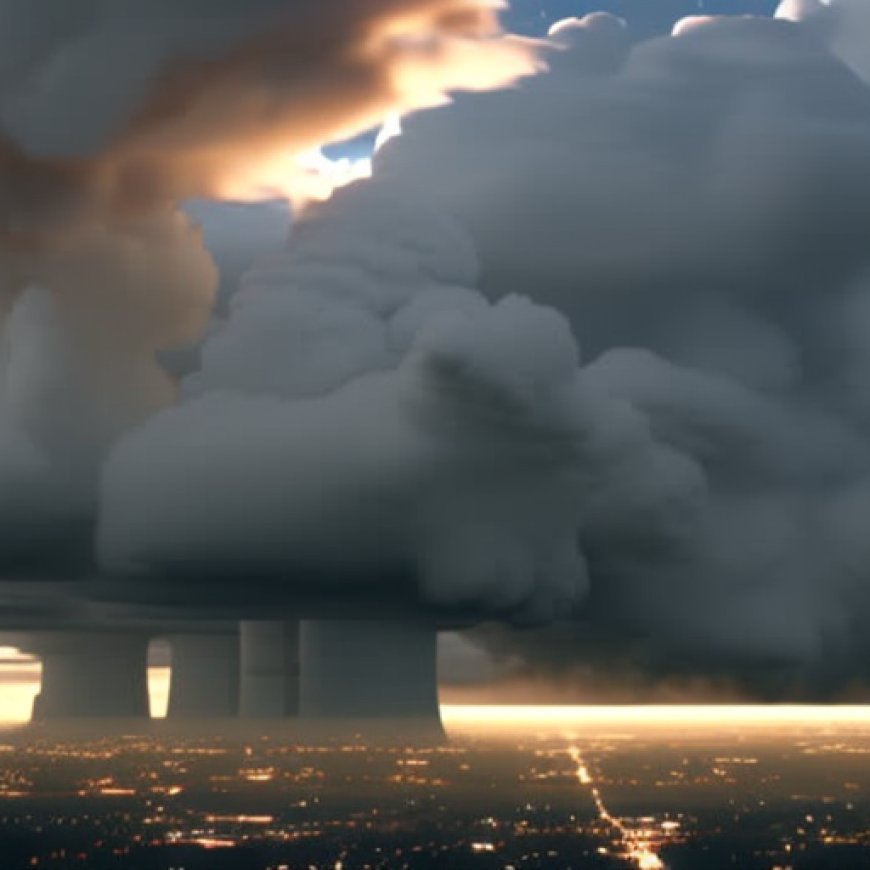

Earth’s Atmosphere Hits Record High for Carbon Dioxide Concentration
GENEVA – Earth’s atmosphere hit a 3 to 5-million-year high for carbon dioxide concentration, a greenhouse gas, according to the World Meteorological Organization’s new Greenhouse Gas Bulletin, and concentrations could grow rapidly in 2023 with El Niño.
“The last time the Earth experienced a comparable concentration of CO2 was 3-5 million years ago when the temperature was 2-3°C warmer (3.6 to 5.4 degrees F) and sea level was 10-20 meters (32.8 to 65.6 feet) higher than now,” the WMO said in a statement.
Carbon Dioxide Levels Increased in 2022 but Not as Much as Anticipated; Scientists Point to La Niña
The WMO said that levels in 2022 were 50% greater than in the pre-industrial era and will continue to grow in 2023. And the annual increase in the amount in 2022 was smaller than the increase from 2020 to 2021 for the last decade. Concentrations increased by 2.2 parts per million, while the previous decade saw a 2.46 ppm growth every year.
What Was the Earth Like 3 to 5 Million Years Ago, and Why Did the Warmth Stop?
That was the Pliocene Epoch, where animals lived several hundred miles north of where their offspring live now. Less polar ice accounted for the higher sea level. According to the University of California Museum of Paleontology, the sea level could have been as much as 98 feet higher at the epoch’s warmest.
“Long before the Pliocene, CO2 levels were extremely elevated during the age of the dinosaurs (which ended 65 million years ago), perhaps at some 2,000 to 4,000 ppm,” reported Mashable. “Tremendous CO2 emissions, from incessant and extreme volcanism, heated Earth and allowed dinosaurs to roam a sultry Antarctic.”
- NERVOUS GRINDAVIK RESIDENTS QUICKLY RETURN TO DANGER ZONE AMID FEARS OF VOLCANIC ERUPTION IN ICELAND
Eventually, rocks absorbed carbon dioxide from the atmosphere, which lowered levels to the 400 ppm level. According to NOAA, Earth continued to lock up the greenhouse gas into the Pleistocene Epoch until levels stabilized around 280 ppm or less. That’s where levels remained through to the Industrial Revolution in the mid-1700s.
“The Pliocene contains what might be the closest analog to climate conditions expected in the near future, and therefore understanding the Pliocene is not only of academic interest but essential for human adaptation,” stated Britannica.com.
A cooling and drying trend marked the end of the Pliocene. The Mediterranean Sea dried up and became grasslands and plains for the next several million years, according to the museum.
Scientists Struggling with Unknown Climate Change Drivers
While the WMO states they understand broad strokes of climate change, they detailed several unknowns about the carbon cycle.
The Greenhouse Gas Bulletin cites “challenges
SDGs, Targets, and Indicators
SDGs Addressed in the Article:
- SDG 13: Climate Action
- SDG 14: Life Below Water
- SDG 15: Life on Land
Targets Identified Based on the Article:
- Target 13.1: Strengthen resilience and adaptive capacity to climate-related hazards and natural disasters
- Target 14.3: Minimize and address the impacts of ocean acidification
- Target 15.1: Ensure the conservation, restoration, and sustainable use of terrestrial and inland freshwater ecosystems and their services
Indicators Mentioned or Implied in the Article:
- Indicator 13.1.1: Number of deaths, missing persons, and directly affected persons attributed to disasters per 100,000 population
- Indicator 14.3.1: Average marine acidity (pH) measured at agreed suite of representative sampling stations
- Indicator 15.1.1: Forest area as a proportion of total land area
Table: SDGs, Targets, and Indicators
| SDGs | Targets | Indicators |
|---|---|---|
| SDG 13: Climate Action | Target 13.1: Strengthen resilience and adaptive capacity to climate-related hazards and natural disasters | Indicator 13.1.1: Number of deaths, missing persons, and directly affected persons attributed to disasters per 100,000 population |
| SDG 14: Life Below Water | Target 14.3: Minimize and address the impacts of ocean acidification | Indicator 14.3.1: Average marine acidity (pH) measured at agreed suite of representative sampling stations |
| SDG 15: Life on Land | Target 15.1: Ensure the conservation, restoration, and sustainable use of terrestrial and inland freshwater ecosystems and their services | Indicator 15.1.1: Forest area as a proportion of total land area |
Analysis:
1. Which SDGs are addressed or connected to the issues highlighted in the article?
The issues highlighted in the article are connected to SDG 13 (Climate Action), SDG 14 (Life Below Water), and SDG 15 (Life on Land).
2. What specific targets under those SDGs can be identified based on the article’s content?
Based on the article’s content, the specific targets identified are:
– Target 13.1: Strengthen resilience and adaptive capacity to climate-related hazards and natural disasters
– Target 14.3: Minimize and address the impacts of ocean acidification
– Target 15.1: Ensure the conservation, restoration, and sustainable use of terrestrial and inland freshwater ecosystems and their services
3. Are there any indicators mentioned or implied in the article that can be used to measure progress towards the identified targets?
Yes, there are indicators mentioned or implied in the article that can be used to measure progress towards the identified targets. The indicators are:
– Indicator 13.1.1: Number of deaths, missing persons, and directly affected persons attributed to disasters per 100,000 population
– Indicator 14.3.1: Average marine acidity (pH) measured at agreed suite of representative sampling stations
– Indicator 15.1.1: Forest area as a proportion of total land area
These indicators can be used to measure progress towards the targets by tracking the number of deaths and affected persons from climate-related hazards, monitoring marine acidity levels, and assessing the forest area as a proportion of total land area.
4. Create a table with three columns titled ‘SDGs, Targets and Indicators” to present the findings from analyzing the article.
| SDGs | Targets | Indicators |
|---|---|---|
| SDG 13: Climate Action | Target 13.1: Strengthen resilience and adaptive capacity to climate-related hazards and natural disasters | Indicator 13.1.1: Number of deaths, missing persons, and directly affected persons attributed to disasters per 100,000 population |
| SDG 14: Life Below Water | Target 14.3: Minimize and address the impacts of ocean acidification | Indicator 14.3.1: Average marine acidity (pH) measured at agreed suite of representative sampling stations |
| SDG 15: Life on Land | Target 15.1: Ensure the conservation, restoration, and sustainable use of terrestrial and inland freshwater ecosystems and their services | Indicator 15.1.1: Forest area as a proportion of total land area |
Behold! This splendid article springs forth from the wellspring of knowledge, shaped by a wondrous proprietary AI technology that delved into a vast ocean of data, illuminating the path towards the Sustainable Development Goals. Remember that all rights are reserved by SDG Investors LLC, empowering us to champion progress together.
Source: foxweather.com
![]()
Join us, as fellow seekers of change, on a transformative journey at https://sdgtalks.ai/welcome, where you can become a member and actively contribute to shaping a brighter future.


