


Distributional weighting in benefit-cost analysis is practical and effective at assessing government rulemaking without bias against low-income individuals – Equitable Growth
Advancing Sustainable Development Goals through Equitable Policy Analysis
Introduction: Distributional Weighting and the 2030 Agenda
Benefit-cost analysis (BCA) is a standard tool for evaluating government policies. However, its conventional application can inadvertently undermine progress toward the Sustainable Development Goals (SDGs), particularly SDG 10 (Reduced Inequalities) and SDG 1 (No Poverty). This is due to an inherent bias where policy impacts are measured in monetary terms, undervaluing benefits and costs to lower-income individuals due to the diminishing marginal utility of income. Distributional weighting is a methodological adjustment designed to correct this bias. By assigning greater weight to monetary impacts on lower-income populations, it ensures that policy analysis accurately reflects changes in social welfare, aligning economic evaluation with the core SDG principle of “leaving no one behind.” This report details the methodology, challenges, and practical applications of distributional weighting as a vital instrument for creating just and effective policies that promote inclusive and sustainable development.
Core Methodology for SDG-Aligned Policy Evaluation
The Principle of Distributional Weighting
The fundamental objective of distributional weighting is to standardize the welfare impact of a dollar across all income levels. This ensures that the well-being of every individual is considered equally, a prerequisite for achieving SDG 10. The methodology involves a systematic process:
- Population Segmentation: The population affected by a policy is divided into distinct income groups (e.g., quintiles).
- Impact Allocation: The unweighted costs and benefits of the policy are proportionally assigned to each income group.
- Weight Calculation: A weight is calculated for each group based on its average income. This weight is inversely proportional to income, reflecting that a dollar is more valuable to a person with lower income. A common model for this is the iso-elastic utility function.
- Application of Weights: The allocated costs and benefits for each group are multiplied by their respective weights.
- Aggregation: The weighted impacts are summed to produce a distributionally weighted net benefit, offering a more accurate measure of the policy’s effect on overall social welfare and its contribution to reducing inequality.
Addressing Methodological Extremes
A potential criticism of this approach is the “tyranny of the poor,” where extremely high weights for the lowest incomes could dominate the analysis. To ensure a balanced and defensible evaluation that supports broad societal progress under the SDGs, thresholds can be applied. A recommended practice is to cap weights at the extremes of the income distribution (e.g., a maximum weight of 5 and a minimum of 0.2), ensuring that the welfare of all groups is considered without disproportionately skewing the outcome. This pragmatic approach strengthens the credibility of the analysis as a tool for robust institutional decision-making, in line with SDG 16 (Peace, Justice and Strong Institutions).
Overcoming Bias in Distributional Analysis for Equitable Outcomes
Limitations of Standard Methodologies
The basic methodology, while a significant improvement, is susceptible to several biases that can misrepresent a policy’s true impact on vulnerable populations, thereby hindering progress on SDGs. These biases often arise from the use of aggregated, or “binned,” income data.
Identified Sources of Bias and Solutions
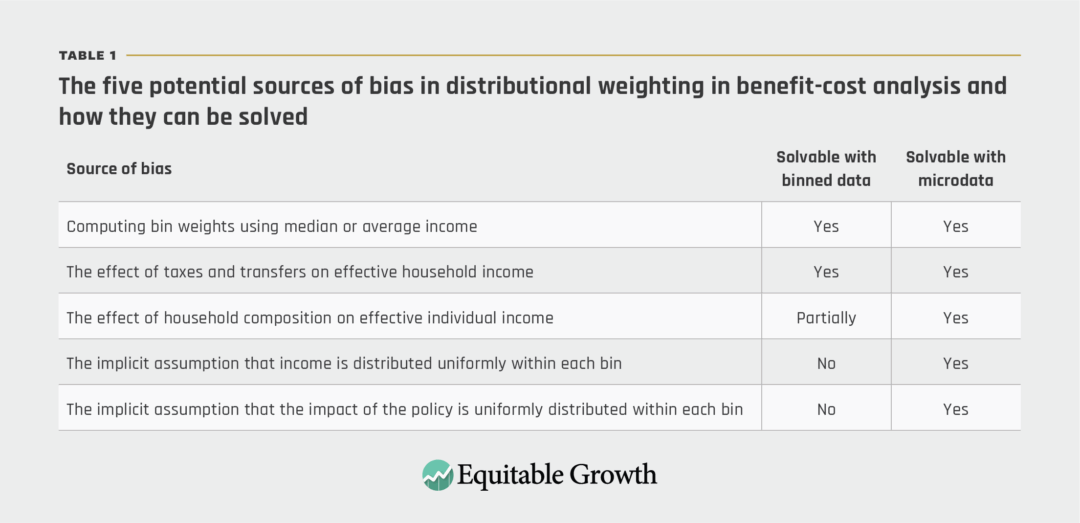
Five primary sources of bias have been identified, which, if unaddressed, can compromise the integrity of policy evaluations aimed at reducing inequality.
- Bin Weight Computation Bias: Using the weight at the midpoint of an income bin leads to a downward bias. An approximately unbiased weight can be achieved by averaging the weight at the midpoint with the average of the weights at the bin’s endpoints.
- Pre-Tax and Pre-Transfer Income Bias: Using gross income data overstates the weights for low-income households (who receive net transfers) and understates them for high-income households (who pay net taxes). This can be corrected by applying formulas to approximate post-tax-and-transfer income, providing a more accurate basis for welfare assessment relevant to SDG 1.
- Household Composition Bias: Household-level income data fails to account for household size. Larger households have lower effective per-capita income. Since lower-income households are often smaller, this bias can understate the weights for higher-income households. This can be partially corrected with formulas that approximate the effect of “equivalization” (adjusting income for household size).
- Intra-Bin Income Distribution Bias: Assuming a uniform distribution of income within a bin is often incorrect. This bias cannot be addressed with binned data.
- Intra-Bin Impact Distribution Bias: Assuming a uniform distribution of policy impact within a bin is also frequently incorrect. This bias also cannot be addressed with binned data.
The final two biases can only be effectively resolved by moving beyond binned data and utilizing individual-level microdata, a more advanced approach that significantly enhances the precision of analyses supporting the SDGs.
An Advanced Framework: Using Microdata for Precise SDG Impact Assessment
Leveraging Microdata for Unbiased Analysis
The limitations and biases inherent in binned data can be overcome by using microdata—datasets containing information on individuals and households. This approach allows for a granular analysis that aligns perfectly with the targeted nature of the SDGs.
Key Components of the Microdata Approach
- Identifying Affected Populations: When direct microdata on an affected population is unavailable, a “synthetic population” can be constructed. This involves using large, representative datasets (e.g., the American Community Survey) to create a sample that mirrors the key characteristics of the target group. This innovative technique expands the feasibility of conducting equitable analysis for a wide range of policies.
- Developing Proxy Measures for Impact: It is often unnecessary to know the exact dollar impact on each individual. Instead, a proxy measure that is proportional to the impact can be used (e.g., quantity of a product consumed, hours of exposure to a workplace hazard). This allows for the calculation of a “population weight”—the ratio of the distributionally weighted impact to the unweighted impact—which can then be applied to the total unweighted cost or benefit.
This microdata-driven methodology eliminates the need for assumptions about intra-bin distributions and allows for precise adjustments for taxes, transfers, and household composition, thereby providing a robust framework for evaluating a policy’s true contribution to SDG 10, SDG 3 (Good Health and Well-being), and SDG 8 (Decent Work and Economic Growth).
Case Studies: Applying Distributional Weighting to Advance the SDGs
FDA Rule on Talc-Containing Products (SDG 3)
An analysis of a proposed FDA regulation revealed that while consumers experienced both costs (price increases) and benefits (health improvements), the distribution of these impacts was not uniform. The costs were skewed more heavily toward lower-income households.
- Population Weight on Benefits: 1.397
- Population Weight on Costs: 1.957
This 40% difference means that a conventional BCA showing a net benefit could be reversed after weighting, as the welfare loss from the costs was significantly greater than the welfare gain from the benefits. This highlights how distributional weighting provides critical insights for policies affecting public health and consumer welfare, ensuring they do not disproportionately burden the poor.
Head Start Rule (SDG 4 and SDG 1)
An analysis of a rule increasing compensation for Head Start teachers, aimed at improving quality education (SDG 4), showed surprising results. While the unweighted BCA suggested costs outweighed benefits, distributional weighting reversed this conclusion.
- Unweighted Benefit-Cost Ratio: 0.624
- Weighted Benefit-Cost Ratio: 1.015
The analysis revealed that although teachers’ individual earnings are low, they often reside in higher-income households. However, the cost of the rule is borne by taxpayers, whose population weight was even lower. Furthermore, incorporating the benefits to children in Head Start—a population with a very high population weight (>4.0)—would demonstrate a significant positive welfare impact, reinforcing the policy’s alignment with poverty reduction (SDG 1) and educational equity.
OSHA Heat Rule (SDG 8)
For a proposed rule to reduce heat-related illness among workers, promoting decent work (SDG 8), distributional weighting provided a more nuanced, though less dramatic, picture.
- Unweighted Benefit-Cost Ratio: 1.18
- Weighted Benefit-Cost Ratio: 1.29
The analysis showed that affected workers were not predominantly from very low-income households, and the costs of compliance were shared by consumers and firm owners who were not exclusively high-income. While the adjustment was modest, it confirmed the rule’s positive welfare impact and demonstrated the method’s ability to challenge assumptions about the distribution of policy impacts.
Conclusion: Institutionalizing Equitable Analysis for Sustainable Development
Distributional weighting is not merely a technical exercise; it is a practical and essential tool for aligning public policy with the ethical imperatives of the Sustainable Development Goals. Methodological advances, including the use of synthetic populations and proxy measures from microdata, have made this form of analysis feasible for a wide range of government agencies and organizations. By correcting the inherent bias against lower-income populations in conventional benefit-cost analysis, distributional weighting enables policymakers to make more informed decisions that genuinely advance SDG 10 (Reduced Inequalities) and SDG 1 (No Poverty). Building institutional capacity (SDG 16) to implement these techniques is a critical step toward ensuring that economic analysis supports the creation of a more just, equitable, and sustainable future for all.
Sustainable Development Goals (SDGs) Analysis
1. Which SDGs are addressed or connected to the issues highlighted in the article?
The article primarily addresses issues related to economic inequality and institutional effectiveness, connecting directly to the following Sustainable Development Goals:
- SDG 10: Reduced Inequalities: This is the most central SDG to the article. The entire premise of distributional weighting is to correct a systemic bias in benefit-cost analysis that undervalues the welfare of lower-income individuals. The article explicitly states the goal is to overcome “bias against lower-income individuals” and emphasizes the importance of “measuring income inequality.” By placing the “welfare of all individuals on a level playing field,” the methodology directly targets the reduction of economic disparities in policy outcomes.
- SDG 1: No Poverty: While not the primary focus, SDG 1 is intrinsically linked. The methodology gives greater weight to the economic impacts on those with “very low incomes.” The article discusses how this can lead to a “tyranny of the poor,” where policy impacts on low-income people dominate the analysis. This demonstrates a direct concern for how policies affect the most economically vulnerable, which is the core of SDG 1. By ensuring the benefits of policies for the poor are not underestimated, this tool can support the creation of more effective poverty-reduction strategies.
- SDG 16: Peace, Justice and Strong Institutions: The article discusses improving the tools and processes of governmental bodies. It focuses on “federal regulatory agencies” and their primary guidance document, “Circular A-4.” The author’s goal is to make distributional weighting a practical, “timely, and resource efficient” tool for “federal agencies and nonprofit organizations.” This effort aims to develop more effective, accountable, and inclusive institutions (a key aspect of SDG 16) by ensuring their decision-making processes are ethically responsible and accurately reflect the welfare of all citizens.
2. What specific targets under those SDGs can be identified based on the article’s content?
Based on the analysis, the following specific SDG targets are relevant:
-
SDG 10: Reduced Inequalities
- Target 10.2: “By 2030, empower and promote the social, economic and political inclusion of all, irrespective of… economic or other status.” The proposed methodology is a direct tool for promoting economic inclusion. By adjusting dollar valuations to reflect the diminishing marginal utility of income, it ensures that the economic welfare of lower-income groups is given appropriate consideration in policy analysis, preventing their needs from being systematically overlooked.
- Target 10.3: “Ensure equal opportunity and reduce inequalities of outcome, including by eliminating discriminatory… policies and practices…” Distributional weighting is presented as a practice to counteract the de facto discriminatory effect of standard benefit-cost analysis, which favors policies benefiting higher-income individuals. By correcting this bias, it helps in designing policies that can lead to more equitable outcomes.
-
SDG 1: No Poverty
- Target 1.2: “By 2030, reduce at least by half the proportion of men, women and children of all ages living in poverty in all its dimensions according to national definitions.” The article’s methodology provides a more accurate way to assess policies aimed at poverty reduction. By applying high weights to impacts on individuals with “very low incomes” (e.g., a threshold of 5 for those with an income of approximately $14,000), the tool ensures that the true welfare gains from poverty-alleviation policies are fully captured, making such policies more likely to be deemed beneficial and implemented.
-
SDG 16: Peace, Justice and Strong Institutions
- Target 16.6: “Develop effective, accountable and transparent institutions at all levels.” The article is fundamentally about improving the institutional practice of “regulatory impact analysis” within government. The author’s goal to create an “instruction manual” and provide “hands-on guidance” for agencies is a direct effort to build institutional capacity for more equitable and accountable policymaking. The analysis of the FDA and OSHA rules serves as a real-world example of how this tool can make institutional analysis more transparent about its distributional consequences.
3. Are there any indicators mentioned or implied in the article that can be used to measure progress towards the identified targets?
The article does not mention official SDG indicators, but it proposes and utilizes several specific metrics that function as indicators for measuring the distributional impact of policies, thereby tracking progress towards the identified targets.
- Distributionally weighted net benefit: This is the core metric proposed. It measures the overall welfare impact of a policy after accounting for income inequality. A positive distributionally weighted net benefit for a policy aimed at low-income groups would indicate progress toward Targets 1.2 and 10.3. The article provides a clear example: a rule that seemed like a “poor investment” with an unweighted benefit-cost ratio of 0.624 was shown to “break even” with a weighted ratio of 1.015, indicating a more positive welfare outcome.
- Population weight: The article defines this as “the ratio of distributionally weighted cost or benefit to unweighted cost or benefit.” This indicator directly measures the extent to which a policy’s costs or benefits are concentrated among lower- or higher-income groups. For example, the analysis of the FDA talc rule found a population weight for consumer costs of 1.957, indicating that the costs were heavily skewed toward lower-income individuals, a key insight for assessing progress on Target 10.2.
- Post-tax-and-transfer income adjusted for household composition (equivalized income): The article argues that weighting should be based on this measure of income as it “is actually available for consumption.” This serves as a foundational indicator for accurately assessing an individual’s or household’s economic well-being. Using this measure allows for a more precise understanding of income distribution and the real-world impact of policies on different households, which is crucial for monitoring inequality (Target 10.2).
4. Table of SDGs, Targets, and Indicators
| SDGs | Targets | Indicators (Implied or Mentioned in Article) |
|---|---|---|
| SDG 10: Reduced Inequalities |
|
|
| SDG 1: No Poverty |
|
|
| SDG 16: Peace, Justice and Strong Institutions |
|
|
Source: equitablegrowth.org
What is Your Reaction?
 Like
0
Like
0
 Dislike
0
Dislike
0
 Love
0
Love
0
 Funny
0
Funny
0
 Angry
0
Angry
0
 Sad
0
Sad
0
 Wow
0
Wow
0


