Minnesota’s Renville County seeing some tax shift from ag to residential – West Central Tribune

Report on Property Taxation and Value Dynamics in Renville County
Executive Summary: Aligning Fiscal Policy with Sustainable Development Goals
A report from the Renville County Assessor to the Board of Commissioners highlights an impending shift in the local property tax structure. This shift, driven by rising residential property values against stagnant farmland values, has significant implications for several United Nations Sustainable Development Goals (SDGs). The analysis indicates that while the tax burden will increasingly move towards residential properties, the agricultural sector’s vast market value will ensure it remains the primary contributor. This report examines these dynamics through the lens of SDG 10 (Reduced Inequalities), SDG 11 (Sustainable Cities and Communities), and SDG 2 (Zero Hunger), focusing on the need for equitable and sustainable fiscal policy.
Current State of Property Valuation and Tax Distribution
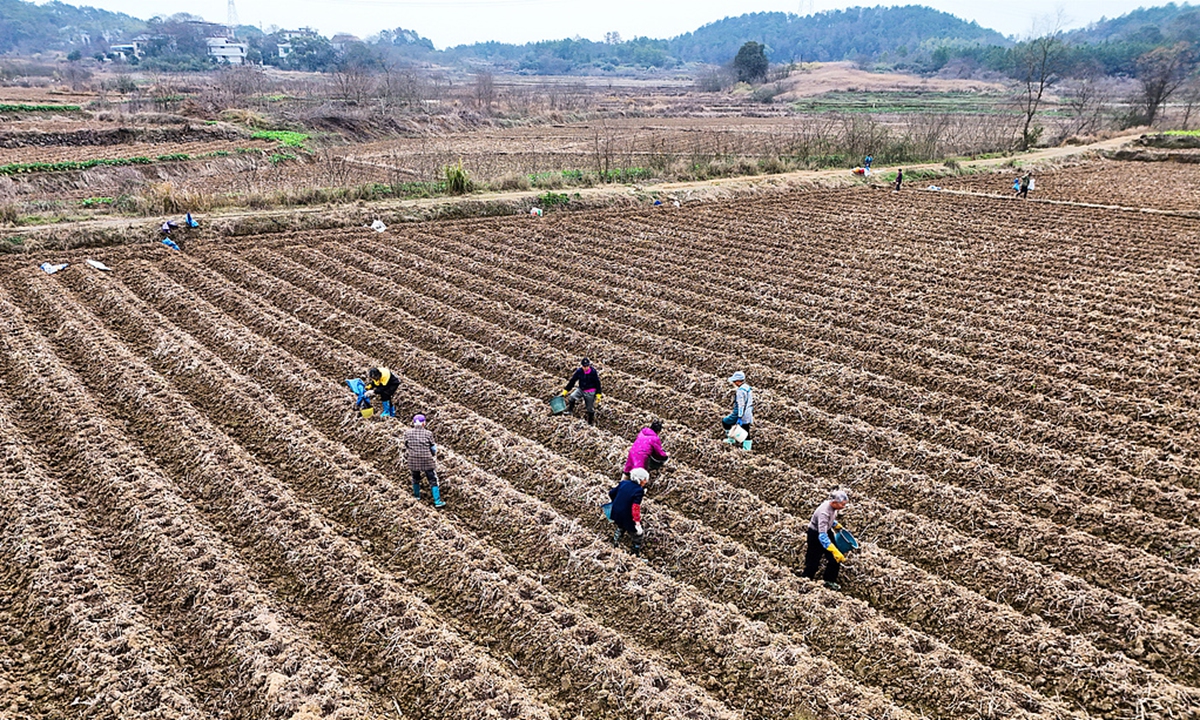
The distribution of property value in Renville County underscores the region’s economic foundation in agriculture. This composition is central to understanding the fiscal challenges and opportunities related to sustainable community development.
- SDG 11: Sustainable Cities and Communities: The balance between agricultural and residential land use is a core component of sustainable community planning.
Market Value Distribution (2026 Projections)
- Agricultural Property: 86% ($6,361,096,300)
- Residential Property: 11% ($840,336,700)
- Commercial Property: 2% ($162,420,100)
- Other Property: 1% ($33,859,500)
Net Property Tax Contribution
- Agricultural Sector: 58% ($22,644,456)
- Residential Sector: 24% ($9,397,232)
Analysis of Economic Trends and SDG Implications
The diverging value trends between property types present challenges to achieving equitable growth and community stability.
Impact on SDG 10 (Reduced Inequalities)
The tax shift threatens to increase the financial burden on homeowners, potentially exacerbating economic inequalities.
- Residential property values are consistently rising, following statewide trends.
- As home values increase beyond $95,000, the homestead exclusion becomes less effective, increasing the taxable value and the burden on homeowners.
- This dynamic could disproportionately affect low- and middle-income households, working against the goal of reducing inequality within the community.
Impact on SDG 2 (Zero Hunger) and SDG 8 (Decent Work and Economic Growth)
The stability of the agricultural sector is paramount for local food security and economic vitality. Fiscal policy must support the viability of farming operations.
- Farmland values have shown volatility, with a 36.31% increase in 2024 followed by a 4.6% decrease in the subsequent year.
- Despite this, the agricultural sector’s large value base provides a stable foundation for the county’s tax revenue, which funds essential services supporting economic growth.
- Legislative action has raised the agricultural homestead exemption to $3.8 million, a measure that supports farm viability and, by extension, the goals of ensuring food security and promoting decent work in the agricultural sector.
Future Outlook and Governance
Proactive monitoring and policy adjustment are essential for navigating these fiscal changes in a manner consistent with sustainable development principles.
- SDG 17 (Partnerships for the Goals): The County Assessor’s office will conduct its annual sales ratio study to inform tax assessments for 2027. This data-driven approach exemplifies strong institutional practice for achieving sustainable goals.
- The ongoing analysis of property sales and market trends will be critical for ensuring the tax system remains fair and equitable, balancing the needs of both residential and agricultural stakeholders to foster a resilient and sustainable community.
Analysis of the Article in Relation to Sustainable Development Goals
1. Which SDGs are addressed or connected to the issues highlighted in the article?
- SDG 2: Zero Hunger: The article’s core discussion revolves around the economic viability of the agricultural sector, which is fundamental to food production. The tax burden on farmland directly impacts the financial stability of farms and farmers.
- SDG 10: Reduced Inequalities: The central theme is the “tax shift” and the distribution of the tax burden between different economic groups—namely, agricultural landowners and residential property owners. This directly addresses fiscal policies and their role in creating or mitigating economic inequality within a community.
- SDG 11: Sustainable Cities and Communities: The article discusses the rising value of residential properties and the increasing tax burden on homeowners. This relates to housing affordability, a key component of creating sustainable and inclusive communities.
- SDG 16: Peace, Justice and Strong Institutions: The article showcases the functioning of local government institutions. The County Assessor’s report to the Board of Commissioners is an example of an accountable and transparent institution working to manage public finances and explain fiscal policy to the public.
2. What specific targets under those SDGs can be identified based on the article’s content?
- Target 10.4: “Adopt policies, especially fiscal, wage and social protection policies, and progressively achieve greater equality.” The entire article is an analysis of a local fiscal policy (property taxation) and its distributional effects. The discussion about how the tax burden shifts between agricultural and residential properties is a direct examination of this target in practice. The mention of the homestead exemption is an example of a specific policy tool used to influence this equality.
- Target 2.4: “By 2030, ensure sustainable food production systems and implement resilient agricultural practices…” The economic sustainability of agriculture is a prerequisite for achieving this target. The article highlights the financial pressures on the agricultural sector, which constitutes 86% of the county’s property value and pays 58% of its property taxes. The stability of farmland values and the associated tax load are critical factors for the long-term resilience of food production in the region.
- Target 11.1: “By 2030, ensure access for all to adequate, safe and affordable housing…” The article points out that “residential property owners feeling the pain” due to rising property values and a growing share of the tax burden. This directly impacts housing affordability, as increased taxes are a significant component of the cost of homeownership.
- Target 16.6: “Develop effective, accountable and transparent institutions at all levels.” The article is based on a presentation by the County Assessor to the County Board of Commissioners. This action represents a local government institution operating transparently by publicly reporting on property valuations, tax shifts, and the factors influencing them, thereby ensuring accountability to taxpayers.
3. Are there any indicators mentioned or implied in the article that can be used to measure progress towards the identified targets?
-
Indicators for Target 10.4 (Reduced Inequalities):
- Distribution of property tax burden: The article explicitly states that agricultural properties pay 58% of net property taxes, while residential properties pay 24%. Tracking this ratio over time would measure shifts in the fiscal burden.
- Distribution of market value: The article provides a clear breakdown: agricultural property represents 86% of the county’s value, residential 11%, and commercial 2%. Changes in these proportions indicate economic shifts that influence tax policy.
-
Indicators for Target 2.4 (Zero Hunger):
- Annual change in farmland value: The article provides specific data points, noting that farmland values “jumped by 36.31% in 2024” and “decreased by 4.6%” in the last year. This volatility is a key indicator of the economic stability of the agricultural sector.
-
Indicators for Target 11.1 (Sustainable Cities and Communities):
- Annual change in residential property value: The article states that residential values “continue to show year-by-year increases,” which is a direct measure of housing cost pressures.
- Impact of homestead exclusion limits: The article implies an indicator by explaining that as home values rise over $95,000, “more taxable value per property” is created. This measures how tax policy affects affordability for lower- and middle-value homes.
-
Indicators for Target 16.6 (Strong Institutions):
- Public reporting on fiscal matters: The existence of the assessor’s presentation to the commissioners, as reported in the article, serves as a qualitative indicator of institutional transparency and accountability. The annual sales ratio study mentioned is a formal mechanism for this reporting.
Summary of SDGs, Targets, and Indicators
| SDGs | Targets | Indicators |
|---|---|---|
| SDG 10: Reduced Inequalities | 10.4: Adopt policies, especially fiscal, to achieve greater equality. |
|
| SDG 2: Zero Hunger | 2.4: Ensure sustainable food production systems. |
|
| SDG 11: Sustainable Cities and Communities | 11.1: Ensure access for all to adequate and affordable housing. |
|
| SDG 16: Peace, Justice and Strong Institutions | 16.6: Develop effective, accountable and transparent institutions. |
|
Source: wctrib.com
What is Your Reaction?
 Like
0
 Dislike
0
 Love
0
 Funny
0
 Angry
0
 Sad
0
Sad
0
 Wow
0
Wow
0


