


October 24, 2025: Beijing among top 10 most polluted cities in the world – IQAir
Air Quality Report: Beijing, China – October 24, 2025
Executive Summary
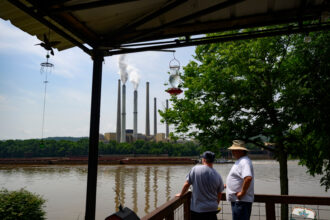
On October 24, 2025, the city of Beijing reported an Air Quality Index (AQI) of 166, classified as “unhealthy.” This condition, primarily driven by high concentrations of PM2.5, poses significant risks to public health, directly challenging the objectives of Sustainable Development Goal 3 (SDG 3: Good Health and Well-being). The elevated pollution levels underscore the urgent need for measures to ensure healthy lives and promote well-being for all residents. This report analyzes the current situation, its causes, and its broader implications for sustainable urban development.
Analysis of Urban Air Pollution and SDG Implications
Current Air Quality Status and Public Health
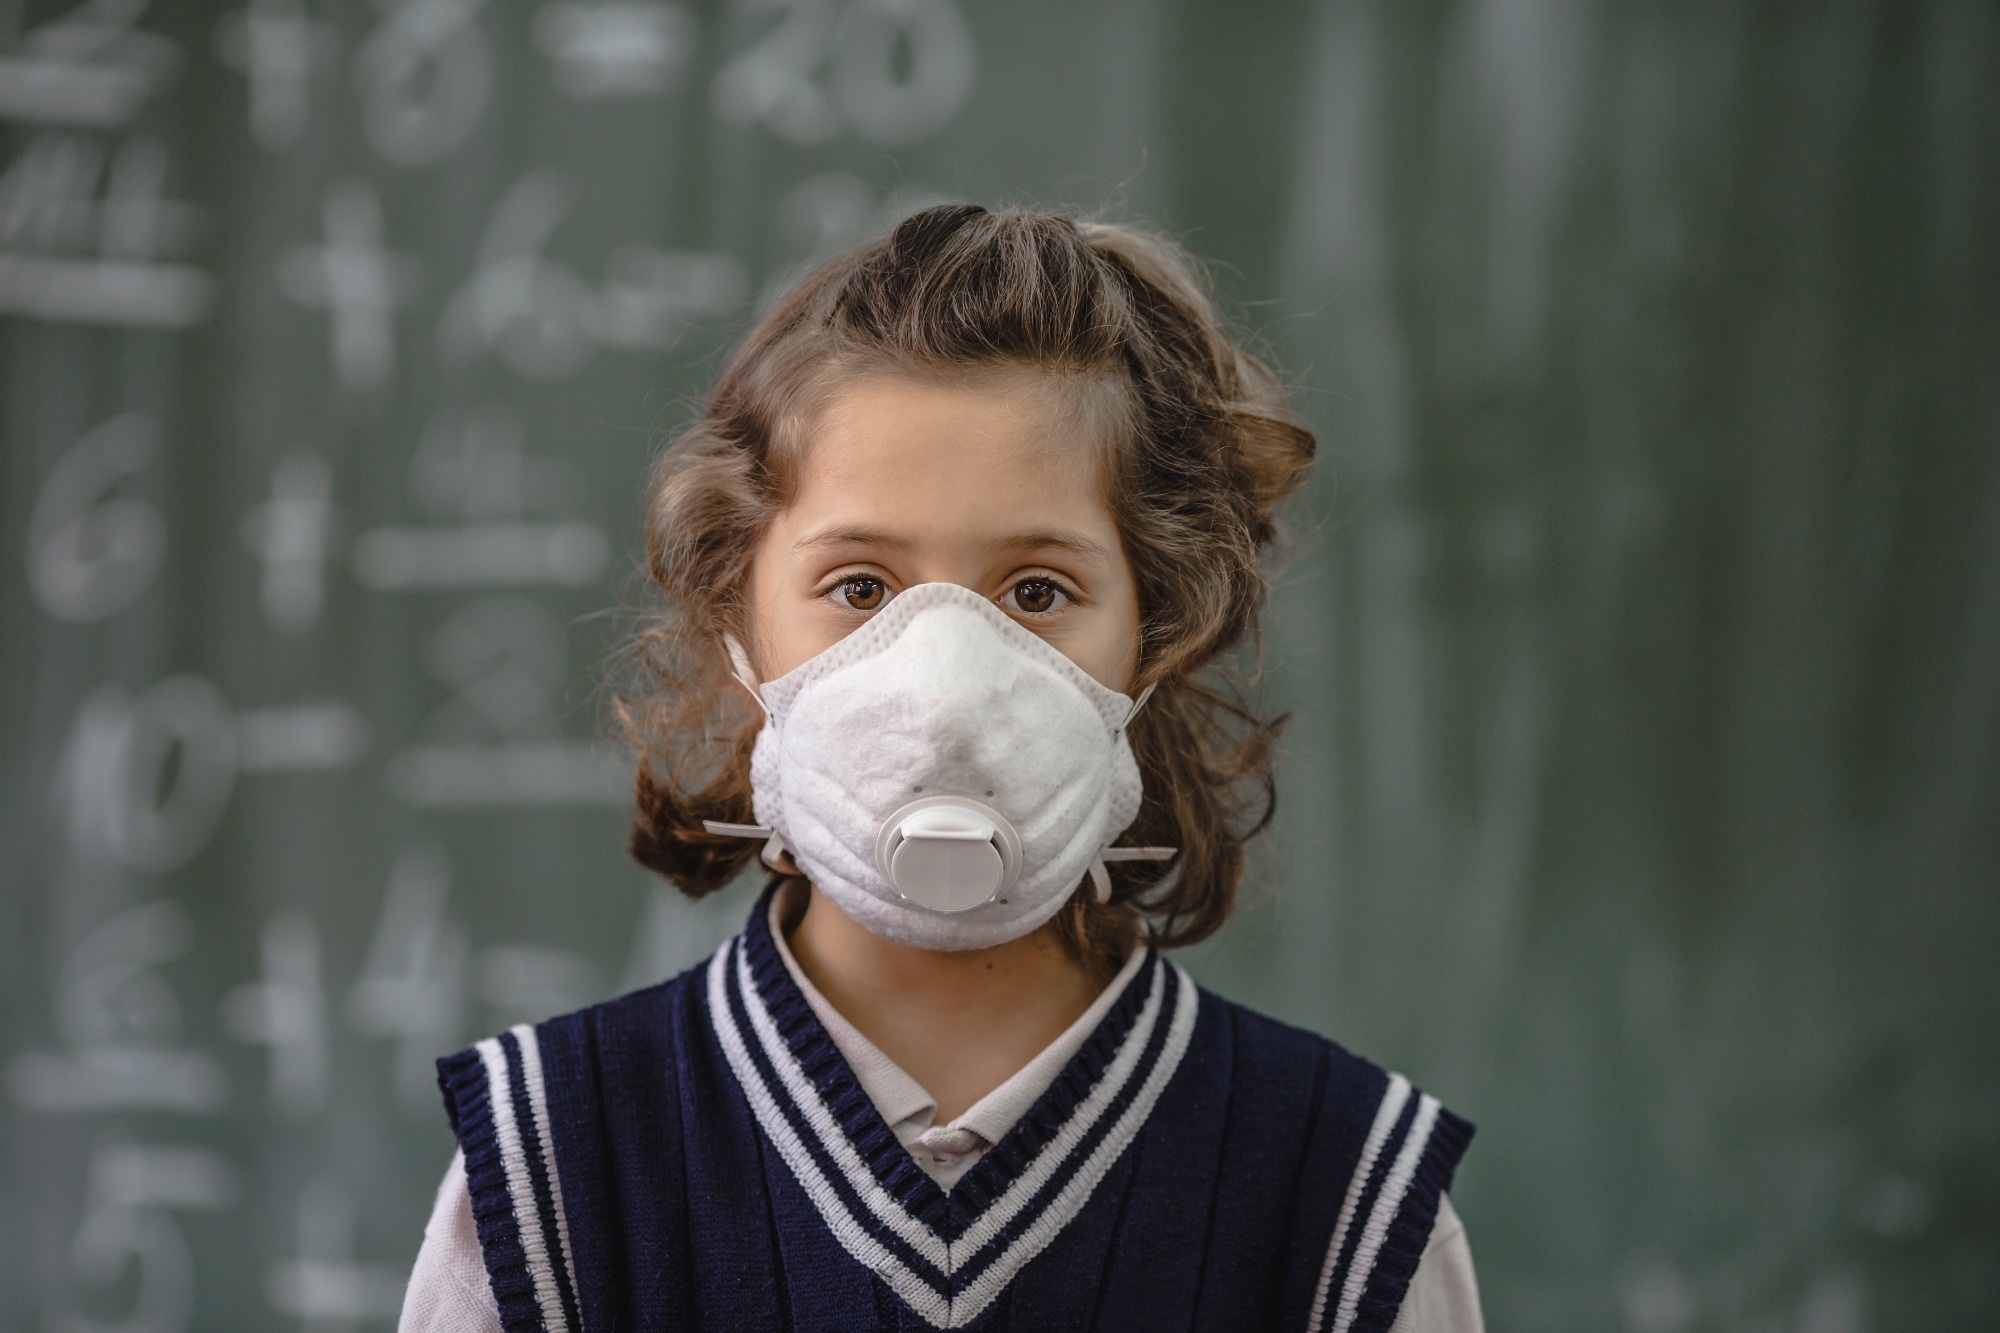
The AQI of 166 indicates that all individuals may experience adverse health effects, with more severe impacts on sensitive populations. This situation compromises progress towards SDG 3 by increasing the incidence of respiratory and other pollution-related illnesses. The data highlights a critical failure in providing a safe environment, a key target of SDG 11 (Sustainable Cities and Communities), which aims to reduce the adverse per capita environmental impact of cities, including air quality.
Comparative Analysis of Major Chinese Cities
The air quality challenge extends beyond Beijing, indicating a systemic issue impacting national progress on the SDGs. On this date, Beijing ranked as the 3rd most polluted major city globally. Other major urban centers also recorded poor air quality, challenging the sustainability of urban growth across the nation:
- Shenzhen: 11th
- Guangzhou: 12th
- Chongqing: 24th
- Wuhan: 29th
- Hangzhou: 34th
Historical Context and Global Health Standards
The 2024 annual average PM2.5 concentration for Beijing was 30.9 µg/m³, corresponding to a “moderate” AQI of 92. This figure is 6.2 times the World Health Organization’s (WHO) annual air quality guideline. This chronic exposure to harmful pollutants represents a long-term obstacle to achieving SDG 3 targets related to reducing mortality from non-communicable diseases and environmental risks.
Causative Factors and Socio-Economic Impact
Primary Sources of Air Pollution
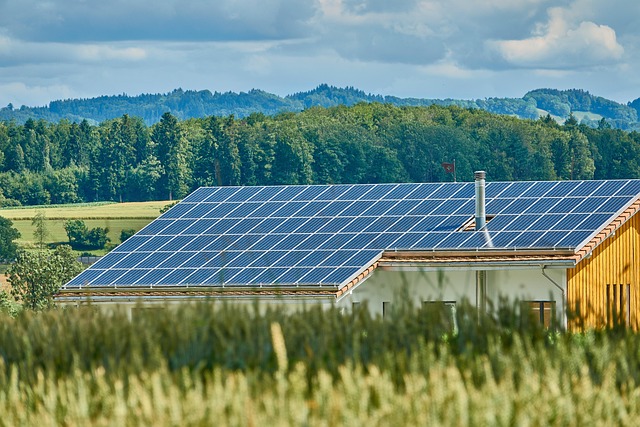
The current pollution episode is attributed to a combination of anthropogenic and meteorological factors that conflict with several SDGs. These sources highlight the need for a transition towards sustainable practices as outlined in SDG 7 (Affordable and Clean Energy) and SDG 11.
- Fine Particulate Matter (PM2.5): Emissions from industrial processes, vehicle exhaust, and residential heating are major contributors.
- Ozone Formation: Photochemical reactions are exacerbated by high temperatures and stagnant atmospheric conditions.
- Regional Pollutant Transport: Air masses from adjacent industrial zones compound local emissions, demonstrating the need for cross-jurisdictional cooperation as envisioned in SDG 17 (Partnerships for the Goals).
- Meteorological Conditions: Seasonal temperature inversions trap pollutants near the surface, preventing their dispersal.
Health and Economic Consequences
Persistent air pollution in the Beijing-Tianjin-Hebei region results in substantial health-related economic losses, estimated to be in the billions of RMB annually from PM2.5 and ozone alone. These costs represent a significant burden on public health systems and the economy, undermining the principles of sustainable economic growth and well-being central to SDG 3 and SDG 8 (Decent Work and Economic Growth). The need for coordinated control strategies is paramount to mitigate these impacts and align development with the 2030 Agenda for Sustainable Development.
Forecast and Meteorological Outlook
Short-Term Air Quality Forecast
Air quality in Beijing is projected to improve as shifting wind patterns are expected to aid in the dispersion of accumulated pollutants. This forecast highlights the dynamic nature of air quality and its dependence on meteorological conditions.
Meteorological Influences
Scientific studies confirm that short-term variations in pollutant levels are heavily influenced by factors such as temperature gradients, mid-latitude circulation, and surface pressure systems. Understanding these dynamics is crucial for developing effective pollution control and public alert systems, contributing to the resilience and safety of cities as targeted by SDG 11.
Analysis of Sustainable Development Goals in the Article
1. Which SDGs are addressed or connected to the issues highlighted in the article?
-
SDG 3: Good Health and Well-being
- The article directly connects poor air quality to negative health outcomes. It states that at an AQI of 166, “everyone may begin to experience health effects, and members of sensitive groups may experience more serious effects.” This highlights the immediate health risks posed by air pollution. Furthermore, it mentions the “substantial health and economic consequences,” including “annual health-related economic losses,” which underscores the long-term burden of pollution on public health.
-
SDG 11: Sustainable Cities and Communities
- The article’s focus is on the environmental conditions within a major urban area, Beijing. It describes the city’s air quality as “unhealthy” and notes that “Beijing ranks as the 3rd most polluted major city in the world.” By detailing the pollution levels in a major city and listing other affected urban centers like Shenzhen and Guangzhou, the article directly addresses the challenge of managing urban environmental quality and making cities safe and sustainable.
2. What specific targets under those SDGs can be identified based on the article’s content?
-
Target 3.9: Substantially reduce deaths and illnesses from pollution
- This target aims to “By 2030, substantially reduce the number of deaths and illnesses from hazardous chemicals and air, water and soil pollution and contamination.” The article’s entire premise revolves around the health risks of air pollution in Beijing. The mention of PM2.5, a hazardous pollutant, and its associated “health effects” and “health-related economic losses” directly relates to the illnesses and economic burdens that this target seeks to reduce.
-
Target 11.6: Reduce the environmental impact of cities
- This target aims to “By 2030, reduce the adverse per capita environmental impact of cities, including by paying special attention to air quality…” The article’s detailed reporting on Beijing’s “unhealthy” air quality, high PM2.5 concentrations, and its ranking as a highly polluted city directly addresses the core issue of this target. The discussion of pollution sources like “vehicles, industries, and residential heating” points to the urban activities contributing to this adverse environmental impact.
3. Are there any indicators mentioned or implied in the article that can be used to measure progress towards the identified targets?
-
Indicator 3.9.1: Mortality rate attributed to household and ambient air pollution
- While the article does not provide a specific mortality rate, it directly discusses the cause measured by this indicator: ambient air pollution. The statements about “health effects,” “serious effects” for sensitive groups, and “health-related economic losses” are direct consequences of the pollution that this indicator tracks. The data on PM2.5 levels serves as a proxy for the risk of mortality and illness from air pollution.
-
Indicator 11.6.2: Annual mean levels of fine particulate matter (e.g. PM2.5) in cities
- The article provides precise data for this indicator. It explicitly states that “the average PM2.5 concentration in 2024 for Beijing was 30.9 µg/m³.” It also compares this value to a global standard, noting it was “6.2 times the WHO annual guideline of 5 µg/m³.” This quantitative data is exactly what Indicator 11.6.2 is designed to measure to track urban air quality over time.
4. Create a table with three columns titled ‘SDGs, Targets and Indicators” to present the findings from analyzing the article. In this table, list the Sustainable Development Goals (SDGs), their corresponding targets, and the specific indicators identified in the article.
| SDGs | Targets | Indicators |
|---|---|---|
| SDG 3: Good Health and Well-being | Target 3.9: By 2030, substantially reduce the number of deaths and illnesses from hazardous chemicals and air, water and soil pollution and contamination. | Indicator 3.9.1: Mortality rate attributed to household and ambient air pollution (Implied through discussion of health effects and economic losses from PM2.5). |
| SDG 11: Sustainable Cities and Communities | Target 11.6: By 2030, reduce the adverse per capita environmental impact of cities, including by paying special attention to air quality and municipal and other waste management. | Indicator 11.6.2: Annual mean levels of fine particulate matter (e.g. PM2.5 and PM10) in cities (population weighted) (Directly mentioned: “the average PM2.5 concentration in 2024 for Beijing was 30.9 µg/m³”). |
Source: iqair.com
What is Your Reaction?
 Like
0
Like
0
 Dislike
0
Dislike
0
 Love
0
Love
0
 Funny
0
Funny
0
 Angry
0
Angry
0
 Sad
0
Sad
0
 Wow
0
Wow
0