How much energy does AI use? – Hypergrid Business

Report on Energy Consumption, Technological Innovation, and Sustainable Development Goals
1.0 Executive Summary
This report analyzes the energy consumption and carbon dioxide (CO2) emissions associated with various artificial intelligence (AI) and digital activities, contextualizing these findings within the framework of the United Nations Sustainable Development Goals (SDGs). It highlights the significant energy footprint of common technologies while also noting substantial progress in renewable energy generation, a key component of SDG 7 (Affordable and Clean Energy) and SDG 13 (Climate Action). The report evaluates the dual impact of AI as both an energy consumer and a potential accelerator for achieving goals such as SDG 3 (Good Health and Well-being) and SDG 9 (Industry, Innovation, and Infrastructure).
2.0 Comparative Analysis of Energy Consumption and Carbon Footprint
Data from a TRG Datacenters study provides a comparative overview of the environmental impact of various activities. The following list details the energy usage (in watt-hours) and CO2 emissions per unit of activity, ordered from highest to lowest consumption. This data is critical for understanding consumption patterns as outlined in SDG 12 (Responsible Consumption and Production).
- Video Streaming (1 hour): 120 watt-hours; 42 grams of CO2.
- Microwave Use (5 minutes): 120 watt-hours.
- AI Video Generation (6-10 second clip): 50 watt-hours; 18 grams of CO2.
- Zoom Call (1 hour): 49 watt-hours; 17 grams of CO2.
- Email (short, no attachment): 13 watt-hours; 4.7 grams of CO2.
- AI Image Generation (single image): 3 watt-hours; 1 gram of CO2.
- AI Chatbot (voice query): 0.5 watt-hours; 0.2 grams of CO2.
- Google Search / AI Chatbot (text query): 0.33 watt-hours; 0.1 grams of CO2.
- Gemini AI Chatbot (text query): 0.12 watt-hours; 0.04 grams of CO2.
For transportation, a one-mile drive in a standard gasoline-powered vehicle releases approximately 400 grams of CO2. This underscores the significant climate impact of conventional transport and the importance of transitioning to sustainable alternatives as outlined in SDG 11 (Sustainable Cities and Communities).
3.0 Progress in Clean Energy Generation and Contribution to SDG 7
Recent data indicates significant positive trends in renewable energy, directly supporting SDG 7 (Affordable and Clean Energy) and contributing to SDG 13 (Climate Action).
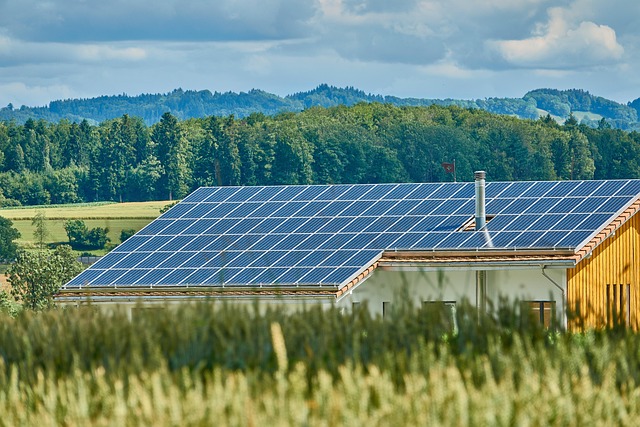
- United States: Solar power production has increased by 36% since late 2024, offsetting 80% of the nation’s 2.1% rise in total energy demand.
- Global: In the first three months of 2025, global solar power generation grew by 31%. Combined with growth in wind and nuclear power, this led to a slight decrease in fossil-fuel-powered electricity generation.
- Demand vs. Production: Research from the energy think tank Ember confirms that clean power production growth has outpaced the growth in global energy demand in 2025.
4.0 The Role of Artificial Intelligence in Sustainable Development
While AI data centers are significant consumers of energy and water, their potential to advance sustainable development must be considered. This aligns with SDG 9 (Industry, Innovation, and Infrastructure), which promotes inclusive and sustainable industrialization.
- Challenges: The energy and resource intensity of AI infrastructure necessitates a focus on efficiency and the use of renewable energy sources to mitigate its environmental impact.
- Opportunities: AI has the potential to yield dramatic benefits and productivity improvements. Its application in accelerating stem cell research, drug discovery, and cancer treatments directly contributes to SDG 3 (Good Health and Well-being).
5.0 Recommendations for Responsible Consumption and Climate Action
To align personal and industrial practices with SDG 12 (Responsible Consumption and Production) and SDG 13 (Climate Action), several strategies can be adopted to offset the environmental impact of technology use.
- Reduce reliance on personal gasoline-powered vehicles by consolidating trips or utilizing alternative transportation methods.
- Optimize logistics for deliveries to minimize transportation-related emissions.
- Adopt lifestyle habits, such as walking, which not only reduce carbon footprints but also offer significant health benefits, contributing to SDG 3 (Good Health and Well-being).
Analysis of Sustainable Development Goals in the Article
1. Which SDGs are addressed or connected to the issues highlighted in the article?
-
SDG 7: Affordable and Clean Energy
- The article directly addresses this goal by discussing energy consumption from various digital and daily activities. It highlights the growth of clean energy sources, stating that “U.S. solar power production grew by 36%” and globally, “solar power generation grew by 31%.” It also notes that “Wind and nuclear also grew, while fossil-powered electricity generation actually decreased slightly,” which is central to achieving affordable and clean energy.
-
SDG 9: Industry, Innovation, and Infrastructure
- This goal is relevant through the article’s focus on the infrastructure of the digital economy, particularly AI data centers and their energy consumption. The discussion on making technology more efficient, such as Gemini using less energy for a text prompt (“0.12 watt-hours”) compared to other chatbots (“a third of a watt-hour”), points towards innovation for sustainable industrial processes and infrastructure. The growth in clean power infrastructure (solar, wind) is also a key component of this goal.
-
SDG 12: Responsible Consumption and Production
- The article promotes responsible consumption by providing data on the energy and carbon footprint of consumer choices, from streaming videos to using AI and driving a car. It encourages readers to make informed decisions to offset their environmental impact, suggesting they “cut back on the drives to the supermarket” or “consolidate your Amazon deliveries.” This aligns with creating awareness for sustainable consumption patterns.
-
SDG 13: Climate Action
- Climate action is a core theme, as the article quantifies the CO2 emissions associated with numerous activities. For example, it states that a one-mile drive in a gas-powered car “releases 400 grams of CO2” and an hour of streaming Netflix releases “42 grams of CO2.” The positive news about clean power production growing faster than demand and offsetting increases in energy demand directly relates to mitigating climate change.
2. What specific targets under those SDGs can be identified based on the article’s content?
-
Under SDG 7 (Affordable and Clean Energy):
- Target 7.2: “By 2030, increase substantially the share of renewable energy in the global energy mix.” The article directly supports this by citing statistics on the significant growth of solar power in the U.S. (36%) and globally (31%), the growth of wind and nuclear power, and the fact that “clean power production grew faster than demand this year.”
- Target 7.3: “By 2030, double the global rate of improvement in energy efficiency.” The article implies this target by comparing the energy efficiency of different technologies. For instance, it highlights that an AI text prompt to Gemini is more efficient (0.12 watt-hours) than a standard AI chatbot query or a Google search (a third of a watt-hour).
-
Under SDG 9 (Industry, Innovation, and Infrastructure):
- Target 9.4: “By 2030, upgrade infrastructure and retrofit industries to make them sustainable, with increased resource-use efficiency and greater adoption of clean and environmentally sound technologies…” The article discusses the upgrading of energy infrastructure through the massive increase in solar and wind power. The development of more energy-efficient AI like Gemini is an example of adopting cleaner technologies in the tech industry.
-
Under SDG 12 (Responsible Consumption and Production):
- Target 12.8: “By 2030, ensure that people everywhere have the relevant information and awareness for sustainable development and lifestyles…” The entire article, based on the TRG Datacenters report, serves to provide this information. It educates readers on the energy (watt-hours) and carbon (grams of CO2) costs of their daily digital and physical activities, enabling more sustainable lifestyle choices.
-
Under SDG 13 (Climate Action):
- Target 13.2: “Integrate climate change measures into national policies, strategies and planning.” The article’s data on the growth of renewable energy (“U.S. solar power production grew by 36%”) and its reference to EPA data on vehicle emissions suggest the real-world outcomes of policies aimed at combating climate change. The shift in the energy mix is a direct result of such integrated measures.
3. Are there any indicators mentioned or implied in the article that can be used to measure progress towards the identified targets?
-
For Target 7.2 (Increase renewable energy share):
- Indicator: Share of renewable energy in the energy mix. The article provides specific data points: “U.S. solar power production grew by 36% since late 2024,” “globally… solar power generation grew by 31%,” and the fact that clean power (solar, wind, nuclear) growth outpaced demand growth.
-
For Target 7.3 (Improve energy efficiency):
- Indicator: Energy intensity of specific activities. The article provides precise measurements: 120 watt-hours for one hour of streaming, 50 watt-hours for an AI video clip, 3 watt-hours for an AI image, and 0.12 watt-hours for a Gemini query. These figures serve as direct indicators of the energy efficiency of various technologies.
-
For Target 13.2 (Integrate climate change measures) and Target 12.8 (Sustainable development awareness):
- Indicator: Greenhouse gas emissions per activity. The article quantifies CO2 emissions for specific consumer actions: “42 grams of CO2” for an hour of streaming, “18 grams of CO2” for an AI video, and “400 grams of CO2” for a one-mile drive in a gas car. This data allows for tracking the carbon footprint of consumption patterns.
4. Table of SDGs, Targets, and Indicators
| SDGs | Targets | Indicators |
|---|---|---|
| SDG 7: Affordable and Clean Energy |
7.2: Increase substantially the share of renewable energy.
7.3: Double the global rate of improvement in energy efficiency. |
– Percentage growth in solar power production (36% in U.S., 31% globally). – Mention of growth in wind and nuclear power generation. – Energy consumption per activity (e.g., 120 Wh for streaming, 3 Wh for an AI image). |
| SDG 9: Industry, Innovation, and Infrastructure | 9.4: Upgrade infrastructure and retrofit industries to make them sustainable and increase resource-use efficiency. |
– Growth of clean energy infrastructure (solar, wind). – Data on improved energy efficiency of new technologies (e.g., Gemini’s lower energy use per query). |
| SDG 12: Responsible Consumption and Production | 12.8: Ensure people have relevant information and awareness for sustainable lifestyles. |
– Provision of comparative data on energy and CO2 emissions for daily activities (streaming, email, driving). – Suggestions for offsetting consumption (e.g., driving less). |
| SDG 13: Climate Action | 13.2: Integrate climate change measures into policies and planning. |
– CO2 emissions per specific activity (e.g., 400g/mile for a gas car, 42g/hour for streaming). – Data showing a decrease in fossil-powered electricity generation. |
Source: hypergridbusiness.com
What is Your Reaction?
 Like
0
 Dislike
0
 Love
0
 Funny
0
 Angry
0
 Sad
0
Sad
0
 Wow
0
Wow
0


