


Türkiye’s top earners capture 48% of income as inequality edges lower – Türkiye Today
Report on Income Distribution and Inequality in Türkiye, 2025
Overview of Income Distribution and Inequality
According to data released by the Turkish Statistical Institute (TurkStat) on December 26, 2025, Türkiye’s wealthiest households continue to dominate the nation’s income distribution. However, a slight easing of income inequality was observed in 2025.
- The top 20% of earners by disposable household income captured 48% of total income, a decrease of 0.1 percentage points from 2024.
- The bottom 20% saw their income share rise by 0.1 percentage points to 6.4%.
- The Gini coefficient, a standard measure of income inequality, declined marginally to 0.410 from 0.413 in 2024.
These changes indicate a fractional improvement in income equality, although Türkiye remains among countries with significant income disparities.
Emphasis on Sustainable Development Goals (SDGs)
- SDG 10: Reduced Inequalities — The slight reduction in the Gini coefficient and the modest increase in income share for the bottom 20% align with efforts to reduce inequalities within the country.
- SDG 1: No Poverty — Improving income distribution contributes to poverty alleviation by increasing the economic capacity of lower-income households.
- SDG 8: Decent Work and Economic Growth — Monitoring income distribution supports sustainable economic growth and inclusive development.
Household Income Growth Amid High Inflation
Türkiye experienced a significant increase in average annual disposable household income in 2025, driven by ongoing high inflation rates:
- Average annual disposable household income rose by 76.7% to 662,414 Turkish lira.
- Per capita disposable income increased by 77.3%, from 187,728 lira to 332,882 lira.
- Single-person households recorded the highest average per capita income at 418,025 lira, an increase of 194,166 lira year-over-year.
- Households with at least one nuclear family plus additional members reported the lowest average income at 264,413 lira.
Despite nominal increases, persistent inflation has eroded purchasing power, making real improvements in living standards less apparent.
SDG Relevance
- SDG 8: Decent Work and Economic Growth — Income growth is essential for economic development, but inflation challenges highlight the need for sustainable economic policies.
- SDG 1: No Poverty — Addressing inflation is critical to ensure that income gains translate into improved living standards for all households.
Regional Disparities in Income
Geographic inequality remains a significant challenge across Türkiye:
- Ankara led with the highest average per capita disposable income of 449,618 lira.
- Istanbul and Izmir followed with 434,929 lira and 405,896 lira respectively.
- The Van, Mus, Bitlis, and Hakkari region in the southeast recorded the lowest average income at 172,552 lira, less than 40% of Ankara’s figure and about half the national average.
Inequality Ratios and Geographic Variation
- The P80/P20 ratio, comparing income shares of the top 20% to the bottom 20%, fell slightly to 7.5 from 7.7.
- The P90/P10 ratio, measuring the gap between the top and bottom 10%, decreased to 12.9 from 13.3.
- Regions with the lowest P80/P20 ratios (4.6) included Malatya, Elazig, Bingol, Tunceli, and Kocaeli, Sakarya, Duzce, Bolu, Yalova, indicating more balanced income distribution.
- The highest inequality was observed in Kirikkale, Aksaray, Nigde, Nevsehir, Kirsehir (P80/P20 ratio 8.5) and Antalya, Isparta, Burdur (8.3).
Excluding social transfers, the Gini coefficient rose to 0.473, highlighting the importance of government programs in reducing inequality. Including only retirement and survivor pensions, the coefficient was 0.420, while the gross income Gini coefficient was 0.422.
SDG Implications
- SDG 10: Reduced Inequalities — Persistent regional disparities emphasize the need for targeted policies to promote equitable economic development.
- SDG 1: No Poverty — Social transfers play a vital role in mitigating income inequality and supporting vulnerable populations.
- SDG 16: Peace, Justice and Strong Institutions — Effective government programs and social protection systems are essential to address inequality.
Conclusion
The 2025 data from TurkStat indicates a marginal improvement in income equality in Türkiye, with slight reductions in inequality measures and modest gains for lower-income households. However, significant challenges remain, particularly regarding regional disparities and the impact of inflation on real income. Continued focus on Sustainable Development Goals, especially SDG 1 (No Poverty), SDG 8 (Decent Work and Economic Growth), and SDG 10 (Reduced Inequalities), is critical to fostering inclusive and sustainable economic progress across the country.

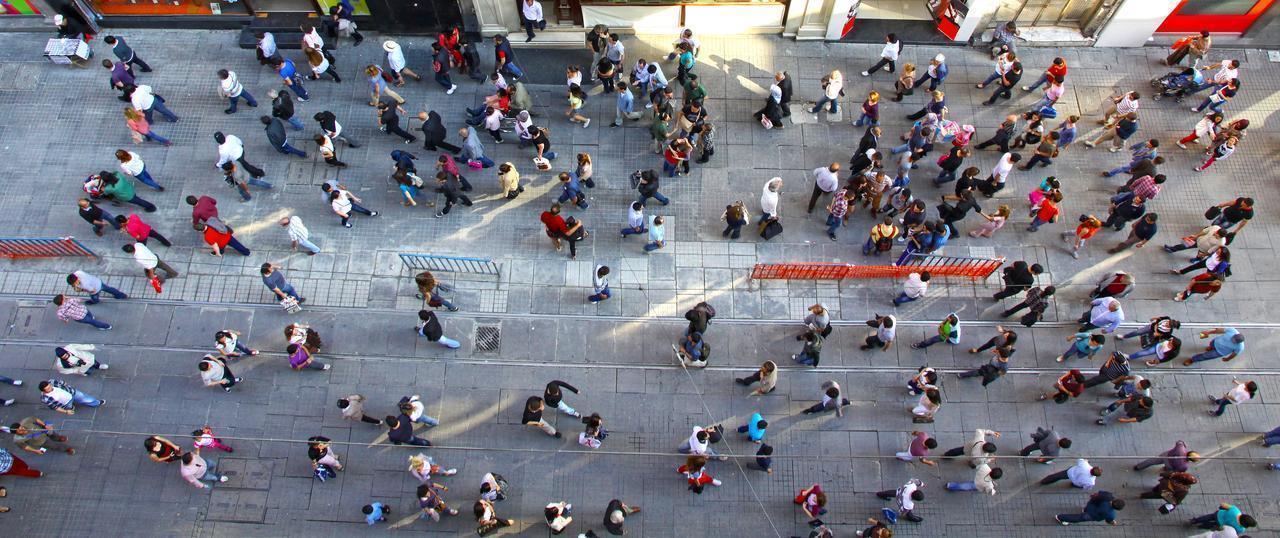
Pedestrians crowd Istiklal Street, one of Istanbul’s busiest thoroughfares in Türkiye, accessed on Dec. 22, 2025. (Adobe Stock Photo)
1. Sustainable Development Goals (SDGs) Addressed
- SDG 1: No Poverty – The article discusses income distribution and inequality, highlighting the share of income held by the poorest 20%, which relates directly to poverty reduction.
- SDG 10: Reduced Inequalities – The main focus of the article is on income inequality in Türkiye, including Gini coefficient changes and income ratios among different income groups and regions.
- SDG 8: Decent Work and Economic Growth – The article mentions disposable household income growth and inflation impacts, which relate to economic growth and income levels.
- SDG 11: Sustainable Cities and Communities – Regional disparities and urban income differences (e.g., Ankara, Istanbul) are discussed, which relate to sustainable urban development and reducing inequalities within cities.
2. Specific Targets Under Those SDGs
- SDG 1 – Target 1.2: By 2030, reduce at least by half the proportion of men, women and children living in poverty in all its dimensions according to national definitions. The article’s focus on income shares of the bottom 20% relates to this target.
- SDG 10 – Target 10.1: Achieve and sustain income growth of the bottom 40% of the population at a rate higher than the national average. The slight increase in income share for the bottom 20% and changes in inequality ratios relate to this target.
- SDG 8 – Target 8.1: Sustain per capita economic growth in accordance with national circumstances. The reported increases in disposable income and per capita income are relevant here.
- SDG 11 – Target 11.3: Enhance inclusive and sustainable urbanization and capacity for participatory, integrated and sustainable human settlement planning and management. The regional income disparities highlighted in the article relate to this target.
3. Indicators Mentioned or Implied to Measure Progress
- Gini Coefficient: Explicitly mentioned as a measure of income inequality, with values reported for 2024 and 2025, including variations when social transfers are excluded.
- Income Share Ratios (P80/P20 and P90/P10): These ratios compare income shares between the top and bottom income groups, showing inequality levels and changes over time.
- Disposable Household Income: Average annual disposable income and per capita income figures are given, indicating economic growth and income distribution.
- Regional Income Data: Average per capita disposable income by regions and statistical areas, showing geographic disparities.
4. Table of SDGs, Targets, and Indicators
| SDGs | Targets | Indicators |
|---|---|---|
| SDG 1: No Poverty | Target 1.2: Reduce proportion of people living in poverty | Income share of bottom 20% of population |
| SDG 10: Reduced Inequalities | Target 10.1: Income growth of bottom 40% higher than national average |
|
| SDG 8: Decent Work and Economic Growth | Target 8.1: Sustain per capita economic growth |
|
| SDG 11: Sustainable Cities and Communities | Target 11.3: Enhance inclusive and sustainable urbanization | Regional per capita disposable income disparities (e.g., Ankara 449,618 lira vs. Van region 172,552 lira) |
Source: turkiyetoday.com
What is Your Reaction?
 Like
0
Like
0
 Dislike
0
Dislike
0
 Love
0
Love
0
 Funny
0
Funny
0
 Angry
0
Angry
0
 Sad
0
Sad
0
 Wow
0
Wow
0