


Philadelphia’s new ‘Breathe Philly’ network tracks air quality across the city – StateScoop
Philadelphia Launches ‘Breathe Philly’ Network to Monitor Air Quality Citywide
Introduction
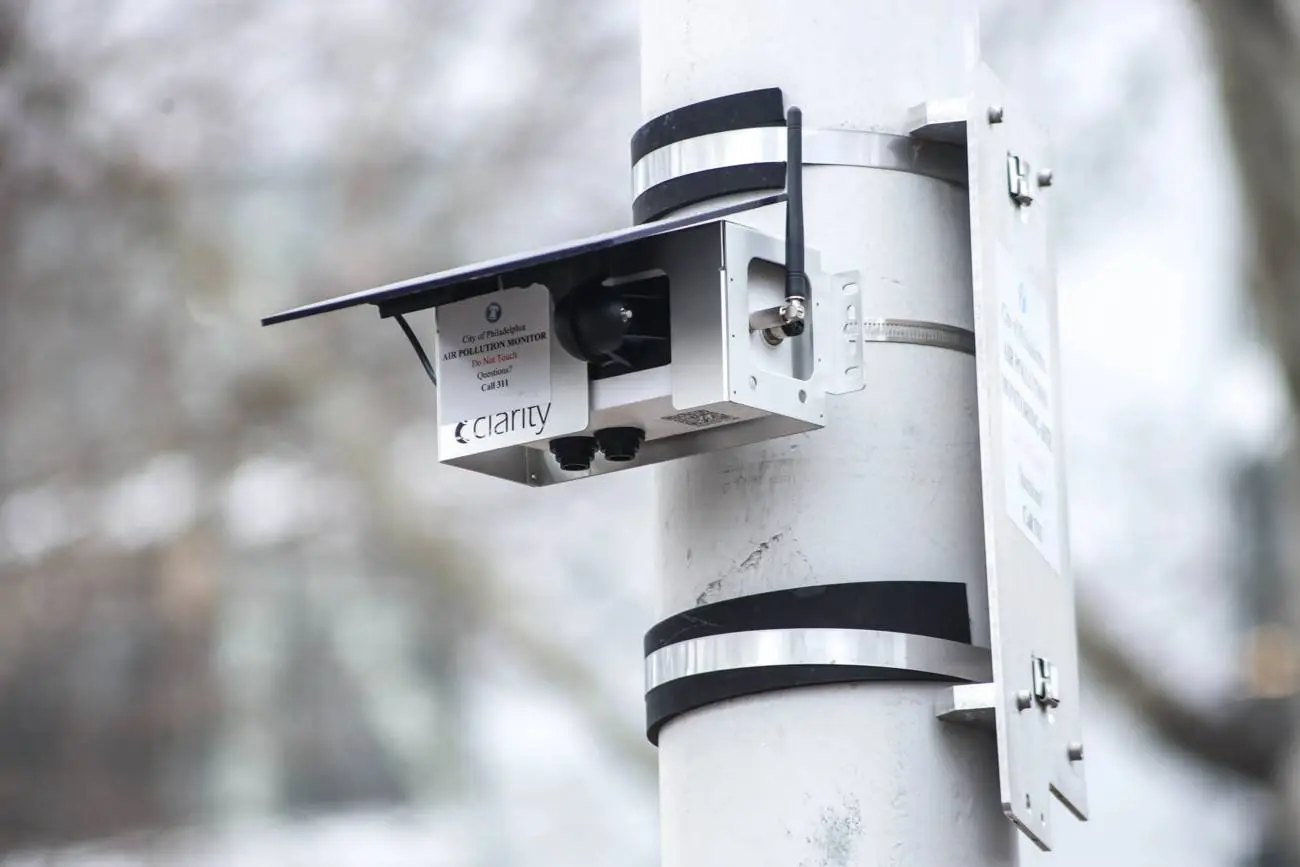
Philadelphia has introduced a new air-quality monitoring system named the “Breathe Philly” network, consisting of 76 ground-level sensors strategically placed across the city. This initiative aims to provide residents with real-time, neighborhood-specific air quality data, supporting public health and environmental sustainability aligned with the United Nations Sustainable Development Goals (SDGs), particularly SDG 3 (Good Health and Well-being) and SDG 11 (Sustainable Cities and Communities).
Network Features and Accessibility
- The sensors measure fine particulate matter and nitrogen dioxide, pollutants associated with asthma, respiratory illnesses, and cardiovascular diseases.
- Residents can access data through an online dashboard, which displays trends over time and allows users to sign up for alerts when air quality deteriorates.
- Every resident lives within 1.5 miles of a sensor, ensuring comprehensive coverage across neighborhoods.
Public Health and Economic Impact
- According to the Environmental Protection Agency, poor air quality causes approximately 100,000 premature deaths annually in the United States and results in an estimated $150 billion in health-related costs.
- Mayor Cherelle Parker emphasized that clean air is fundamental to public health and the city’s vision for a cleaner, greener Philadelphia, reinforcing SDG 3 and SDG 13 (Climate Action).
Existing Monitoring and Enhancements
The Philadelphia Department of Public Health previously operated a network of ten permanent air monitoring stations. However, these stations lacked real-time data capabilities and did not cover all neighborhoods adequately.
James Garrow, Deputy Health Commissioner, highlighted the importance of hyperlocal, real-time data to detect sudden changes caused by weather, wildfire smoke, or traffic patterns, which is crucial for timely public health responses.
Operational Benefits and Emergency Response
- The new sensor system has already demonstrated effectiveness by detecting an orange alert during a junkyard fire in the Gray’s Ferry neighborhood.
- Real-time data enables the health department to dispatch a mobile monitoring van equipped with toxic-air sensors to affected areas promptly.
- This rapid response capability supports SDG 3 by reducing exposure risks and enhancing community health protection.
Future Plans and Sustainability Goals
- The city plans to expand the network by adding sensors to measure ozone levels starting in the spring, facilitating the identification of long-term pollution trends.
- Data collected will inform future air quality regulations and urban planning, contributing to SDG 11 (Sustainable Cities and Communities) and SDG 13 (Climate Action).
- Continuous monitoring will help identify localized pollution sources and support targeted interventions to improve air quality.
Conclusion
Philadelphia’s ‘Breathe Philly’ network represents a significant advancement in environmental monitoring and public health protection. By providing accessible, real-time air quality data, the initiative aligns with multiple Sustainable Development Goals, promoting healthier communities and sustainable urban environments.
1. Sustainable Development Goals (SDGs) Addressed or Connected
- SDG 3: Good Health and Well-being
- The article discusses air quality monitoring to reduce respiratory illnesses, asthma, and cardiovascular diseases caused by air pollution.
- SDG 11: Sustainable Cities and Communities
- The initiative aims to improve urban air quality and provide real-time data to residents, contributing to sustainable urban living.
- SDG 13: Climate Action
- Monitoring pollutants such as nitrogen dioxide and particulate matter helps address climate-related health impacts and pollution management.
- SDG 9: Industry, Innovation and Infrastructure
- The deployment of a network of sensors and real-time data platforms reflects innovation and infrastructure development for environmental monitoring.
2. Specific Targets Under Those SDGs Identified
- SDG 3 – Target 3.9: Reduce the number of deaths and illnesses from hazardous chemicals and air, water, and soil pollution and contamination.
- The article highlights efforts to reduce health impacts from air pollution by monitoring fine particulate matter and nitrogen dioxide.
- SDG 11 – Target 11.6: Reduce the adverse per capita environmental impact of cities, including air quality.
- The “Breathe Philly” network aims to improve air quality awareness and management at the neighborhood level.
- SDG 13 – Target 13.3: Improve education, awareness-raising and human and institutional capacity on climate change mitigation, adaptation, impact reduction, and early warning.
- Providing real-time air quality data and alerts increases public awareness and supports timely responses to pollution events.
- SDG 9 – Target 9.5: Enhance scientific research and upgrade the technological capabilities of industrial sectors.
- The installation of 76 ground-level sensors and an online dashboard represents technological advancement in environmental monitoring.
3. Indicators Mentioned or Implied to Measure Progress
- Air Quality Index (AQI) Levels
- The article mentions the city’s air quality index being healthy on most days and the use of real-time data to detect pollution spikes (e.g., orange alert for junkyard fire).
- Concentration of Fine Particulate Matter (PM2.5) and Nitrogen Dioxide (NO2)
- The sensors measure these pollutants, which are linked to health issues, providing quantitative data to track pollution levels.
- Coverage and Accessibility of Monitoring Stations
- Indicator of how many residents live within a certain distance (1.5 miles) of a sensor, reflecting equitable access to air quality information.
- Number of Alerts Issued and Emergency Responses
- Use of alerts and deployment of mobile monitoring vans as indicators of responsiveness to air quality events.
- Trends Over Time in Pollutant Levels
- Long-term data collection to identify seasonal and yearly variations and inform policy decisions.
4. Table of SDGs, Targets, and Indicators
| SDGs | Targets | Indicators |
|---|---|---|
| SDG 3: Good Health and Well-being | Target 3.9: Reduce deaths and illnesses from hazardous chemicals and air pollution. |
|
| SDG 11: Sustainable Cities and Communities | Target 11.6: Reduce adverse environmental impact of cities including air quality. |
|
| SDG 13: Climate Action | Target 13.3: Improve awareness and capacity on climate change mitigation and early warning. |
|
| SDG 9: Industry, Innovation and Infrastructure | Target 9.5: Enhance scientific research and technological capabilities. |
|
Source: statescoop.com
What is Your Reaction?
 Like
0
Like
0
 Dislike
0
Dislike
0
 Love
0
Love
0
 Funny
0
Funny
0
 Angry
0
Angry
0
 Sad
0
Sad
0
 Wow
0
Wow
0