


Türkiye produced 120M tonnes of waste in 2024, including 42.2M tonnes of hazardous material – Türkiye Today
Report on Waste Generation and Management in Türkiye, 2024: An SDG Perspective
This report analyses the 2024 waste statistics for Türkiye, as released by the Turkish Statistical Institute (TurkStat). The findings are contextualized within the framework of the United Nations Sustainable Development Goals (SDGs), particularly those concerning responsible consumption, sustainable cities, and environmental protection.
National Waste Generation Profile
Overall Waste Statistics and Alignment with SDG 12
In 2024, Türkiye’s total waste generation reached 120 million tonnes. This figure underscores the significant challenge in achieving the objectives of SDG 12 (Responsible Consumption and Production), which calls for a substantial reduction in waste generation through prevention, reduction, recycling, and reuse.
- Total Waste Generated: 120 million tonnes
- Hazardous Waste Generated: 42.2 million tonnes
- Sources Surveyed:
- Manufacturing industry establishments
- Mining establishments
- Thermal power plants
- Organized Industrial Zones (OIZs)
- Households
Hazardous Waste Management and Public Health (SDG 3 & SDG 12)
The generation of 42.2 million tonnes of hazardous waste necessitates stringent management protocols to mitigate environmental and health risks. The use of licensed treatment processes is critical for supporting SDG 3.9 (substantially reduce deaths and illnesses from hazardous chemicals and pollution) and SDG 12.4 (achieve the environmentally sound management of chemicals and all wastes).
Sector-Specific Waste Analysis and SDG Implications
Manufacturing Industry: Progress in Circular Economy Practices (SDG 9 & SDG 12)
The manufacturing sector produced 24.4 million tonnes of waste, with a significant portion directed towards recovery and licensed treatment. This reflects progress in adopting circular economy principles, which is essential for SDG 9 (Industry, Innovation, and Infrastructure) and SDG 12.5 (Substantially reduce waste generation).
- Total Manufacturing Waste: 24.4 million tonnes
- Hazardous Manufacturing Waste: 4.2 million tonnes
- Waste Management Methods:
- Sold or sent to licensed treatment facilities: 70.1%
- Recovered within the facility or used as fill: 12.1%
- Sent to landfill: 10.8%
- Sent to incineration or co-incineration: 2.6%
- Collected by municipalities or OIZs: 2.4%
- Stored on-site: 1.8%
- Disposed of by other methods: 0.1%
Mining Sector: Managing Environmental Impact (SDG 15)
The mining sector is the largest contributor to waste by volume, primarily mineral waste. The management of this waste, especially overburden, is directly linked to the preservation of ecosystems as targeted by SDG 15 (Life on Land).
- Mining Waste (excluding overburden): 40.5 million tonnes
- Total Mining Waste (including overburden): 1.061 billion tonnes
- Disposal Methods:
- Disposed in overburden heaps or tailings dams: 85.1%
- Used for backfilling: 12.5%
- Recovered or disposed of by other methods: 2.4%
Thermal Power Plants: Waste from Energy Production (SDG 7)
Waste from thermal power plants, predominantly ash and slag, highlights the environmental trade-offs associated with energy production. Managing this waste stream is a key consideration in the pursuit of SDG 7 (Affordable and Clean Energy) while minimizing environmental harm.
- Total Waste Generated: 26.5 million tonnes
- Composition: 84.6% ash and slag, 15.4% other waste
- Disposal Methods: 86.9% sent to ash disposal areas or controlled landfills
Municipal Waste: A Key Indicator for Sustainable Cities (SDG 11 & SDG 6)
Municipal waste data provides a direct measure of progress towards SDG 11.6 (reduce the adverse per capita environmental impact of cities). The high percentage of waste sent to treatment facilities is a positive indicator, while the management of wastewater sludge is relevant to SDG 6 (Clean Water and Sanitation).
- Municipalities Providing Waste Services: 1,392 out of 1,401
- Total Municipal Waste Collected: 32.3 million tonnes
- Average Waste Per Capita Per Day: 1.09 kg
- Management of Collected Waste:
- Sent to waste treatment facilities: 88.9%
- Sent to municipal dumping sites: 10.9%
- Wastewater Treatment Sludge Generated: 353,000 tonnes (dry matter)
National Waste Treatment and Recovery Infrastructure
Overview of Disposal and Recovery Operations (SDG 12.5)
The national capacity for waste treatment reflects Türkiye’s efforts to move from a linear to a circular economy. The data shows a dual focus on both safe disposal and material recovery, which is central to achieving SDG 12.5.
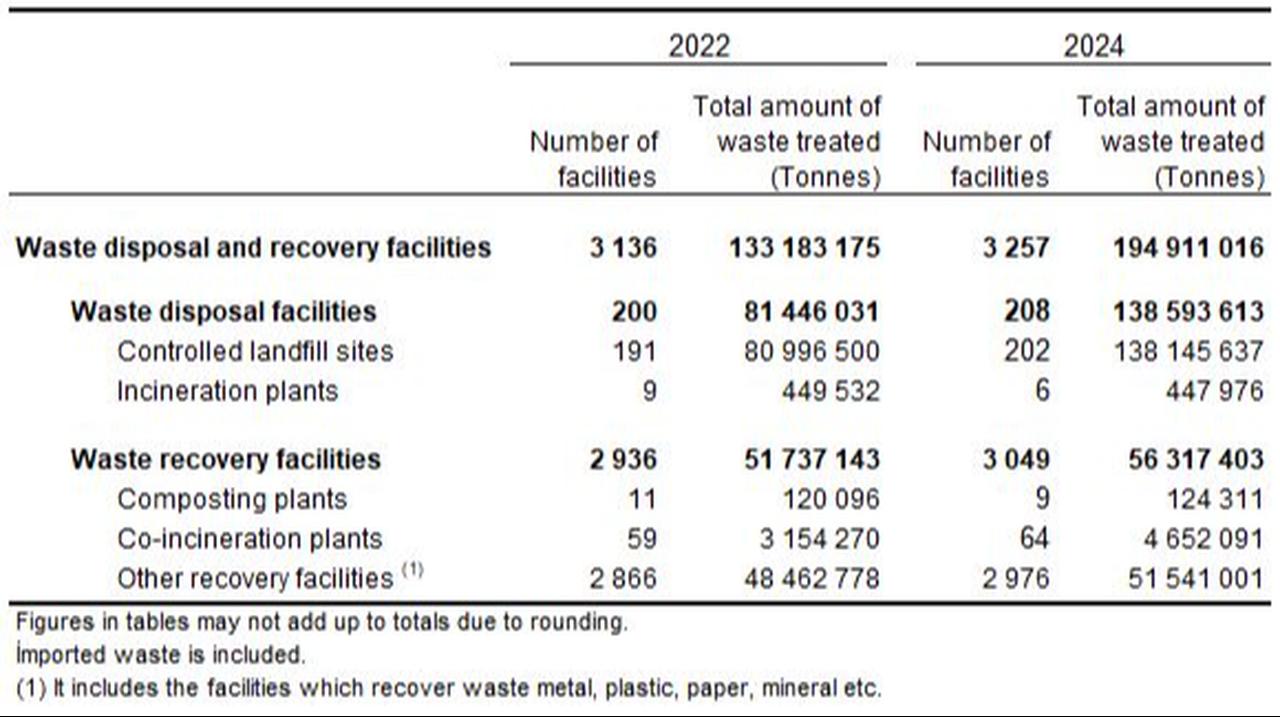
- Total Waste Treated: 195 million tonnes
- Disposed: 139 million tonnes (138 million tonnes in controlled landfills)
- Recovered: 56 million tonnes
Contribution to Circular Economy and Clean Energy (SDG 7 & SDG 8)
Recovery operations not only reduce the final volume of waste but also contribute to other SDGs. Waste-to-energy processes support SDG 7, while the broader recycling and recovery industry fosters economic growth and green jobs, aligning with SDG 8 (Decent Work and Economic Growth).
- Co-incineration with energy recovery: 4.7 million tonnes
- Composting: 124,000 tonnes
- Other licensed recovery (metal, plastic, paper, etc.): 51.5 million tonnes
SDG Analysis of Türkiye’s Waste Management Report
1. Which SDGs are addressed or connected to the issues highlighted in the article?
-
SDG 12: Responsible Consumption and Production
This is the most central SDG in the article. The entire text is dedicated to quantifying waste generation from various production sectors (manufacturing, mining, thermal power plants) and consumption (households). It details how this waste is managed, treated, recovered, and disposed of, directly addressing the principles of responsible resource management and waste reduction.
-
SDG 11: Sustainable Cities and Communities
The article specifically discusses municipal waste management. It states that 1,392 municipalities provided waste services, collected 32.3 million tonnes of waste, and managed its disposal in treatment facilities or dumping sites. The calculation of “1.09 kilograms per day” of municipal waste per person directly relates to the environmental impact of cities.
-
SDG 9: Industry, Innovation and Infrastructure
The report breaks down waste generation by industrial sectors, including manufacturing, mining, thermal power plants, and organized industrial zones (OIZs). The methods of waste treatment, such as sending waste to licensed facilities, on-site recovery, and co-incineration with energy recovery, reflect the current state of industrial processes and infrastructure for waste management.
-
SDG 3: Good Health and Well-being
The article highlights the significant amount of hazardous waste produced (42.2 million tonnes). It mentions that this waste is “treated under licensed processes due to its potential risks.” The proper management and treatment of hazardous waste are crucial for preventing soil and water contamination, thereby protecting human health from pollution-related illnesses.
2. What specific targets under those SDGs can be identified based on the article’s content?
-
Target 12.4: Environmentally sound management of chemicals and all wastes
This target aims to achieve the environmentally sound management of all wastes throughout their life cycle. The article directly addresses this by quantifying the total hazardous waste generated (42.2 million tonnes) and describing the management processes. For instance, it notes that 70.1% of manufacturing waste was “sent to licensed treatment facilities” and that hazardous waste from OIZs was sent to “waste treatment facilities,” indicating efforts towards sound management.
-
Target 12.5: Substantially reduce waste generation
This target focuses on reducing waste through prevention, reduction, recycling, and reuse. The article provides extensive data on waste recovery and recycling efforts. It states that of the 195 million tonnes of waste treated, “56 million tonnes were recovered.” It further details these recovery methods, including “co-incineration plants burned 4.7 million tonnes with energy recovery,” “composting reached 124,000 tonnes,” and other facilities recovering “51.5 million tonnes of materials such as metal, plastic, paper, and mineral waste.”
-
Target 11.6: Reduce the environmental impact of cities
This target calls for reducing the adverse per capita environmental impact of cities, with a special focus on municipal waste management. The article provides key data points for this target by reporting that municipalities collected “32.3 million tonnes of municipal waste” and that “88.9% went to waste treatment facilities.” It also calculates the average municipal waste collected per person as “1.09 kilograms per day.”
-
Target 3.9: Reduce illness and death from hazardous chemicals and pollution
This target is implicitly addressed. While the article does not mention health outcomes, its focus on the large-scale generation of hazardous waste (42.2 million tonnes) and its subsequent treatment in “licensed processes” is a direct measure to prevent the pollution and contamination that lead to illness and death. The management of this waste is a preventative action to achieve this target.
3. Are there any indicators mentioned or implied in the article that can be used to measure progress towards the identified targets?
-
Indicator 12.4.2: Hazardous waste generated per capita and proportion of hazardous waste treated
The article provides the total amount of hazardous waste generated (“42.2 million tonnes”). This figure, combined with Türkiye’s population data, can be used to calculate the hazardous waste generated per capita. The article also describes the treatment methods for waste from various sectors, including the hazardous components (e.g., 70.1% of manufacturing waste sent to licensed facilities), which allows for the measurement of the proportion of hazardous waste treated.
-
Indicator 12.5.1: National recycling rate, tons of material recycled
The article directly provides data for this indicator. It states that “56 million tonnes were recovered” out of the 195 million tonnes treated. It also breaks down the recovery methods, such as “composting reached 124,000 tonnes” and “other licensed recovery facilities recovered a combined 51.5 million tonnes.” These figures can be used to calculate a national recovery/recycling rate.
-
Indicator 11.6.1: Proportion of municipal solid waste collected and managed in controlled facilities
The article provides the necessary data to measure this indicator. It states that of the 32.3 million tonnes of municipal waste collected, “88.9% went to waste treatment facilities.” These facilities can be classified as “controlled facilities.” The remaining “10.9% to municipal dumping sites” represents waste not managed in controlled facilities. The article also provides a per capita generation rate (“1.09 kilograms per day”), which is a related metric.
4. Table of SDGs, Targets, and Indicators
| SDGs | Targets | Indicators |
|---|---|---|
| SDG 12: Responsible Consumption and Production | Target 12.4: Achieve the environmentally sound management of chemicals and all wastes throughout their life cycle. | Indicator 12.4.2: Total hazardous waste generated was 42.2 million tonnes. Data is provided on waste sent to licensed treatment facilities (e.g., 70.1% of manufacturing waste). |
| SDG 12: Responsible Consumption and Production | Target 12.5: By 2030, substantially reduce waste generation through prevention, reduction, recycling and reuse. | Indicator 12.5.1: A total of 56 million tonnes of waste was recovered. This includes 51.5 million tonnes from recovery facilities, 4.7 million tonnes from co-incineration with energy recovery, and 124,000 tonnes from composting. |
| SDG 11: Sustainable Cities and Communities | Target 11.6: By 2030, reduce the adverse per capita environmental impact of cities, including by paying special attention to air quality and municipal and other waste management. | Indicator 11.6.1: 88.9% of the 32.3 million tonnes of municipal waste was sent to waste treatment facilities (controlled facilities). The average municipal waste collected per person was 1.09 kg per day. |
| SDG 3: Good Health and Well-being | Target 3.9: By 2030, substantially reduce the number of deaths and illnesses from hazardous chemicals and air, water and soil pollution and contamination. | Implied Indicator: The management of 42.2 million tonnes of hazardous waste in “licensed processes” serves as a proxy indicator for efforts to prevent pollution and related health impacts. |
| SDG 9: Industry, Innovation and Infrastructure | Target 9.4: Upgrade infrastructure and retrofit industries to make them sustainable. | Implied Indicator: Data on waste treatment from industrial sectors (manufacturing, mining, thermal power plants) and the use of recovery facilities and co-incineration with energy recovery reflect the adoption of more environmentally sound industrial processes for waste management. |
Source: turkiyetoday.com
What is Your Reaction?
 Like
0
Like
0
 Dislike
0
Dislike
0
 Love
0
Love
0
 Funny
0
Funny
0
 Angry
0
Angry
0
 Sad
0
Sad
0
 Wow
0
Wow
0