


Human-induced climate change amplification on storm dynamics in Valencia’s 2024 catastrophic flash flood – Nature
Report on Human-Induced Climate Change Amplification of the 2024 Valencia Catastrophic Flash Flood
Introduction
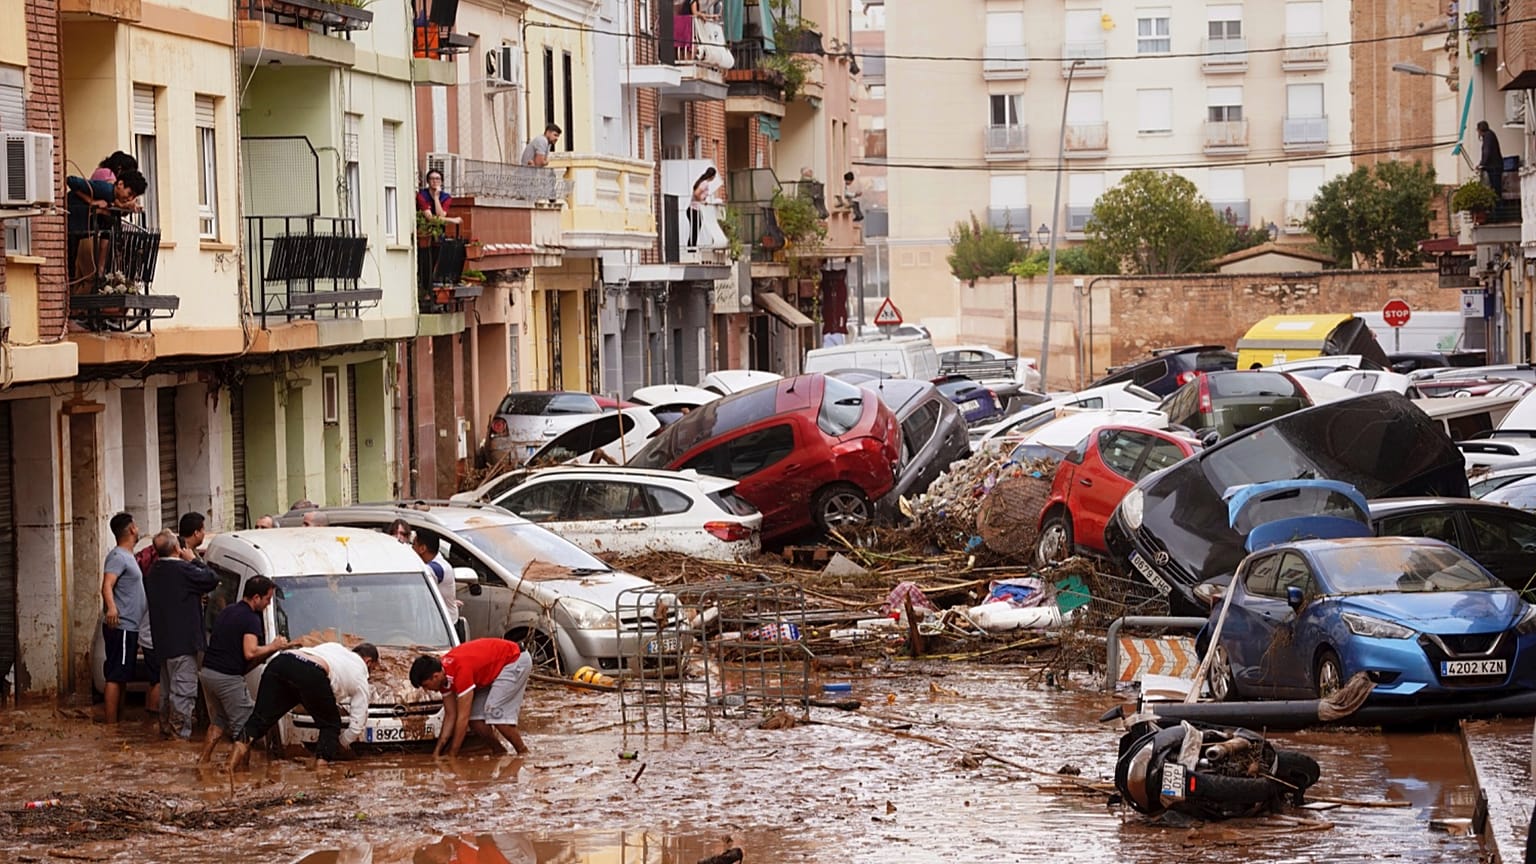
Global warming significantly impacts the hydrological cycle, leading to increased frequency and intensity of heavy rainfall events worldwide. In October 2024, Valencia, Spain, experienced unprecedented rainfall, with accumulations surpassing annual averages within hours and breaking national records for one-hour rainfall intensity. This event resulted in 230 fatalities and extensive socio-economic damages, underscoring the urgent need to understand the role of anthropogenic climate change (ACC) in such extreme weather phenomena.
This report employs a physical-based attribution study using a kilometer-scale pseudo-global warming (PGW) storyline approach to assess ACC’s contribution to the Valencia flash flood. The study integrates thermodynamic and dynamic atmospheric components to provide a comprehensive analysis of the event’s intensification under present-day climate conditions compared to pre-industrial climate scenarios.
Emphasis on Sustainable Development Goals (SDGs)
- SDG 13: Climate Action – The study highlights the critical impact of human-induced climate change on extreme weather events, emphasizing the necessity for urgent climate action to mitigate further risks.
- SDG 11: Sustainable Cities and Communities – Findings underscore the importance of improved urban planning and adaptation strategies to enhance resilience against hydrometeorological extremes.
- SDG 3: Good Health and Well-being – Addressing the increasing risks of flash floods is vital to protect human lives and reduce fatalities associated with climate-induced disasters.
Methodology
Data and Simulation Approach
- Utilized simulations from 15 CMIP6 Global Climate Models (GCMs) to derive climate perturbation signals representing the difference between pre-industrial (1850–1879) and present-day (2009–2038) climate conditions.
- Applied the Weather Research and Forecasting (WRF) model with 1-km horizontal grid spacing to simulate the extreme rainfall event under factual (present-day) and counterfactual (pre-industrial-like) climate scenarios.
- Implemented the Pseudo-Global Warming (PGW) storyline approach to modify initial and boundary conditions, focusing on thermodynamic variables such as air temperature and humidity, while maintaining large-scale circulation patterns.
- Validated simulations against extensive hourly precipitation observations from 256 weather stations in the Valencia region.
Assessment Metrics
- Rainfall intensity and spatial extent analysis using hourly and 6-hour accumulated precipitation data.
- Evaluation of atmospheric moisture content and fluxes, including precipitable water (PW) and water vapor flux (WVFlux).
- Investigation of physical mechanisms controlling extreme rainfall, such as convective available potential energy (CAPE), diabatic heating, updraft velocities, and cloud microphysics (graupel concentration).
- Statistical significance assessed via Mann–Whitney U test at 99% confidence level.
Results
Rainfall Intensity and Spatial Extent
- Present-day climate conditions led to a 20% per °C increase in 1-hour rainfall intensity, exceeding the Clausius-Clapeyron scaling of 7% per °C.
- The 6-hour rainfall rate intensified by 21%, with the area experiencing rainfall above 180 mm increasing by 55% compared to pre-industrial conditions.
- Total rainfall volume within the Jucar River catchment increased by 19%, indicating amplified hydrological impacts.
- Simulations demonstrated a larger and more intense precipitation core under present-day climate, with significant increases in extreme precipitation thresholds (90th, 95th, 99th percentiles).
Atmospheric Moisture Content and Fluxes
- Enhanced atmospheric moisture due to warmer sea surface temperatures increased precipitable water by approximately 12% and water vapor flux by 8.5% in the present-day climate.
- Increased moisture availability elevated Most Unstable Convective Available Potential Energy (MUCAPE) by 22%, promoting stronger convective instability.
- Stronger moisture transport processes fueled the convective storm, intensifying rainfall rates and spatial coverage.
Physical Mechanisms Driving Extreme Rainfall
- Anthropogenic climate change intensified latent heat release (diabatic heating) by nearly 30%, reinforcing atmospheric convection.
- Maximum updraft speeds increased by approximately 12%, indicating more vigorous vertical motions within convective storms.
- Cloud microphysics altered with a 32% increase in graupel concentration, contributing to enhanced precipitation efficiency and heavier rainfall.
- Warmer cloud layers facilitated warm rain processes, further increasing precipitation intensity and efficiency by 12.6%.
Discussion
The study confirms that anthropogenic climate change has substantially amplified the intensity and spatial extent of the October 2024 Valencia flash flood. Enhanced moisture content and atmospheric instability, driven by warmer sea surface temperatures, have intensified convective storm dynamics beyond traditional thermodynamic expectations. These findings align with global trends of increasing hydrometeorological extremes and highlight the urgent need for effective adaptation and mitigation strategies.
Implications for Sustainable Development Goals
- SDG 13: Climate Action
- Urgent implementation of climate mitigation policies is essential to limit further warming and reduce the frequency of extreme precipitation events.
- SDG 11: Sustainable Cities and Communities
- Improved urban planning and infrastructure resilience are critical to manage increased flash flood risks and protect communities.
- Development of early warning systems and emergency preparedness can reduce fatalities and economic losses.
- SDG 3: Good Health and Well-being
- Reducing exposure to climate-induced disasters supports public health and safety.
Conclusions
This attribution study demonstrates that human-induced climate change has significantly intensified the dynamics of the 2024 Valencia catastrophic flash flood by increasing atmospheric moisture, convective instability, and precipitation efficiency. The event exemplifies the growing risks posed by climate change to Mediterranean regions, necessitating accelerated climate adaptation and urban resilience efforts to safeguard lives and sustainable development.
Recommendations
- Integrate climate change projections into urban and regional planning to enhance flood risk management.
- Invest in climate-resilient infrastructure and nature-based solutions to mitigate flood impacts.
- Strengthen early warning systems and community awareness programs to improve disaster preparedness.
- Advance research on sub-daily scale precipitation processes to better predict and manage flash floods.
1. Sustainable Development Goals (SDGs) Addressed or Connected
- SDG 13: Climate Action
- The article focuses on the impact of anthropogenic climate change on extreme weather events, specifically the intensification of heavy rainfall and flash floods in Valencia, Spain.
- It highlights the urgent need for adaptation strategies and improved urban planning to mitigate risks associated with climate change-induced hydrometeorological extremes.
- SDG 11: Sustainable Cities and Communities
- The article discusses the devastating flash floods in an urban and metropolitan area (Valencia), emphasizing the need for urban resilience and planning to reduce disaster risks.
- SDG 6: Clean Water and Sanitation
- The study addresses hydrological impacts of extreme rainfall events, which affect water management and flood control.
- SDG 9: Industry, Innovation and Infrastructure
- There is an emphasis on the need for improved infrastructure and adaptation strategies to handle increased flood risks.
2. Specific Targets Under the Identified SDGs
- SDG 13: Climate Action
- Target 13.1: Strengthen resilience and adaptive capacity to climate-related hazards and natural disasters in all countries.
- Target 13.3: Improve education, awareness-raising and human and institutional capacity on climate change mitigation, adaptation, impact reduction, and early warning.
- SDG 11: Sustainable Cities and Communities
- Target 11.5: Significantly reduce the number of deaths and the number of people affected by disasters, including water-related disasters.
- Target 11.b: Increase the number of cities and human settlements adopting and implementing integrated policies and plans towards inclusion, resource efficiency, mitigation and adaptation to climate change.
- SDG 6: Clean Water and Sanitation
- Target 6.6: Protect and restore water-related ecosystems to reduce the impact of floods and droughts.
- SDG 9: Industry, Innovation and Infrastructure
- Target 9.1: Develop quality, reliable, sustainable and resilient infrastructure to support economic development and human well-being, with a focus on affordable and equitable access for all.
3. Indicators Mentioned or Implied to Measure Progress
- Rainfall Intensity and Frequency
- 1-hour and 6-hour rainfall intensity measurements (e.g., mm/hour, mm/6 hours) are used to quantify extreme precipitation events.
- Rainfall accumulation exceeding thresholds such as 180 mm (red warning threshold) and percentile-based thresholds (90th, 95th, 99th percentiles) are indicators of extreme rainfall events.
- Flood Impact Metrics
- Number of fatalities (230 fatalities in the Valencia event) and economic losses (billions of euros) as indicators of disaster impact.
- Spatial extent of rainfall and affected areas (percentage increase in area exceeding rainfall thresholds).
- Atmospheric and Hydrological Variables
- Most Unstable Convective Available Potential Energy (MUCAPE) as an indicator of atmospheric instability related to convective storms.
- Precipitable Water (PW) and Water Vapor Flux (WVFlux) as indicators of atmospheric moisture content and transport.
- Diabatic heating, updraft speed, graupel concentration, and precipitation efficiency as physical process indicators influencing rainfall intensity.
- Climate Change Attribution Metrics
- Percentage increase in rainfall intensity and area per degree Celsius warming (e.g., % increase per °C).
- Comparison of factual (present-day) vs. counterfactual (pre-industrial-like) climate simulations to attribute changes to anthropogenic climate change.
4. Table: SDGs, Targets and Indicators
| SDGs | Targets | Indicators |
|---|---|---|
| SDG 13: Climate Action |
|
|
| SDG 11: Sustainable Cities and Communities |
|
|
| SDG 6: Clean Water and Sanitation |
|
|
| SDG 9: Industry, Innovation and Infrastructure |
|
|
Source: nature.com
What is Your Reaction?
 Like
0
Like
0
 Dislike
0
Dislike
0
 Love
0
Love
0
 Funny
0
Funny
0
 Angry
0
Angry
0
 Sad
0
Sad
0
 Wow
0
Wow
0