


Europe Carbon Credit Market Size, Share & Analysis, 2033 – Market Data Forecast
Europe Carbon Credit Market: A Report on Growth, Dynamics, and Alignment with Sustainable Development Goals
Market Overview and Projections
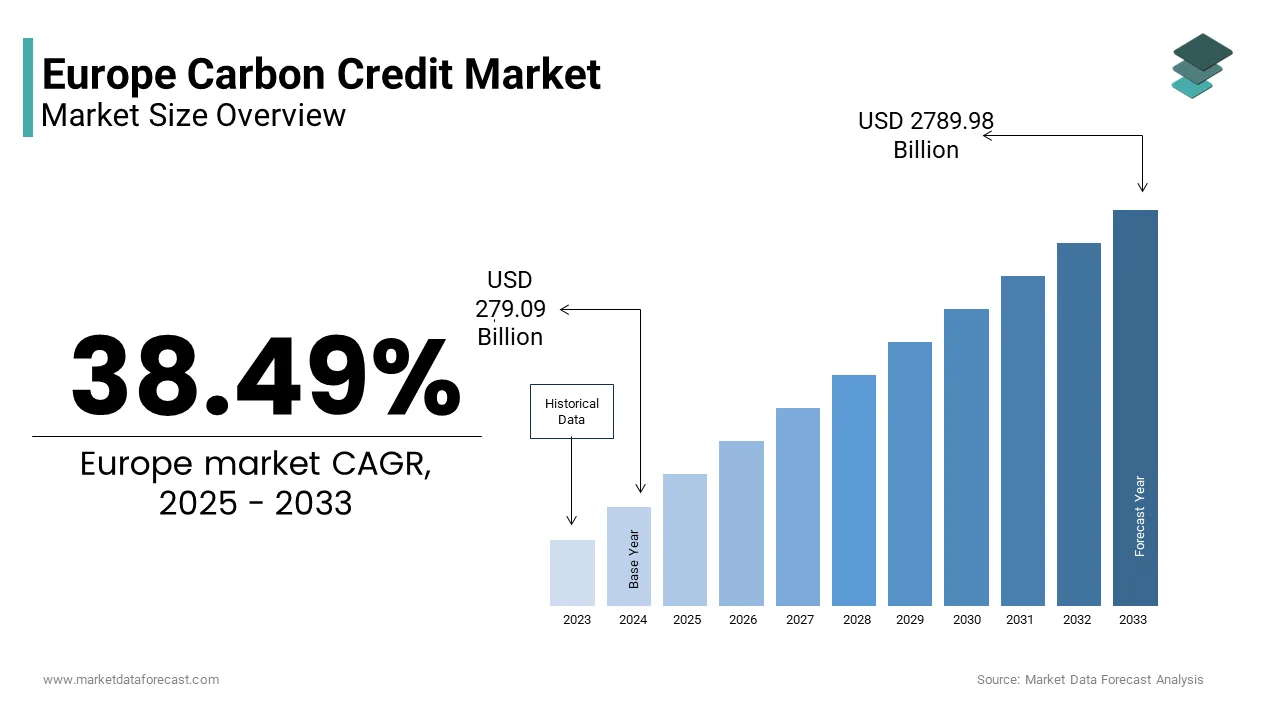
The Europe carbon credit market was valued at USD 201.49 billion in 2024. Projections indicate significant growth, with an anticipated value of USD 279.09 billion in 2025, escalating to USD 2,789.98 billion by 2033. This represents a compound annual growth rate (CAGR) of 38.49% during the 2025-2033 forecast period. This market is a critical instrument for achieving Sustainable Development Goal 13 (Climate Action) by placing a price on carbon emissions and incentivizing decarbonization across key economic sectors.
Established in 2005, the European Union Emissions Trading System (EU ETS) is the cornerstone of this market. It operates as a cap-and-trade mechanism, directly contributing to the EU’s climate targets. The system mandates over 10,000 installations in power generation and energy-intensive industries to surrender allowances for their emissions, fostering innovation in line with SDG 9 (Industry, Innovation, and Infrastructure). The “Fit for 55” package has further accelerated this transition by increasing the annual emissions reduction factor, reinforcing the EU’s commitment to net-zero emissions by 2050.
Market Dynamics and SDG Implications
Market Drivers
- Stringent EU Climate Legislation: Legally binding targets, particularly the mandated 62% emissions reduction in EU ETS sectors by 2030, are the primary driver. This regulatory pressure ensures sustained demand for carbon credits, directly advancing SDG 13 by enforcing emissions accountability.
- Corporate Net-Zero Commitments: A growing number of European corporations are adopting science-based net-zero targets. This voluntary action, which often involves purchasing high-integrity carbon credits to offset residual emissions, reflects a commitment to SDG 12 (Responsible Consumption and Production) and strengthens private sector engagement in climate solutions.
Market Restraints
- Price Volatility: Significant fluctuations in the price of EU Allowances (EUAs) create investment uncertainty. This volatility can deter long-term capital allocation for decarbonization projects, potentially slowing progress towards SDG 7 (Affordable and Clean Energy) and SDG 9.
- Limited Supply of High-Integrity Removal Credits: A scarcity of verified carbon dioxide removal (CDR) credits, such as those from direct air capture, constrains the market. This supply deficit poses a challenge to achieving credible net-zero targets and limits the scaling of innovative technologies essential for robust climate action under SDG 13.
Opportunities and Challenges in Achieving Climate Goals
Market Opportunities
- Integration of Carbon Contracts for Difference (CCfDs): CCfDs de-risk investments in breakthrough low-carbon technologies for hard-to-abate industries. By guaranteeing a fixed carbon price, these instruments improve project bankability, thereby accelerating the industrial innovation required for SDG 9.
- Expansion of CORSIA: The Carbon Offsetting and Reduction Scheme for International Aviation (CORSIA) is creating new demand for high-quality offsets. This drives investment in sustainable projects and aligns the aviation sector with global climate targets, supporting both SDG 13 and SDG 17 (Partnerships for the Goals) through international cooperation.
Market Challenges
- Risk of Double Counting: The use of internationally transferred mitigation outcomes under Article 6 of the Paris Agreement introduces the risk of double counting, where an emission reduction is claimed by both the host country and the purchasing entity. This undermines the environmental integrity of the market and threatens the credibility of progress towards SDG 13.
- Regulatory Fragmentation: A lack of harmonized rules between the compliance (EU ETS) and voluntary carbon markets creates inefficiencies, increases transaction costs, and impedes market liquidity. A unified regulatory approach is needed to scale the market effectively and ensure it can fully support Europe’s climate objectives.
Segmental Analysis
Analysis by Type
- Compliance Segment: This segment dominates the market, driven by the mandatory requirements of the EU ETS. Its structural importance is foundational to enforcing the policy actions needed to meet national and regional commitments under SDG 13.
- Voluntary Segment: Projected to witness the highest growth, this segment is fueled by corporate commitments to climate neutrality that go beyond regulatory obligations. It represents a powerful, market-based contribution to SDG 12 and SDG 13.
Analysis by Project
- Avoidance and Reduction Segment: Currently holding the largest market share, this segment includes mature and scalable projects like renewable energy deployment. These projects are crucial for the transition to clean energy, directly supporting SDG 7.
- Removal and Sequestration Segment: This segment is forecasted to grow most rapidly. Driven by the need for permanent carbon removal to achieve net-zero, it fosters investment in nature-based solutions and innovative technologies like direct air capture, aligning with SDG 9 and the long-term goals of SDG 13.
Regional Analysis
The market is led by nations with significant industrial bases and strong commitments to climate policy, reflecting varied approaches to achieving the Sustainable Development Goals.
- Germany: As the EU’s largest industrial economy, Germany’s market leadership is driven by its extensive participation in the EU ETS and its national *Energiewende* policy, which aligns industrial activity with SDG 7 and SDG 9.
- United Kingdom: The UK maintains a robust market through its independent emissions trading scheme and its status as a global financial hub for carbon trading, supporting its legally binding net-zero target.
- France: France’s market activity is shaped by its significant industrial sector and its pioneering role in international cooperation under Article 6, fostering partnerships for climate action (SDG 17).
- Sweden: A leader in industrial decarbonization and early adoption of carbon pricing, Sweden demonstrates how national policy can create strong domestic demand and drive innovation towards climate goals.
- Netherlands: With its dense industrial cluster and progressive policies supporting carbon capture, utilization, and storage (CCUS), the Netherlands is actively building the infrastructure needed for a low-carbon future (SDG 9).
Competitive Landscape
The competitive environment is characterized by a mix of energy majors, financial institutions, and specialized carbon developers. Success is increasingly dependent on the ability to provide high-integrity, verifiable credits that align with evolving EU sustainability standards. Key players are focusing on vertical integration, strategic partnerships, and digital platforms to enhance transparency and contribute effectively to global climate goals.
Key Market Players
- 3Degrees Group, Inc.
- Carbon Care Asia Ltd.
- Shell plc
- Total Energies SE
- BP plc
- CarbonBetter
- ClearSky Climate Solutions
- EKI Energy Services Ltd.
- Finite Carbon
- NativeEnergy
- South Pole Group
- Torrent Power Ltd.
- WGL Holdings Inc.
Strategic Imperatives
Leading companies are employing strategies that reinforce market integrity and advance sustainable development:
- Vertical Integration: Developing proprietary offset projects to ensure quality control and a stable supply of high-integrity credits.
- Strategic Partnerships: Collaborating with governments and technology firms to access emerging carbon removal methods and international mechanisms, fostering SDG 17.
- Digital Innovation: Investing in blockchain and other digital platforms for transparent verification and trading of credits, enhancing market infrastructure in line with SDG 9.
- Regulatory Alignment: Aligning credit portfolios with EU frameworks like the Corporate Sustainability Reporting Directive (CSRD) to meet the growing demand for credible, verifiable climate action.
Analysis of Sustainable Development Goals in the Europe Carbon Credit Market
1. Which SDGs are addressed or connected to the issues highlighted in the article?
-
SDG 13: Climate Action
- The entire article is centered on the carbon credit market, a primary mechanism for climate change mitigation. It discusses the EU Emissions Trading System (ETS), the “Fit for 55” package, and the European Climate Law, all of which are direct policy instruments to combat climate change and its impacts by reducing greenhouse gas emissions.
-
SDG 7: Affordable and Clean Energy
- The article mentions that renewable energy deployment, such as wind and solar projects, is a key source of avoidance-based carbon credits. It also references Germany’s “Energiewende” energy transition policy, which accelerates renewable deployment. This directly relates to increasing the share of renewable energy in the energy mix.
-
SDG 9: Industry, Innovation, and Infrastructure
- The text highlights the importance of industrial decarbonization, especially in hard-to-abate sectors. It discusses the development and financing of breakthrough low-carbon technologies like direct air capture, biochar, and carbon capture, supported by initiatives such as the EU Innovation Fund. This aligns with upgrading industries to make them more sustainable and promoting clean technologies.
-
SDG 12: Responsible Consumption and Production
- The article describes how corporate net-zero commitments and science-based targets are driving demand for carbon credits. This reflects a shift towards sustainable practices within companies, as they take responsibility for their emissions and integrate sustainability into their operational and reporting cycles to neutralize their carbon footprint.
-
SDG 17: Partnerships for the Goals
- The functioning of the carbon market relies on multi-stakeholder partnerships. The article mentions international cooperation under Article 6 of the Paris Agreement, the Carbon Offsetting and Reduction Scheme for International Aviation (CORSIA), and the EU ETS itself, which covers 30 countries. These examples illustrate partnerships between governments, international bodies, and the private sector to achieve climate goals.
2. What specific targets under those SDGs can be identified based on the article’s content?
-
Target 13.2: Integrate climate change measures into national policies, strategies and planning.
- The article extensively details the integration of climate measures into policy at a regional and national level. Examples include the EU’s legally binding climate targets, the “Fit for 55” legislative package which mandates a 62% emissions reduction by 2030, the European Climate Law aiming for net-zero by 2050, and the UK’s independent emissions trading framework.
-
Target 7.2: By 2030, increase substantially the share of renewable energy in the global energy mix.
- The article identifies renewable energy projects (wind and solar) as a mature and scalable source of avoidance/reduction credits. It notes that “wind and solar capacity in the EU grew, generating millions of verifiable emission reductions,” which directly supports the goal of increasing the share of renewable energy.
-
Target 9.4: By 2030, upgrade infrastructure and retrofit industries to make them sustainable…and greater adoption of clean and environmentally sound technologies.
- The article discusses the need for industrial decarbonization and the adoption of clean technologies. It mentions “breakthrough low-carbon technologies in hard-to-abate sectors,” “green steel initiatives” in Sweden, and the development of carbon removal technologies like “direct air capture or biochar,” all of which contribute to retrofitting industries for sustainability.
-
Target 12.6: Encourage companies, especially large and transnational companies, to adopt sustainable practices and to integrate sustainability information into their reporting cycle.
- The article highlights a “surge in corporate climate pledges,” with “over 250 major European companies” committing to science-based net-zero targets. This trend compels companies to adopt sustainable practices by reducing their own emissions and offsetting residual ones, thereby integrating climate action into their corporate strategy.
-
Target 17.17: Encourage and promote effective public, public-private and civil society partnerships.
- The carbon market ecosystem described is a prime example of such partnerships. It involves public entities (the European Commission setting rules), private companies (emitters, project developers like Shell and BP), and civil society organizations (standard-setting bodies like the Science Based Targets initiative, Verra, and the Gold Standard) working together.
3. Are there any indicators mentioned or implied in the article that can be used to measure progress towards the identified targets?
-
Indicators for SDG 13 (Climate Action)
- Quantitative Target for Emissions Reduction: The EU’s mandate for a “62 percent reduction in emissions from EU ETS sectors by 2030 compared to 2005 levels.”
- Rate of Emissions Cap Reduction: The annual cap on emissions will decrease at a rate of “4.3 percent for the period 2024–2027.”
- Total Regulated Emissions: In 2022, “the EU ETS covered installations emitted 1,362 million metric tons of carbon dioxide equivalent.”
-
Indicators for SDG 9 (Industry, Innovation, and Infrastructure)
- Investment in Clean Technology: “Funding for carbon dioxide removal technologies in Europe surged to 1.2 billion euros in 2023, up from just 200 million euros in 2020.”
- Capacity of New Technologies: “Total commercial carbon capture capacity stood at over 50 megatons in 2023,” and operational direct air capture facilities in Iceland have a “collective annual removal capacity exceeding 0.04 megatons.”
-
Indicators for SDG 12 (Responsible Consumption and Production)
- Corporate Commitment to Climate Action: “Over 250 major European companies have committed to science-based net-zero targets aligned with the Paris Agreement as of early 2024.”
-
Indicators for SDG 7 (Affordable and Clean Energy)
- Growth in Renewable Energy Capacity: The article implies a measurable indicator by stating that “wind and solar capacity in the EU grew, generating millions of verifiable emission reductions.”
4. Summary Table of SDGs, Targets, and Indicators
| SDGs | Targets | Indicators Identified in the Article |
|---|---|---|
| SDG 13: Climate Action | 13.2: Integrate climate change measures into national policies, strategies and planning. |
|
| SDG 7: Affordable and Clean Energy | 7.2: Increase substantially the share of renewable energy in the global energy mix. |
|
| SDG 9: Industry, Innovation, and Infrastructure | 9.4: Upgrade infrastructure and retrofit industries to make them sustainable… and greater adoption of clean and environmentally sound technologies. |
|
| SDG 12: Responsible Consumption and Production | 12.6: Encourage companies… to adopt sustainable practices and to integrate sustainability information into their reporting cycle. |
|
| SDG 17: Partnerships for the Goals | 17.17: Encourage and promote effective public, public-private and civil society partnerships. |
|
Source: marketdataforecast.com
What is Your Reaction?
 Like
0
Like
0
 Dislike
0
Dislike
0
 Love
0
Love
0
 Funny
0
Funny
0
 Angry
0
Angry
0
 Sad
0
Sad
0
 Wow
0
Wow
0