


Volatile Biofuels Demand is Reshaping the Price Relationship between Soybean and Palm Oils – farmdoc daily
Report on the Changing Price Dynamics of Soybean Oil and Palm Oil with Emphasis on Sustainable Development Goals (SDGs)
Article authored by Yu-Chi Wang, M.S. student at University of Illinois Agricultural and Consumer Economics, edited by Joe Janzen.
Introduction
Soybean oil and palm oil are the two most widely available vegetable oils globally, serving as substitutes in various products including biofuel feedstocks. Historically, their prices moved closely together, but since 2020, this co-movement has weakened, with prices diverging more frequently and for longer durations. This shift indicates a change in the nature of supply and demand shocks affecting these markets, moving from global to more regional or national influences. This report documents these changes, explores their causes, and discusses implications for future price dynamics and biofuel policies, highlighting their relevance to the Sustainable Development Goals (SDGs), particularly SDG 2 (Zero Hunger), SDG 7 (Affordable and Clean Energy), SDG 12 (Responsible Consumption and Production), and SDG 13 (Climate Action).
Overview of Global Vegetable Oil Production
Production Trends and Global Supply
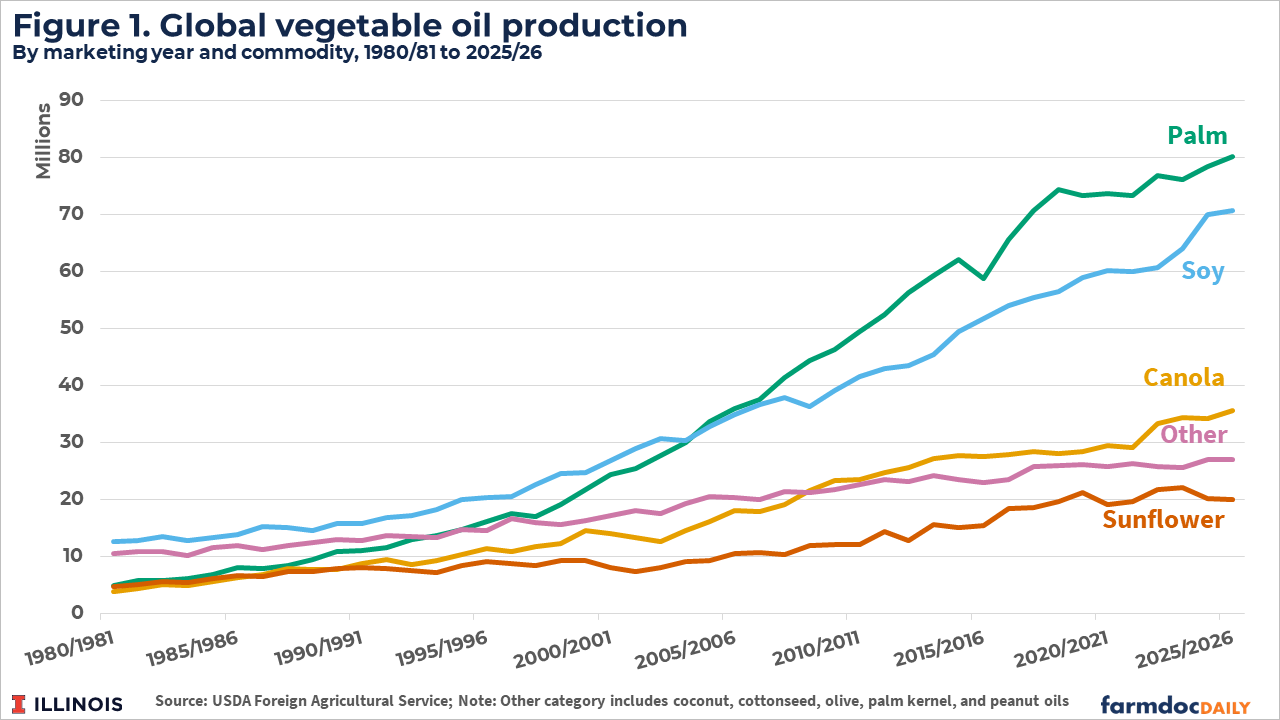
Soybean oil and palm oil have dominated global vegetable oil production since the 1980s. Palm oil production surpassed other oils like canola and sunflower in the early 2000s and has since grown significantly.

- Soybean oil and palm oil together account for over 60% of global edible oil supply.
- Other oils such as canola and sunflower play supporting roles in meeting global demand.
Geographical and Production System Differences
Key differences exist between soybean and palm oil production:
- Palm Oil: Concentrated mainly in Indonesia and Malaysia, with clustered refining and trade infrastructure.
- Soybean Oil: Produced in large agricultural exporters like the U.S., Brazil, and Argentina, with major importers including China.
Domestic biofuel mandates in these regions incentivize the use of locally produced oils, influencing demand dynamics and contributing to regional price variations.
Historical Price Relationships
Price Co-Movement Before 2020
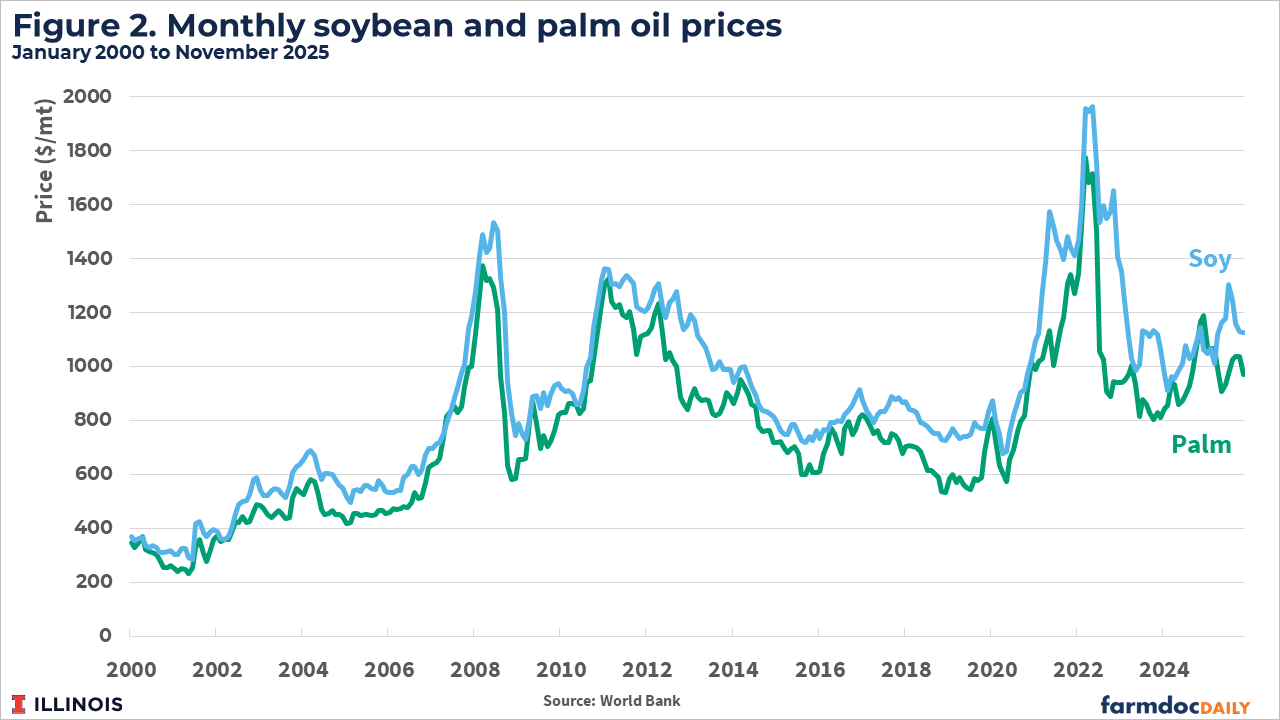
From 2000 to 2020, soybean and palm oil prices generally moved in tandem, reflecting their substitutability and relatively low trade costs. Both oils experienced similar price spikes and trends, maintaining a stable price ratio.
Price Divergence Since 2020
Post-2020, the price relationship has changed markedly:
- Prices diverge more frequently and for longer periods.
- Instances where prices move in opposite directions have been observed.
- In late 2024, palm oil futures exceeded soybean oil prices for the first time since the 1990s.
Detailed Daily Price Analysis (2020-2025)
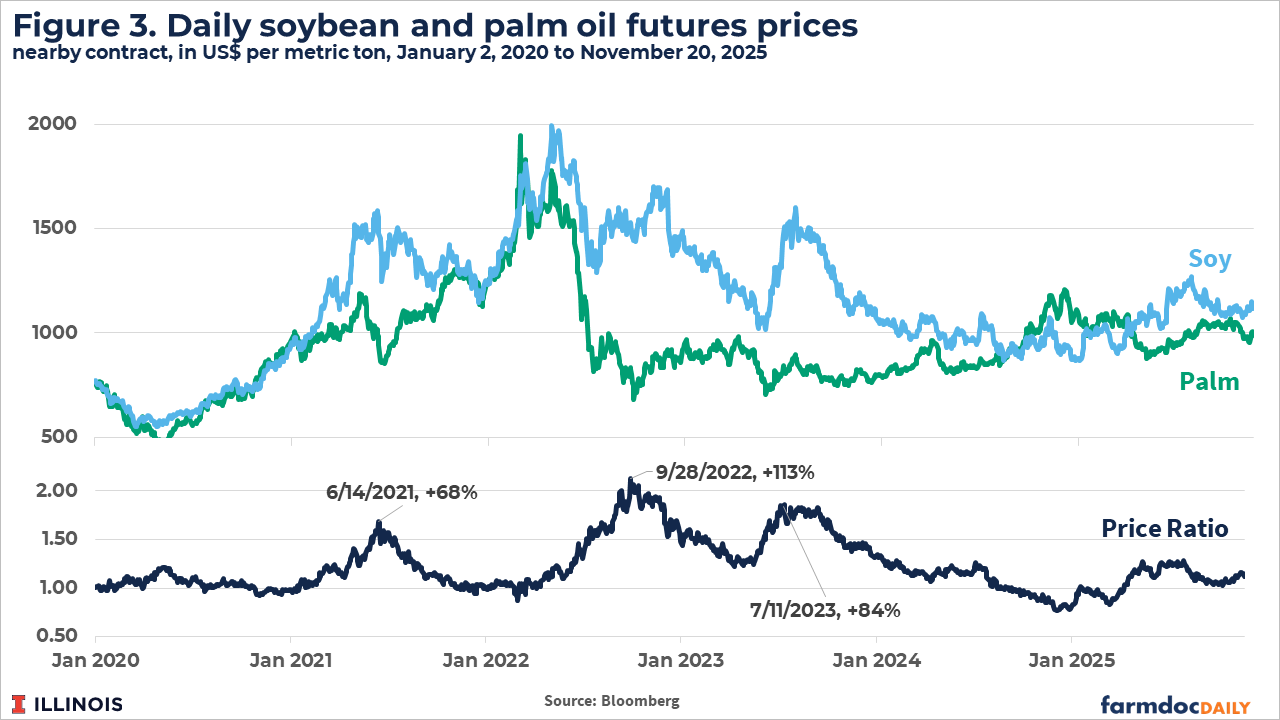
Daily futures data reveal increased volatility and sharper divergences in price ratios, reflecting complex interactions of global and regional factors.
Factors Behind the Breakdown of Price Relationship
Key Episodes of Price Divergence
-
2021 Divergence:
- Sharp rise in soybean oil prices due to increased U.S. renewable diesel capacity and production.
- Biofuel policies such as the Renewable Fuel Standard and California’s Low Carbon Fuel Standard intensified domestic demand for soybean oil.
- This reflects SDG 7 by promoting clean energy through biofuels.
-
Late 2021 Palm Oil Price Increase:
- Adverse weather (La Niña) and labor shortages in Malaysia reduced palm oil production.
- Palm oil prices reached record levels, narrowing the soybean oil premium.
- This episode highlights climate-related risks aligning with SDG 13 (Climate Action).
-
2022 Divergence:
- Record price highs due to tight supplies from the Russia-Ukraine war and Indonesia’s palm oil export ban.
- After lifting the ban, palm oil prices fell sharply; soybean oil prices declined more gradually.
- EPA’s lower-than-expected biofuel mandates reduced soybean oil demand, impacting prices.
- This scenario underscores the role of policy in sustainable production (SDG 12).
-
2023-2024 Divergence:
- Concerns over U.S. drought conditions raised soybean oil prices temporarily.
- Excess biomass-based diesel Renewable Identification Numbers (RINs) led to decreased soybean oil prices.
- Highlights the importance of sustainable agricultural practices and market mechanisms supporting SDG 2 (Zero Hunger) and SDG 12.
Discussion and Implications
Shift in Market Dynamics
The traditional global vegetable oil market signal has fragmented due to:
- Increased regional and policy-specific shocks.
- Reduced influence of palm oil on global prices due to production limits and domestic consumption in Southeast Asia.
- Greater exposure of U.S. soybean oil prices to domestic biofuel policies.
Implications for Sustainable Development Goals
- SDG 2 (Zero Hunger): Stable and predictable vegetable oil markets are crucial for food security.
- SDG 7 (Affordable and Clean Energy): Biofuel policies significantly impact soybean oil demand and prices, promoting renewable energy.
- SDG 12 (Responsible Consumption and Production): Policy decisions and market mechanisms influence sustainable production and consumption patterns.
- SDG 13 (Climate Action): Weather-related disruptions and climate risks affect production and prices, emphasizing the need for climate resilience.
Recommendations for Stakeholders
- Farmers, crushers, renewable fuel producers, and policymakers should monitor both global and regional market signals.
- Track not only global demand and stocks but also domestic biofuel policies, export regulations in producing countries, and weather conditions.
- Develop risk management strategies that account for increased price volatility and regional shocks.
- Support policies that align biofuel production with sustainable agricultural practices and climate resilience.
Conclusion
The evolving price dynamics between soybean oil and palm oil reflect a complex interplay of global and regional factors, with significant implications for sustainable development. Understanding these changes is essential for advancing the Sustainable Development Goals related to food security, clean energy, responsible consumption, and climate action. Stakeholders must adapt to this new environment by integrating diverse market signals and policy developments into their decision-making processes.
1. Sustainable Development Goals (SDGs) Addressed or Connected
- SDG 2: Zero Hunger
- The article discusses global vegetable oil production, which is a key component of food security and nutrition.
- It highlights the importance of soybean oil and palm oil in meeting global edible oil demand.
- SDG 7: Affordable and Clean Energy
- Biofuels production using soybean oil and palm oil as feedstocks is a central theme.
- The article discusses renewable diesel capacity and biofuel mandates, linking to clean energy goals.
- SDG 12: Responsible Consumption and Production
- Focus on biofuel policies, renewable fuel standards, and sustainable production practices.
- Discussion of supply and demand shocks and their regional impacts encourages sustainable management of resources.
- SDG 13: Climate Action
- References to weather disruptions, droughts, and climate-related risks affecting crop yields.
- Biofuel policies aimed at reducing carbon emissions are mentioned.
- SDG 15: Life on Land
- Mentions land limits in Southeast Asia affecting palm oil plantation expansion.
- Implications for sustainable land use and ecosystem conservation.
2. Specific Targets Under Identified SDGs
- SDG 2: Zero Hunger
- Target 2.3: By 2030, double the agricultural productivity and incomes of small-scale food producers.
- Target 2.4: Ensure sustainable food production systems and implement resilient agricultural practices.
- SDG 7: Affordable and Clean Energy
- Target 7.2: Increase substantially the share of renewable energy in the global energy mix.
- Target 7.a: Enhance international cooperation to facilitate access to clean energy research and technology.
- SDG 12: Responsible Consumption and Production
- Target 12.2: Achieve sustainable management and efficient use of natural resources.
- Target 12.4: Achieve environmentally sound management of chemicals and wastes.
- Target 12.5: Substantially reduce waste generation through prevention, reduction, recycling, and reuse.
- SDG 13: Climate Action
- Target 13.1: Strengthen resilience and adaptive capacity to climate-related hazards and natural disasters.
- Target 13.2: Integrate climate change measures into national policies, strategies, and planning.
- SDG 15: Life on Land
- Target 15.1: Ensure the conservation, restoration, and sustainable use of terrestrial ecosystems.
- Target 15.3: Combat desertification and restore degraded land and soil.
3. Indicators Mentioned or Implied to Measure Progress
- Production Volumes and Market Prices
- Monthly and daily prices of soybean oil and palm oil as indicators of market dynamics and supply-demand balance.
- Production volumes of vegetable oils (e.g., millions of metric tons) to track supply trends.
- Biofuel Production and Policy Indicators
- Renewable diesel capacity and production levels in the U.S. as measures of clean energy adoption.
- Biofuel mandates and blending volume obligations as policy targets influencing demand.
- Generation of Renewable Identification Numbers (RINs) as compliance and market indicators.
- Environmental and Climate Indicators
- Weather and drought conditions affecting soybean crop yields, measured by crop condition ratings and drought classifications.
- Land use changes and plantation age structure in palm oil production regions.
- Trade and Export Data
- Palm oil export bans and resumption impacting supply and prices.
- Stocks and year-end inventory levels as indicators of market tightness or surplus.
4. Table of SDGs, Targets, and Indicators
| SDGs | Targets | Indicators |
|---|---|---|
| SDG 2: Zero Hunger |
|
|
| SDG 7: Affordable and Clean Energy |
|
|
| SDG 12: Responsible Consumption and Production |
|
|
| SDG 13: Climate Action |
|
|
| SDG 15: Life on Land |
|
|
Source: farmdocdaily.illinois.edu
What is Your Reaction?
 Like
0
Like
0
 Dislike
0
Dislike
0
 Love
0
Love
0
 Funny
0
Funny
0
 Angry
0
Angry
0
 Sad
0
Sad
0
 Wow
0
Wow
0