


Minute-scale convective dust events are overlooked in urban air quality monitoring – Nature

Report on the Impact of Convective Dust Events on Urban Air Quality and Sustainable Development Goals
Executive Summary
Convective dust events represent a significant, yet poorly understood, threat to urban environments. Traditional air quality monitoring, which relies on sparse, hourly measurements, fails to capture the high-intensity, short-duration nature of these events. This leads to a substantial underestimation of public health risks and hinders progress toward key Sustainable Development Goals (SDGs). This report analyzes the impact of convective dust events, using case studies from Lubbock, Texas, and Phoenix, Arizona, to highlight critical gaps in current monitoring strategies. It concludes that achieving SDG 3 (Good Health and Well-being) and SDG 11 (Sustainable Cities and Communities) requires a paradigm shift towards high-resolution monitoring, such as dense networks of low-cost sensors, to accurately assess and mitigate the true impacts of these hazardous events.
1. Introduction: Convective Dust Events in the Context of Sustainable Development
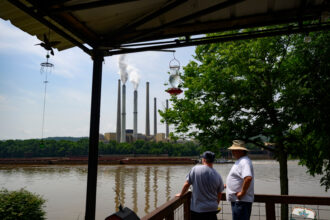
Convective dust events, often manifesting as haboobs, are localized, short-duration meteorological phenomena that lift large quantities of dust particles into the atmosphere. While common in arid and semi-arid regions, their impact on urban air quality is systematically overlooked. This oversight has direct implications for several SDGs:
- SDG 3 (Good Health and Well-being): Acute exposure to high concentrations of particulate matter (PM) during these events poses severe health risks, including respiratory conditions like “haboob lung syndrome,” which are not reflected in daily average air quality data.
- SDG 11 (Sustainable Cities and Communities): These events degrade urban air quality (Target 11.6), create safety hazards that reduce urban resilience (e.g., traffic fatalities from low visibility), and disproportionately affect vulnerable communities.
- SDG 13 (Climate Action): As climate-related phenomena, understanding and predicting these events is crucial for climate modeling and developing effective adaptation strategies, including public warning systems.
2. Monitoring Deficiencies and Their Consequences for SDG Attainment
2.1. Temporal and Spatial Limitations of Current Monitoring
The primary challenge in assessing the impact of convective dust events stems from inadequate monitoring infrastructure, which undermines efforts to create sustainable and healthy urban environments (SDG 11, SDG 9).
- Temporal Gaps: Regulatory sensors typically provide hourly or daily PM averages. Convective events, often lasting less than an hour, cause extreme spikes in PM concentrations that are “averaged out” and masked by these long timeframes.
- Spatial Gaps: Many urban areas have only one or a few reference sensors. As these dust events can be highly localized, they may impact specific neighborhoods while being completely missed by the existing monitoring network. This lack of granular data prevents targeted interventions to protect communities, a key aspect of building inclusive and sustainable cities (SDG 11).
2.2. Underestimation of Health Risks (SDG 3)
Current air quality guidelines from the WHO and EPA are based on chronic exposure to anthropogenic pollution, not acute exposure to high-concentration natural dust. Studies show that short-term exposure to high PM levels is linked to adverse health outcomes. By relying on daily averages that often fall below regulatory thresholds, the true health burden of convective dust events is dangerously underestimated, impeding progress on ensuring healthy lives for all.
3. Case Study Analysis: Evidence from U.S. Cities
3.1. Lubbock, Texas
In Lubbock, an urban center surrounded by agricultural land, convective dust events are frequent. Analysis reveals a critical disconnect between perceived air quality and reality:
- Despite severe dust storms with near-zero visibility, daily PM2.5 averages often remain below the EPA’s recommended threshold.
- During the October 17, 2011, haboob, the daily PM2.5 average was 23.5 µg m⁻³, while the peak hourly concentration reached 167 µg m⁻³.
- Measurements show that 10-minute average concentrations can be 24–47 times higher than daily concentrations, exposing a significant data gap that directly impacts the ability to protect public health (SDG 3).
3.2. Phoenix, Arizona
Phoenix, a large metropolitan area, provides a clear example of both the intensity and spatial variability of these events, highlighting challenges for urban resilience (SDG 11).
- On July 8, 2018, a convective event produced a daily PM10 average of 385 µg m⁻³, but the peak 10-minute concentration reached an extreme 8,129 µg m⁻³—over 20 times the daily value.
- Data from multiple sensors across the city show that some events impact only a few neighborhoods, while others sweep across the entire urban area. This spatial heterogeneity demonstrates that without a dense monitoring network, public health alerts and mitigation efforts cannot be effectively targeted.
- Even when daily PM10 values did not exceed EPA thresholds, short-duration concentrations were found to be dangerously high, reinforcing that current monitoring methods are inadequate for protecting urban populations.
4. Recommendations for a Sustainable and Resilient Future
Addressing the challenges posed by convective dust events requires a multi-faceted approach rooted in innovation, infrastructure development, and policy reform to advance the SDGs.
4.1. Enhance Monitoring Infrastructure and Innovation (SDG 9 & SDG 11)
The most critical step is to overcome existing temporal and spatial monitoring limitations. This involves:
- Deploying dense networks of calibrated, low-cost sensors across urban areas to capture the localized nature of dust events.
- Mandating high-frequency data reporting (e.g., 5- or 10-minute intervals) to record peak PM concentrations accurately.
- Investing in sensor technology capable of detecting coarse dust particles and operating effectively during high-concentration events.
This approach builds resilient infrastructure (SDG 9) and provides the data necessary for cities to manage air quality and protect citizens (SDG 11).
4.2. Improve Modeling, Prediction, and Climate Action (SDG 13)
Current models struggle to simulate and predict convective dust events. High-resolution data from dense sensor networks can be used to improve these models. Better prediction is essential for:
- Developing reliable early warning systems to alert the public, a key climate adaptation measure.
- Quantifying the risk to public health and safety, allowing for better mitigation planning.
- Understanding how these events may change in the future due to climate change.
4.3. Re-evaluate Policy and Public Health Guidelines (SDG 3)
The evidence demonstrates that existing air quality standards are insufficient. The following actions are recommended:
- Develop new or supplementary air quality guidelines that account for short-term, high-intensity exposure to particulate matter from natural sources.
- Utilize high-resolution data to inform public health advisories and urban planning, ensuring that all communities, especially the most vulnerable, are protected.
- Promote research into the specific health consequences of acute exposure to dust from convective events to better quantify risks and inform policy.
Analysis of Sustainable Development Goals in the Article
1. Which SDGs are addressed or connected to the issues highlighted in the article?
The article on convective dust events and their impact on urban air quality monitoring addresses several Sustainable Development Goals (SDGs). The primary connections are to health, sustainable urban environments, and the need for improved infrastructure and technology.
-
SDG 3: Good Health and Well-being
This goal is central to the article, which frames convective dust events as a “health threat.” It explicitly discusses the adverse health impacts of poor air quality resulting from these events, referencing “haboob lung syndrome,” which led to hospitalization for healthy patients with “acute lung infiltrates/pneumonia symptoms,” and even one fatality. The article also mentions that dust events pose a safety hazard leading to “car injuries and fatalities,” further linking environmental conditions to human health and safety.
-
SDG 11: Sustainable Cities and Communities
The article’s focus is on “urban air quality” and the impact of dust events on cities like Lubbock, Texas, and Phoenix, Arizona. It highlights the vulnerability of urban populations to these environmental hazards. The discussion revolves around making cities safer and more resilient by improving how they monitor and manage air quality. The text points out that current monitoring systems in urban areas are inadequate to capture the true impact of these events, which directly relates to creating sustainable and safe urban environments.
-
SDG 9: Industry, Innovation and Infrastructure
This goal is addressed through the article’s critique of existing air quality monitoring infrastructure and its call for innovation. The text points out the “limitations of temporal and spatial observations” due to a limited number of reference sensors that provide only hourly measurements. The proposed solution is to build a more resilient and effective infrastructure using “dense networks of low-cost sensors” that can provide “short-duration measurements.” This emphasizes the need for technological upgrades and innovative approaches to infrastructure to solve a critical environmental monitoring problem.
-
SDG 13: Climate Action
While not the primary focus, SDG 13 is relevant as dust storms are a type of natural hazard whose frequency and intensity can be influenced by climate patterns. The article’s call to “develop better mitigation practices and allow the creation of prediction and warning systems” directly aligns with strengthening resilience and adaptive capacity to climate-related hazards and natural disasters.
2. What specific targets under those SDGs can be identified based on the article’s content?
Based on the issues discussed, several specific SDG targets can be identified:
-
Under SDG 3: Good Health and Well-being
- Target 3.9: By 2030, substantially reduce the number of deaths and illnesses from hazardous chemicals and air, water and soil pollution and contamination. The article directly supports this target by highlighting how dust events, a form of air pollution, cause illnesses (“haboob lung syndrome”) and deaths, and argues that their health impact is currently “underestimated.”
- Target 3.d: Strengthen the capacity of all countries… for early warning, risk reduction and management of national and global health risks. The article’s conclusion calls for the “creation of prediction and warning systems that could be used to alert the public,” which is a direct effort to manage the health risks associated with dust events.
-
Under SDG 11: Sustainable Cities and Communities
- Target 11.6: By 2030, reduce the adverse per capita environmental impact of cities, including by paying special attention to air quality. The entire article is a detailed analysis of urban air quality, arguing that current methods fail to capture the true “adverse per capita environmental impact” of short-duration dust events on city dwellers.
- Target 11.5: By 2030, significantly reduce the number of deaths and the number of people affected… caused by disasters. The article classifies convective dust events as a “safety hazard” that can “cause car injuries and fatalities,” thereby treating them as natural disasters that affect urban populations.
-
Under SDG 9: Industry, Innovation and Infrastructure
- Target 9.1: Develop quality, reliable, sustainable and resilient infrastructure… to support… human well-being. The article critiques the current air quality monitoring infrastructure as unreliable for capturing short-duration events and advocates for a more resilient infrastructure through “dense networks of… low-cost sensors.”
-
Under SDG 13: Climate Action
- Target 13.1: Strengthen resilience and adaptive capacity to climate-related hazards and natural disasters in all countries. The call to improve monitoring and develop “prediction and warning systems” is a measure to strengthen resilience against natural hazards like dust storms.
3. Are there any indicators mentioned or implied in the article that can be used to measure progress towards the identified targets?
The article explicitly and implicitly refers to several indicators that can measure progress towards the identified targets.
-
For Target 11.6 (Air Quality):
Indicator 11.6.2: Annual mean levels of fine particulate matter (e.g. PM2.5 and PM10) in cities. The article is fundamentally based on this indicator, providing numerous specific measurements of PM10 and PM2.5. For example, it cites a daily PM2.5 average of “23.5 μg m−3” in Lubbock and hourly PM10 concentrations reaching “4288 μg m−3” in Phoenix. However, the article’s core argument is that the standard daily or annual averaging “will mask the severity and true impact,” implying a need for higher-frequency (sub-daily) measurements as a more effective indicator for acute exposure events.
-
For Target 3.9 (Health Impacts from Pollution):
Indicator 3.9.1: Mortality rate attributed to… ambient air pollution. This is directly implied when the article mentions that one patient exposed to a convective dust event “passed away.” It also refers to illnesses (“acute lung infiltrates/pneumonia symptoms”) and hospitalizations, which serve as indicators of morbidity attributable to air pollution.
-
For Target 11.5 (Impact of Disasters):
Indicator 11.5.1: Number of deaths… and directly affected persons attributed to disasters. The article implies this indicator by stating that dust events “can cause car injuries and fatalities.” Tracking these numbers would measure progress in mitigating the disaster-related impact of dust storms.
-
For Target 9.1 (Resilient Infrastructure):
The article implies a qualitative and quantitative indicator for infrastructure resilience: the density and technological capability of air quality monitoring networks. It notes that “many locations prone to convective dust events do not have any air quality sensors or have only one.” Progress could be measured by the increase in the number of sensors per capita or per square kilometer in urban areas, particularly sensors capable of “short-duration measurements (ideally those that can be reported every 5 or 10 min).”
4. Table of SDGs, Targets, and Indicators
| SDGs, Targets and Indicators | Targets | Indicators |
|---|---|---|
| SDG 3: Good Health and Well-being |
|
|
| SDG 11: Sustainable Cities and Communities |
|
|
| SDG 9: Industry, Innovation and Infrastructure |
|
|
| SDG 13: Climate Action |
|
|
Source: nature.com

What is Your Reaction?
 Like
0
Like
0
 Dislike
0
Dislike
0
 Love
0
Love
0
 Funny
0
Funny
0
 Angry
0
Angry
0
 Sad
0
Sad
0
 Wow
0
Wow
0