


7 Hidden Smart Green City Planning Tools That Cut Energy Costs (2025) – Impakter
Report on Smart Urban Planning Solutions for Sustainable Development
Introduction: Urbanization and the Imperative for Sustainable Cities
By 2050, an estimated 68% of the global population will reside in urban centers, presenting a significant challenge to resource management and environmental stability. This rapid urbanization necessitates a strategic shift towards smart green city planning to meet escalating energy demands sustainably. The successful implementation of intelligent urban technologies is critical for achieving the United Nations’ Sustainable Development Goals (SDGs), particularly SDG 11 (Sustainable Cities and Communities), SDG 7 (Affordable and Clean Energy), and SDG 13 (Climate Action). This report outlines seven powerful smart planning solutions that can reduce urban energy costs and build more sustainable, resilient, and future-ready cities in alignment with the 2030 Agenda for Sustainable Development.
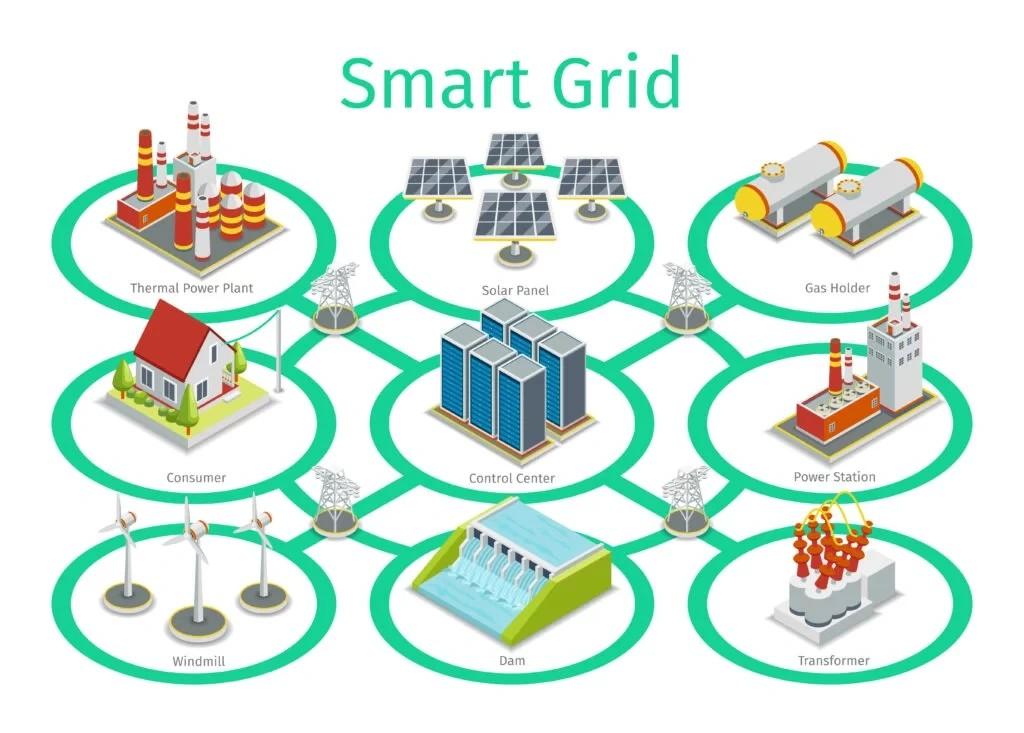
1. Smart Grids for Real-Time Energy Optimization
Smart grids represent a fundamental upgrade to traditional electricity networks, utilizing digital technology to balance energy supply and demand efficiently. This technology is instrumental in advancing SDG 7 by improving energy efficiency and facilitating the integration of renewable energy sources.
Core Functionalities and SDG Alignment
- Real-Time Monitoring: Advanced sensors and meters enable utilities to monitor energy consumption patterns and adjust supply dynamically, enhancing grid stability and contributing to the resilience aspect of SDG 11.
- Renewable Energy Integration: Smart grids effectively manage the variable output of renewable sources like solar and wind, ensuring a stable power supply and supporting the transition to clean energy as mandated by SDG 7 and SDG 13.
- Predictive Analytics: Data analysis allows for the accurate prediction of energy patterns, which helps utilities optimize resource allocation, reduce infrastructure stress, and minimize waste.
Quantifiable Impacts
- Energy costs can be reduced by approximately 20% through optimized distribution.
- CO₂ emissions can be lowered by up to 25%, directly contributing to SDG 13 (Climate Action).
2. AI-Powered Traffic Management Systems
Artificial intelligence (AI) in traffic management optimizes vehicle flow across urban networks, significantly reducing congestion, fuel consumption, and emissions. This directly supports SDG 11.2, which aims to provide access to safe, affordable, accessible, and sustainable transport systems for all.
Operational Mechanism and Benefits
AI systems analyze real-time data from sensors, cameras, and connected vehicles to adjust traffic signals dynamically. This responsive network management yields substantial benefits aligned with multiple SDGs.
- Environmental Impact (SDG 13): Optimized traffic flow can reduce urban fuel consumption by up to 20%, leading to a significant decrease in CO₂ emissions. In Pittsburgh, this technology reduced vehicle emissions by 20%.
- Economic Efficiency (SDG 8): A 10% improvement in delivery efficiency can generate over $1.30 billion in annual savings for logistics companies.
- Public Health and Safety (SDG 3): Reduced congestion allows for faster emergency vehicle response times. Each minute saved in response to cardiac arrest increases survival chances by 7%.
3. Precision Utility Mapping for Resilient Infrastructure
Subsurface Utility Engineering (SUE) provides accurate mapping of underground infrastructure, a critical component for safe and efficient urban development. This practice is foundational to building resilient infrastructure as outlined in SDG 9 (Industry, Innovation, and Infrastructure) and creating safe urban environments under SDG 11.
Importance in Urban Planning
Utilizing technologies like Ground Penetrating Radar (GPR) and Geographic Information Systems (GIS), precision mapping prevents costly and dangerous utility strikes during construction projects.
- Cost and Disruption Avoidance: The average utility strike costs $56,000 and causes 6-8 weeks of downtime. Accurate mapping mitigates this risk.
- Resource Efficiency: By providing a clear picture of subsurface conditions, planners can design infrastructure that integrates efficiently with existing utilities, reducing unnecessary excavation and energy consumption. This supports SDG 12 (Responsible Consumption and Production).
4. Sponge City Infrastructure for Water-Energy Synergy
The “Sponge City” concept integrates green and blue infrastructure to manage urban water naturally, mimicking natural absorption and filtration processes. This approach creates a powerful synergy between water and energy systems, advancing SDG 6 (Clean Water and Sanitation), SDG 11, and SDG 13.
Contributions to Sustainability
By using permeable pavements, rain gardens, and wetlands, sponge cities reduce reliance on energy-intensive water pumping and treatment systems.
- Energy Reduction (SDG 7): Water supply and treatment can account for 30-50% of a city’s energy budget. By harvesting rainwater and reducing runoff, sponge infrastructure significantly lowers this energy demand.
- Climate Action (SDG 13): Studies indicate that sponge city designs can achieve carbon neutrality within 22-30 years and reduce emissions significantly compared to conventional drainage systems.
- Resilience (SDG 11): This infrastructure enhances urban resilience to both floods and droughts.
5. Waste-to-Energy (WtE) Conversion Systems
WtE systems convert non-recyclable municipal solid waste into usable energy, addressing the dual challenges of waste management and energy demand. This technology is a key enabler of a circular economy and contributes to SDG 7, SDG 11, and SDG 12.
Process and Environmental Benefits
Through processes like controlled combustion, WtE facilities convert waste into electricity or heat while minimizing environmental impact.
- Waste is sorted and transferred to a combustion chamber.
- The heat generated converts water into steam.
- The steam drives turbines to produce electricity.
- Advanced pollution control systems capture emissions.
- Ash volume is reduced by approximately 87%.
By diverting waste from landfills, WtE systems prevent the formation of methane, a greenhouse gas 25 times more potent than carbon dioxide, thereby supporting SDG 13.
6. Sustainable Industrial Upgrades
Industrial and commercial buildings are major consumers of energy. Implementing sustainable upgrades in these sectors is crucial for reducing a city’s overall carbon footprint and building resilient infrastructure in line with SDG 9 and SDG 11.
Strategies for Greener Industry
Eco-friendly industrial upgrades focus on energy efficiency, renewable energy integration, and sustainable resource management.
- Energy Efficiency (SDG 7): Implementing Building Energy Performance Standards and retrofitting facilities with energy-efficient technologies can dramatically reduce electricity consumption.
- Renewable Energy: On-site solar arrays and geothermal heating/cooling systems reduce reliance on fossil fuels.
- Resource Management (SDG 12): Rainwater harvesting and advanced heat treatment services improve resource efficiency and component durability, reducing waste and long-term maintenance costs.
7. Circular Economy Platforms in Urban Planning
The circular economy offers a systemic approach to resource management that eliminates waste and regenerates natural systems. Integrating circular principles into urban planning is essential for achieving SDG 12 (Responsible Consumption and Production) and creating truly sustainable cities (SDG 11).
Role of Digital Platforms
Digital platforms can accelerate the transition to a circular economy by connecting waste producers with recyclers, facilitating sharing economies, and creating markets for secondary materials. Despite their potential, analysis shows that only 7% of cities have achieved high levels of circular economy integration in their climate action plans. A greater focus on these platforms is needed to unlock significant emissions reductions and enhance resource security, contributing directly to SDG 13.
Analysis of Sustainable Development Goals in the Article
1. Which SDGs are addressed or connected to the issues highlighted in the article?
The article on smart green city planning addresses several interconnected Sustainable Development Goals (SDGs) by focusing on technology-driven solutions for urban challenges. The primary SDGs identified are:
- SDG 7: Affordable and Clean Energy: The article extensively discusses enhancing energy efficiency, integrating renewable energy, and providing clean energy from waste. Solutions like smart grids, smart meters, and waste-to-energy plants directly contribute to this goal.
- SDG 9: Industry, Innovation, and Infrastructure: The focus on developing resilient, sustainable, and intelligent infrastructure is a core theme. This includes upgrading industrial facilities, implementing smart grids, using AI for traffic management, and employing advanced utility mapping to build more robust urban systems.
- SDG 11: Sustainable Cities and Communities: This is the central SDG of the article. It covers making cities inclusive, safe, resilient, and sustainable through improved urban planning, sustainable transport systems (AI traffic management), efficient waste management (waste-to-energy, circular economy), and resilience to climate-related disasters (sponge cities).
- SDG 12: Responsible Consumption and Production: The principles of the circular economy and waste-to-energy conversion systems directly address this goal by aiming to reduce waste generation, reuse materials, and convert waste into a valuable resource, moving away from a “take-make-dispose” model.
- SDG 13: Climate Action: A significant portion of the article is dedicated to climate change mitigation. Nearly every solution presented, from smart grids and AI traffic management to sponge cities and waste-to-energy systems, is linked to reducing CO₂ and other greenhouse gas emissions.
2. What specific targets under those SDGs can be identified based on the article’s content?
Based on the solutions and outcomes discussed, the following specific SDG targets are relevant:
- Target 7.2: By 2030, increase substantially the share of renewable energy in the global energy mix.
- Explanation: The article highlights how smart grids are essential for “incorporating renewable energy sources” like solar and wind power. It also mentions industrial upgrades that include “one-megawatt solar arrays” and “geothermal heating/cooling.”
- Target 7.3: By 2030, double the global rate of improvement in energy efficiency.
- Explanation: This target is supported by multiple examples, such as Shenzhen’s adoption of smart meters that “reduced energy use by 15%,” smart grids that can “cut overall energy costs by about 20% through better distribution and less waste,” and sustainable industrial upgrades aimed at reducing the 75% of electricity consumed by U.S. buildings and industries.
- Target 9.1: Develop quality, reliable, sustainable and resilient infrastructure.
- Explanation: The article’s focus on “smart grids,” “intelligent transportation systems,” and “precision utility mapping” using technologies like Ground Penetrating Radar (GPR) directly relates to building more advanced and resilient urban infrastructure.
- Target 9.4: By 2030, upgrade infrastructure and retrofit industries to make them sustainable, with increased resource-use efficiency and greater adoption of clean and environmentally sound technologies.
- Explanation: The section on “Sustainable Industrial Upgrades” explicitly discusses retrofitting industrial sites, such as the Historic Pearl Brewery redevelopment, and implementing eco-friendly practices to make them more energy-efficient and sustainable.
- Target 11.2: By 2030, provide access to safe, affordable, accessible and sustainable transport systems for all.
- Explanation: AI-powered traffic management systems are presented as a tool to create more efficient and sustainable transport networks. The article notes that these systems can reduce travel times (by 25% in Pittsburgh) and optimize traffic flow, making urban transport more sustainable.
- Target 11.6: By 2030, reduce the adverse per capita environmental impact of cities, including by paying special attention to air quality and municipal and other waste management.
- Explanation: This target is addressed through waste-to-energy conversion systems that manage over “2 billion tons of solid waste each year” and circular economy platforms designed to reduce the “50% of global waste” produced by cities. Reducing emissions from traffic and industry also contributes to improving air quality.
- Target 12.5: By 2030, substantially reduce waste generation through prevention, reduction, recycling and reuse.
- Explanation: The article promotes waste-to-energy systems that “cut waste volume by about 87%” and advocates for “Circular Economy Platforms” that “eliminate waste, circulate products and materials.”
- Target 13.2: Integrate climate change measures into national policies, strategies and planning.
- Explanation: The entire article serves as a blueprint for integrating climate change measures into urban planning. It provides concrete examples of emission reductions, such as Copenhagen’s “75% reduction in emissions,” Shenzhen’s “20%” reduction in CO₂ from traffic systems, and sponge cities cutting emissions by “7,089.85 kg CO₂ equivalent.”
3. Are there any indicators mentioned or implied in the article that can be used to measure progress towards the identified targets?
The article provides several quantitative and qualitative indicators that can be used to measure progress towards the identified targets:
- Indicator for Target 7.3 (Energy Efficiency):
- Mentioned/Implied: Percentage reduction in energy consumption and costs.
- Article Evidence: “Shenzhen… adoption of smart meters has reduced energy use by 15%.” “Smart grid systems can cut overall energy costs by about 20%.”
- Indicator for Target 11.2 (Sustainable Transport):
- Mentioned/Implied: Reduction in travel times and fuel consumption.
- Article Evidence: “Pittsburgh saw great results… Travel times dropped by 25%.” “AI-optimized traffic signals can cut fuel use by up to 20% in urban areas.”
- Indicator for Target 11.6 & 12.5 (Waste Management):
- Mentioned/Implied: Volume of waste processed and percentage reduction in waste volume.
- Article Evidence: “Dubai’s WtE plant powers 135,000 homes by using 2 million metric tons of waste yearly.” Waste-to-energy systems “cut waste volume by about 87%.”
- Indicator for Target 13.2 (Climate Action):
- Mentioned/Implied: Percentage reduction in CO₂ and greenhouse gas emissions.
- Article Evidence: “Copenhagen has recorded an impressive 75% reduction in emissions since 2005.” “Shenzhen… use of artificial intelligence in traffic systems has lowered CO₂ emissions by 20%.” Smart grids “can lower CO₂ emissions by up to 25%.”
4. Create a table with three columns titled ‘SDGs, Targets and Indicators” to present the findings from analyzing the article.
| SDGs | Targets | Indicators (Mentioned or Implied in the Article) |
|---|---|---|
| SDG 7: Affordable and Clean Energy | 7.2: Increase share of renewable energy. 7.3: Improve energy efficiency. |
– Integration of solar and wind into smart grids. – Percentage reduction in energy use (e.g., 15% via smart meters). – Percentage reduction in energy costs (e.g., 20% via smart grids). |
| SDG 9: Industry, Innovation and Infrastructure | 9.1: Develop sustainable and resilient infrastructure. 9.4: Upgrade infrastructure and retrofit industries for sustainability. |
– Implementation of smart grids and AI traffic systems. – Use of advanced utility mapping (GPR) to prevent utility strikes. – Adoption of eco-friendly industrial upgrades (e.g., solar arrays, geothermal). |
| SDG 11: Sustainable Cities and Communities | 11.2: Provide access to sustainable transport systems. 11.6: Reduce the environmental impact of cities (waste management). |
– Percentage reduction in travel times (e.g., 25% in Pittsburgh). – Tons of municipal solid waste processed annually (e.g., 2 million metric tons in Dubai). |
| SDG 12: Responsible Consumption and Production | 12.5: Substantially reduce waste generation. | – Percentage reduction in waste volume sent to landfills (e.g., 87% via WtE). – Implementation of circular economy platforms. |
| SDG 13: Climate Action | 13.2: Integrate climate change measures into planning. | – Percentage reduction in CO₂ and greenhouse gas emissions (e.g., 75% in Copenhagen, 20-25% from smart grids and AI traffic). – Amount of CO₂ equivalent reduction (e.g., 7,089.85 kg from sponge cities). |
Source: impakter.com
What is Your Reaction?
 Like
0
Like
0
 Dislike
0
Dislike
0
 Love
0
Love
0
 Funny
0
Funny
0
 Angry
0
Angry
0
 Sad
0
Sad
0
 Wow
0
Wow
0