


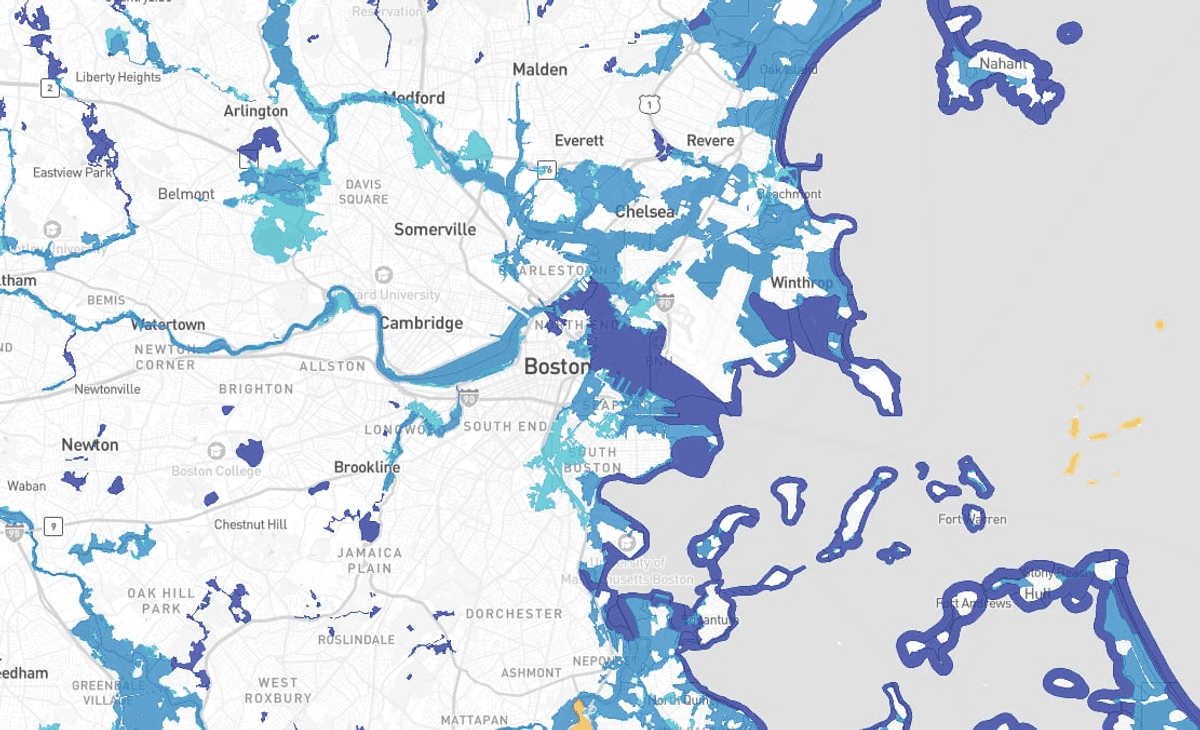
Map: Is my house in a flood zone? Look up your address. – The Boston Globe
Report on Climate-Induced Flood Risk and Alignment with Sustainable Development Goals
Introduction
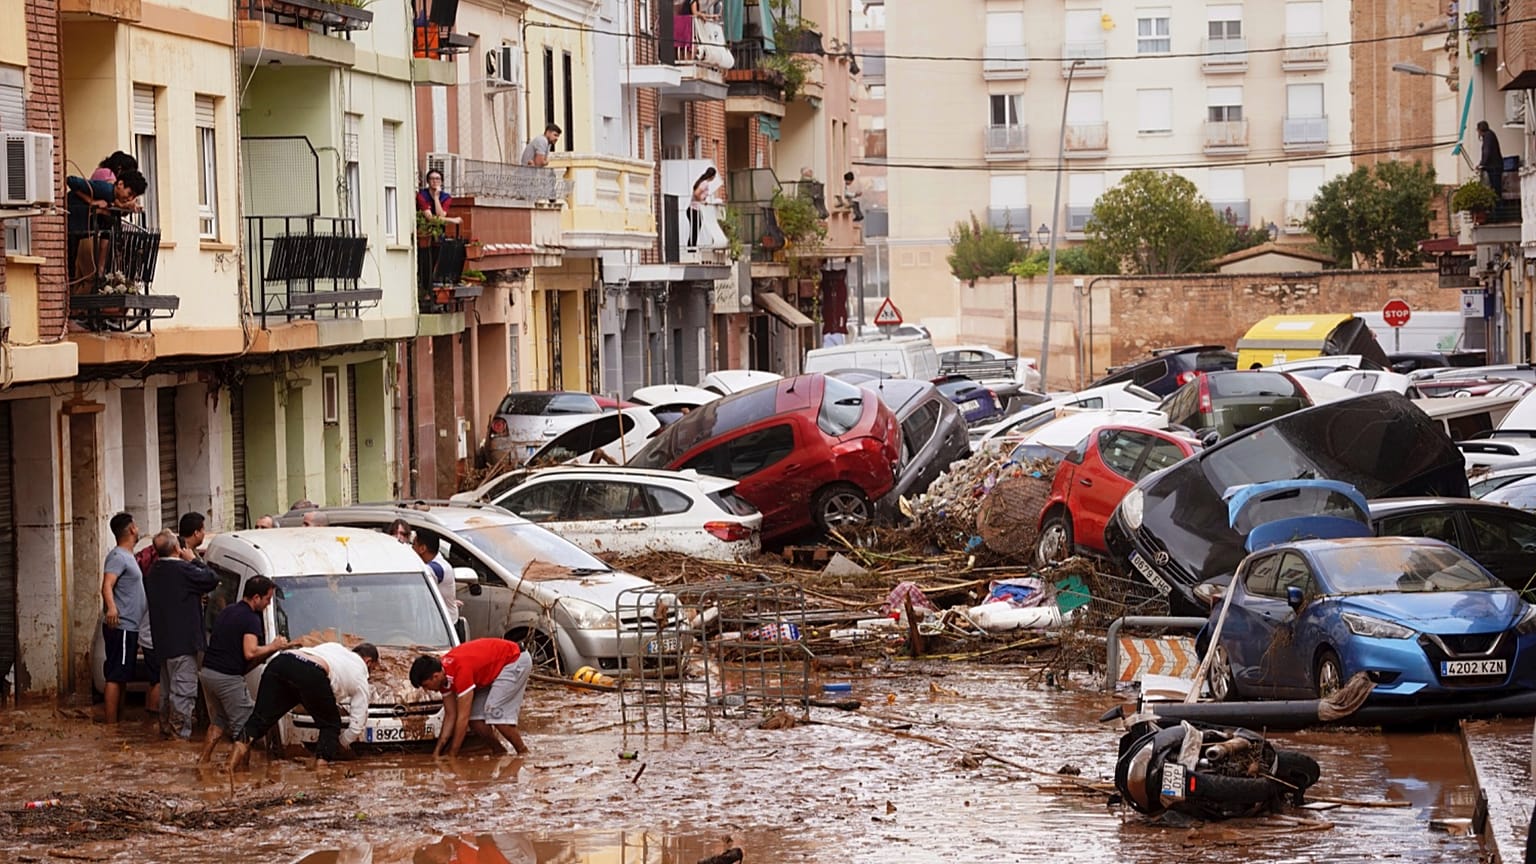
Climate change is escalating the frequency and intensity of hazardous flooding, posing a significant threat to communities both along coastlines and far inland. This phenomenon directly challenges the achievement of several Sustainable Development Goals (SDGs), particularly those related to climate action, infrastructure, and sustainable cities. This report analyzes current flood risk assessment models and their implications for sustainable development, highlighting the urgent need for climate-integrated planning to build resilient communities.
Assessing Flood Vulnerability: A Critical Step for SDG 11 and SDG 13
Effective climate action (SDG 13) and the development of sustainable cities and communities (SDG 11) depend on accurate and forward-looking risk assessments. Current methodologies for evaluating flood risk in Massachusetts utilize two primary models, each with distinct capabilities and limitations.
Current Assessment Models
- Federal Emergency Management Agency (FEMA) Flood Plains: This model identifies areas at risk from river or coastal flooding based on historical data. It serves as a basis for flood management regulations and insurance requirements.
- Massachusetts Coast Flood Risk Model (CZM): Developed by the state’s Office of Coastal Zone Management, this model incorporates sea level rise projections to estimate future coastal flood risk, with projections extending to 2050. It is based on thousands of different storm scenarios, offering a more dynamic view of future threats.
Limitations of Existing Frameworks
The current frameworks present significant gaps that hinder comprehensive risk reduction efforts, impacting progress towards SDG 11.5, which aims to reduce the impact of disasters.
- FEMA flood maps do not factor in the future impacts of climate change, such as sea level rise.
- The FEMA model does not account for “pluvial flooding,” which results from extreme rainfall events that are becoming more frequent.
- The CZM model is focused exclusively on coastal areas, leaving inland communities without a forward-looking risk assessment tool.
- Large areas of the state have flood maps that are not yet digitized, creating information gaps for local planning.
Implications for Sustainable Development
The increasing risk of flooding has direct consequences for multiple Sustainable Development Goals, threatening progress in creating safe, resilient, and sustainable environments.
SDG 11: Sustainable Cities and Communities
The goal of making cities and human settlements inclusive, safe, resilient, and sustainable is directly undermined by escalating flood risks. Damage to homes and the displacement of populations threaten community stability. Without accurate, climate-informed risk mapping, urban planning cannot effectively protect residents and infrastructure.
SDG 13: Climate Action
This issue underscores the necessity of taking urgent action to combat climate change and its impacts. Strengthening resilience and adaptive capacity to climate-related hazards (Target 13.1) requires moving beyond historical data. Predictive models like the CZM are essential tools for proactive climate adaptation, but their scope must be expanded to cover all at-risk areas, including those inland.
SDG 9: Industry, Innovation, and Infrastructure
Flooding events that sweep away roadways and damage critical infrastructure highlight the vulnerability of existing systems. Achieving SDG 9, which calls for building resilient infrastructure, requires that flood risk assessments inform the design, development, and maintenance of all public and private infrastructure projects.
Data and Terminology for Risk Management
Key Definitions
- Regulatory Floodway: A channel designed to carry flood waters without significantly increasing water levels.
- Flood Zone: An area identified by FEMA as having a specific risk of inundation. A 100-year flood zone has a 1% annual probability of flooding, while a 500-year zone has a 0.2% probability, though climate change is increasing these likelihoods.
- Pluvial Flooding: Flooding caused directly by extreme rainfall, independent of overflowing bodies of water.
Data Sources Analyzed
- FEMA Flood Maps
- Used for regulatory and insurance purposes.
- Based on historical storm scenarios (e.g., 1% or 0.2% annual probability).
- Critically, this data does not integrate projections related to climate change.
- Massachusetts Coastal Flood Risk Model (CZM)
- Incorporates scientific sea level rise projections.
- Estimates future coastal flood risk based on thousands of storm scenarios.
- Provides a forward-looking assessment essential for climate adaptation planning (SDG 13).
Conclusion and Recommendations for SDG Alignment
The analysis indicates that a reliance on historical data for flood risk assessment is insufficient for building resilient communities in the face of accelerating climate change. To align with the Sustainable Development Goals, a more comprehensive and forward-looking approach is required.
- Integrate Climate Projections: All flood risk mapping must incorporate climate change projections, including sea level rise and increased precipitation, to support proactive measures under SDG 13.
- Expand Assessment Scope: Risk models must be expanded to include pluvial flooding and provide complete coverage for both coastal and inland communities, ensuring no area is left vulnerable, in line with the principles of SDG 11.
- Inform Resilient Infrastructure: Updated, predictive flood risk data should be a mandatory input for all urban planning and infrastructure projects to meet the resilience targets of SDG 9.
Analysis of Sustainable Development Goals in the Article
1. Which SDGs are addressed or connected to the issues highlighted in the article?
-
SDG 11: Sustainable Cities and Communities
The article directly addresses the vulnerability of human settlements to climate-related disasters. It discusses how “Intense flash flooding events have damaged homes” and highlights the “neighborhood’s risk of flooding.” This focus on the safety and resilience of communities in the face of natural disasters is a core component of SDG 11.
-
SDG 13: Climate Action
This is the central theme of the article. The opening sentence explicitly states, “Climate change is making dangerous floods more frequent.” The text discusses the impacts of climate change, such as “sea level rise” and “extreme rainstorms,” and the need for better models to understand and adapt to these changes, which aligns directly with the call for urgent action to combat climate change and its impacts.
-
SDG 9: Industry, Innovation and Infrastructure
The article mentions that flooding has “swept away roadways,” pointing to the vulnerability of critical infrastructure. This connects to SDG 9’s goal of building resilient infrastructure that can withstand climate-related shocks and disasters.
2. What specific targets under those SDGs can be identified based on the article’s content?
-
SDG 11: Sustainable Cities and Communities
-
Target 11.5: By 2030, significantly reduce the number of deaths and the number of people affected and substantially decrease the direct economic losses relative to global gross domestic product caused by disasters, including water-related disasters, with a focus on protecting the poor and people in vulnerable situations.
- The article’s focus on mapping flood risk to protect communities and property (“damaged homes,” “swept away roadways”) is directly aimed at mitigating the impact of water-related disasters, which is the essence of this target.
-
Target 11.b: By 2020, substantially increase the number of cities and human settlements adopting and implementing integrated policies and plans towards inclusion, resource efficiency, mitigation and adaptation to climate change, resilience to disasters…
- The article discusses the development and use of advanced tools like the “Massachusetts Coast Flood Risk Model” which “incorporates sea level rise projections to estimate the future risk.” This represents a clear effort by a state-level authority to implement plans for climate change adaptation and disaster resilience.
-
Target 11.5: By 2030, significantly reduce the number of deaths and the number of people affected and substantially decrease the direct economic losses relative to global gross domestic product caused by disasters, including water-related disasters, with a focus on protecting the poor and people in vulnerable situations.
-
SDG 13: Climate Action
-
Target 13.1: Strengthen resilience and adaptive capacity to climate-related hazards and natural disasters in all countries.
- The entire article is about understanding and adapting to the increased risk of flooding due to climate change. The comparison between FEMA maps and the new Massachusetts model highlights an effort to improve adaptive capacity by using better, climate-informed data.
-
Target 13.1: Strengthen resilience and adaptive capacity to climate-related hazards and natural disasters in all countries.
-
SDG 9: Industry, Innovation and Infrastructure
-
Target 9.1: Develop quality, reliable, sustainable and resilient infrastructure… to support economic development and human well-being…
- The mention of roadways being “swept away” underscores the lack of resilience in existing infrastructure. The article implicitly calls for the need to build or upgrade infrastructure to withstand the increasing frequency of extreme weather events.
-
Target 9.1: Develop quality, reliable, sustainable and resilient infrastructure… to support economic development and human well-being…
3. Are there any indicators mentioned or implied in the article that can be used to measure progress towards the identified targets?
-
For SDG 11 (Sustainable Cities and Communities)
- Direct economic loss attributed to disasters: The article implies this indicator by mentioning that floods have “damaged homes and swept away roadways,” which represent significant economic losses for individuals and the public.
- Adoption of local disaster risk reduction strategies: The article explicitly describes two different flood risk mapping strategies: the one from the Federal Emergency Management Agency (FEMA) and the “Massachusetts Coast Flood Risk Model.” The existence and use of these models serve as an indicator of local disaster risk reduction planning.
-
For SDG 13 (Climate Action)
- Number of countries/regions with national and local disaster risk reduction strategies: The article’s focus on the Massachusetts Office of Coastal Zone Management’s model is a direct example of a local, state-level strategy for climate change adaptation, which is a key indicator for this target.
-
For SDG 9 (Industry, Innovation and Infrastructure)
- Proportion of critical infrastructure damaged or destroyed by disasters: The article provides a qualitative example of this indicator by stating that floods have “swept away roadways.” This could be quantified to measure the resilience of local infrastructure.
4. Summary Table: SDGs, Targets, and Indicators
| SDGs | Targets | Indicators (Mentioned or Implied in the Article) |
|---|---|---|
| SDG 11: Sustainable Cities and Communities | 11.5: Reduce the economic losses and number of people affected by disasters.
11.b: Increase the number of cities implementing policies for climate change adaptation and disaster resilience. |
– Economic losses from damaged property (e.g., “damaged homes”). – Existence and use of local disaster risk reduction strategies (e.g., “Massachusetts Coast Flood Risk Model”). |
| SDG 13: Climate Action | 13.1: Strengthen resilience and adaptive capacity to climate-related hazards. | – Implementation of local climate adaptation plans (evidenced by the state’s development of a new flood risk model that accounts for “sea level rise projections”). |
| SDG 9: Industry, Innovation and Infrastructure | 9.1: Develop quality, reliable, sustainable and resilient infrastructure. | – Damage to critical infrastructure from disasters (e.g., roadways being “swept away”). |
Source: apps.bostonglobe.com
What is Your Reaction?
 Like
0
Like
0
 Dislike
0
Dislike
0
 Love
0
Love
0
 Funny
0
Funny
0
 Angry
0
Angry
0
 Sad
0
Sad
0
 Wow
0
Wow
0