Demand for Direct Drive Wind Turbine in USA | Global Market Analysis Report – 2035 – Future Market Insights
Market Analysis of Direct Drive Wind Turbines in the USA: A Report on Contributions to Sustainable Development Goals
Executive Summary: Market Growth and Alignment with Global Goals
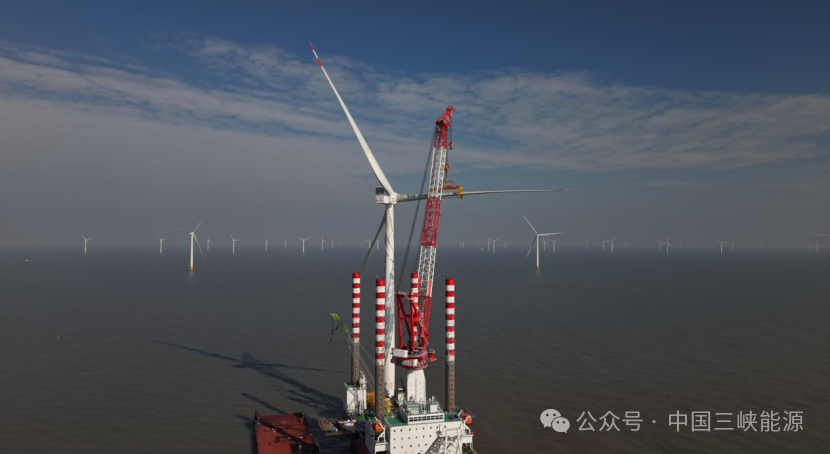
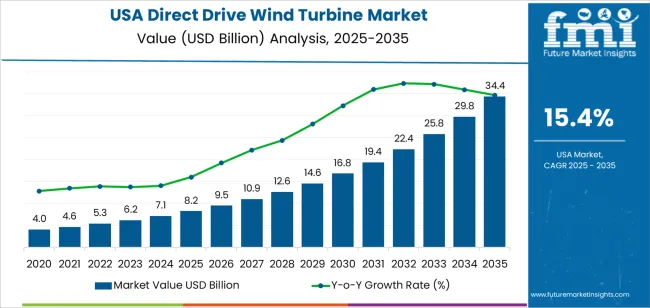
The United States market for direct drive wind turbines is undergoing a significant expansion, directly contributing to the achievement of key Sustainable Development Goals (SDGs), particularly SDG 7 (Affordable and Clean Energy) and SDG 13 (Climate Action). The market is projected to grow from a valuation of USD 8.2 billion in 2025 to USD 34.4 billion by 2035, demonstrating a compound annual growth rate (CAGR) of 15.4%. This growth signifies a substantial national investment in resilient and sustainable energy infrastructure, underpinning the country’s decarbonization strategy. The increasing adoption of direct drive technology, prized for its enhanced reliability and reduced maintenance, is pivotal for scaling up clean energy generation for both onshore and offshore applications, thereby advancing the transition to a low-carbon economy.
Financial Projections and Investment in Sustainable Infrastructure (SDG 9)
Forecasted Market Trajectory: 2025-2035
The financial outlook for the direct drive wind turbine sector indicates an accelerating commitment to renewable energy infrastructure, a core component of SDG 9 (Industry, Innovation, and Infrastructure). The projected growth reflects increasing deployment volumes, modernization of existing wind fleets, and robust investment in high-capacity turbine technologies that are essential for a stable and clean energy grid.
- 2025 Market Value: USD 8.2 billion
- 2026 Forecast: USD 9.5 billion
- 2027 Forecast: USD 10.9 billion
- 2031 Forecast: USD 16.8 billion
- 2033 Forecast: USD 25.8 billion
- 2035 Forecast Value: USD 34.4 billion
Key Market Statistics
- Forecast CAGR (2025–2035): 15.4%
- Leading Capacity Segment: Less than 1MW (46%), supporting SDG 11 (Sustainable Cities and Communities) through distributed generation.
- Key Growth Regions: West, South, Northeast, Midwest
- Leading Industry Innovators: American Superconductor (AMSC), Enercon GmbH, GE Renewable Energy, Emergya Wind Technologies BV
Primary Drivers of Market Growth and SDG Attainment
Technological Advancement and Reliability for SDG 7
The primary driver for the adoption of direct drive wind turbines is their contribution to a more reliable and efficient clean energy supply, directly supporting SDG 7. By eliminating the gearbox, these turbines feature reduced mechanical complexity, which leads to lower long-term maintenance requirements and less operational downtime. This enhanced reliability is critical for large-scale wind projects, especially in challenging offshore environments, ensuring a consistent and predictable supply of renewable electricity to the grid.
Policy Support and Climate Action (SDG 13)
Federal and state-level policies promoting grid decarbonization and renewable energy are fundamental to market growth. Incentives for large-scale wind projects accelerate the deployment of direct drive turbines, positioning them as a key technology in the national strategy to combat climate change in line with SDG 13. The expansion of offshore wind capacity, particularly along the East Coast, is a direct response to climate targets and relies heavily on the robust performance of direct drive systems.
Analysis by Market Segment: Tailoring Technology for Sustainable Outcomes
Capacity Segmentation and Community Energy (SDG 11)
The market is segmented by capacity to meet diverse project scales and energy needs. The leading segment, turbines with a capacity of less than 1 MW, holds a 46% market share. This highlights a strong trend towards decentralized energy systems that empower local communities, a key objective of SDG 11 (Sustainable Cities and Communities). These smaller turbines are ideal for distributed generation, microgrids, and community-led renewable initiatives, making clean energy more accessible at a local level.
Technology Segmentation and Industrial Innovation (SDG 9)
Permanent Magnet Synchronous Generators (PMSGs) represent the dominant technology, accounting for 56.4% of the market. The widespread adoption of PMSGs is a testament to industrial innovation under SDG 9. Their high efficiency, compact design, and reliability without the need for an external excitation system reduce operational complexities and enhance energy capture. This technological preference underscores the industry’s focus on maximizing the output and longevity of clean energy assets.
Regional Growth Analysis: A National Effort Towards Clean Energy
The adoption of direct drive wind turbines shows strong momentum across all regions of the United States, indicating a unified national push towards achieving SDG 7. Each region’s growth is propelled by specific investments and policy frameworks aimed at expanding renewable energy capacity.
- West USA (17.7% CAGR): Leads the nation, driven by ambitious state-level carbon reduction goals and significant investments in utility-scale wind projects. This region’s rapid adoption exemplifies a strong commitment to sustainable infrastructure.
- South USA (15.9% CAGR): Growth is supported by the expansion of wind installations in coastal and plains states, contributing significantly to the diversification of the regional energy mix and enhancing grid resilience.
- Northeast USA (14.2% CAGR): Growth is heavily influenced by pioneering offshore wind developments and a strong regional commitment to transitioning away from fossil fuels, directly addressing SDG 13.
- Midwest USA (12.3% CAGR): Continued investment in established wind corridors and utility-scale projects ensures the Midwest remains a cornerstone of the nation’s onshore wind capacity, supporting both energy security and climate goals.
Competitive Landscape and Contribution to Sustainable Economic Growth (SDG 8)
The market is shaped by key industry players whose innovations are critical to advancing the energy transition. The expansion of this sector also contributes to SDG 8 (Decent Work and Economic Growth) by creating skilled jobs in manufacturing, logistics, installation, and maintenance of green infrastructure.
Key Industry Players
- American Superconductor (AMSC): A key contributor of advanced drivetrain and power-electronics technology.
- GE Renewable Energy: A major developer with a significant footprint in the U.S. market, deploying direct drive models in large-scale projects.
- Enercon GmbH: A global leader with extensive experience in gearless turbine technology.
- Emergya Wind Technologies BV: A provider of tailored turbine solutions for mid-scale projects.
The collaborative efforts of these global manufacturers, alongside domestic engineering and integration firms, are essential for adapting and deploying direct drive technology effectively across the diverse geographical and logistical landscapes of the United States.
Analysis of Sustainable Development Goals in the Article
1. Which SDGs are addressed or connected to the issues highlighted in the article?
The article on the demand for direct drive wind turbines in the USA is directly connected to several Sustainable Development Goals (SDGs). The analysis identifies the following primary and secondary SDGs:
- SDG 7: Affordable and Clean Energy: This is the most prominent SDG, as the entire article focuses on the growth of wind power, a key source of clean and renewable energy.
- SDG 9: Industry, Innovation, and Infrastructure: The article discusses technological advancements in wind turbines (direct drive systems), investment in energy infrastructure (onshore and offshore wind farms), and the growth of the renewable energy industry.
- SDG 13: Climate Action: By detailing the expansion of wind energy, the article implicitly addresses a core strategy for climate change mitigation. The text explicitly mentions drivers like “grid decarbonisation” and “carbon reduction goals.”
- SDG 8: Decent Work and Economic Growth: The substantial market growth, valued in billions of dollars, and the activities of key industry players signify significant economic activity and potential for job creation in the green economy.
2. What specific targets under those SDGs can be identified based on the article’s content?
Based on the article’s discussion of market growth, technological shifts, and policy drivers, several specific SDG targets can be identified:
- Under SDG 7 (Affordable and Clean Energy):
- Target 7.2: By 2030, increase substantially the share of renewable energy in the global energy mix. The article’s forecast of a 15.4% compound annual growth rate (CAGR) for wind turbine demand directly supports this target by showing a rapid expansion of renewable energy capacity in the USA.
- Target 7.a: By 2030, enhance international cooperation to facilitate access to clean energy research and technology… and promote investment in energy infrastructure and clean energy technology. The article highlights “strengthened investment commitments” and the development of “high-efficiency turbine configurations” as key drivers, reflecting investment in clean energy technology and infrastructure.
- Under SDG 9 (Industry, Innovation, and Infrastructure):
- Target 9.1: Develop quality, reliable, sustainable and resilient infrastructure. The article emphasizes that direct drive turbines are sought for their “higher reliability,” “lower maintenance,” and “reduced mechanical complexity,” contributing to the development of more reliable and sustainable energy infrastructure.
- Target 9.4: By 2030, upgrade infrastructure and retrofit industries to make them sustainable… with greater adoption of clean and environmentally sound technologies. The shift from traditional geared turbines to more efficient direct drive systems, as well as the “repowering of ageing wind farms,” are clear examples of upgrading infrastructure with cleaner and more efficient technology.
- Under SDG 13 (Climate Action):
- Target 13.2: Integrate climate change measures into national policies, strategies and planning. The article explicitly states that growth is driven by “federal and state energy policies [that] encourage grid decarbonisation” and “state-level clean-energy standards,” showing the integration of climate goals into national and regional planning.
- Under SDG 8 (Decent Work and Economic Growth):
- Target 8.2: Achieve higher levels of economic productivity through diversification, technological upgrading and innovation. The focus on technological innovation, such as the development of “permanent magnet synchronous generators” and “integrated digital operations,” contributes to productivity and growth in the renewable energy sector.
3. Are there any indicators mentioned or implied in the article that can be used to measure progress towards the identified targets?
Yes, the article is rich with quantitative and qualitative data that can serve as indicators to measure progress towards the identified targets.
- For SDG 7.2 (Increase share of renewable energy):
- Financial Investment: The market value is projected to grow from USD 8.2 billion in 2025 to USD 34.4 billion by 2035. This financial flow is a direct indicator of investment in renewable energy capacity.
- Growth Rate: The projected CAGR of 15.4% indicates the rate of expansion of this clean energy sector.
- For SDG 9.4 (Upgrade infrastructure with clean technologies):
- Technology Adoption Rate: The article notes that “permanent magnet synchronous generators account for 56.4% of total demand,” indicating the market share and adoption rate of a specific high-efficiency technology.
- Market Segmentation by Capacity: The breakdown of demand by capacity (“Less than 1 MW,” “1 MW to 3 MW,” etc.) shows the scale of infrastructure being deployed.
- For SDG 13.2 (Integrate climate measures into policy):
- Policy as a Driver: The article identifies “federal incentive programmes,” “federal tax incentives,” and “state-level clean-energy standards” as key drivers, implying that the existence and effectiveness of these policies are measurable indicators.
- Stated Goals: The mention of “carbon reduction goals” in regions like West USA serves as a qualitative indicator of policy integration at the state level.
- For SDG 8.2 (Economic productivity through innovation):
- Industry Value: The overall industry value (USD 8.2 billion in 2025) is a direct measure of the economic contribution of this sector.
- Regional Economic Growth: The specific CAGRs for different regions (e.g., “West USA is projected to grow at a CAGR of 17.7%”) can be used as indicators of regional economic growth driven by the green technology industry.
4. Summary Table of SDGs, Targets, and Indicators
| SDGs | Targets | Indicators Identified in the Article |
|---|---|---|
| SDG 7: Affordable and Clean Energy | 7.2: Increase substantially the share of renewable energy in the global energy mix. |
|
| SDG 9: Industry, Innovation, and Infrastructure | 9.4: Upgrade infrastructure and retrofit industries to make them sustainable… with greater adoption of clean and environmentally sound technologies. |
|
| SDG 13: Climate Action | 13.2: Integrate climate change measures into national policies, strategies and planning. |
|
| SDG 8: Decent Work and Economic Growth | 8.2: Achieve higher levels of economic productivity through… technological upgrading and innovation. |
|
Source: futuremarketinsights.com
What is Your Reaction?
 Like
0
 Dislike
0
 Love
0
 Funny
0
 Angry
0
 Sad
0
Sad
0
 Wow
0
Wow
0


