


;Resize=620#)


Where America’s CO2 emissions come from – what you need to know, in charts – | The Invading Sea
Report on Carbon Dioxide Emissions and Their Impact on Sustainable Development Goals
Introduction: The Challenge to Climate Action (SDG 13)
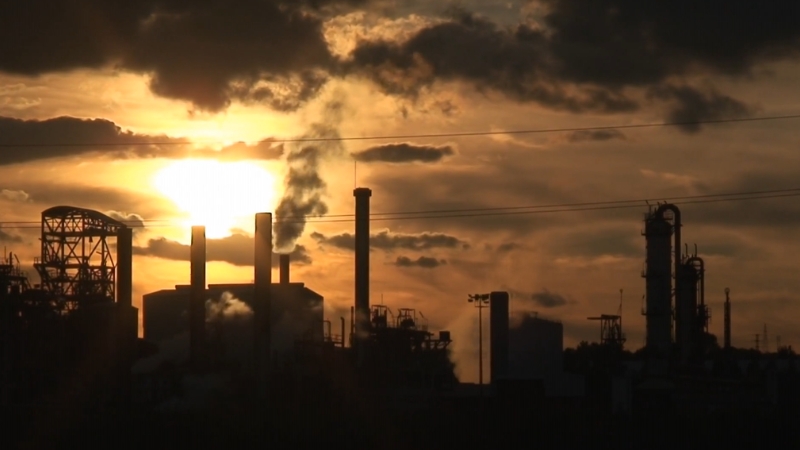
Atmospheric carbon dioxide (CO2) is essential for life, regulating Earth’s temperature and enabling photosynthesis. However, post-industrial human activity, primarily the combustion of fossil fuels, has increased atmospheric CO2 concentrations by over 50% to levels unprecedented in at least one million years. This rapid increase presents a direct and urgent threat to global climate stability and the achievement of Sustainable Development Goal 13 (Climate Action).
Consequences of Elevated CO2 for Sustainable Development
Impacts on Climate, Communities, and Ecosystems
The rise in atmospheric CO2 is the primary driver of global warming, which in turn creates cascading effects that undermine multiple Sustainable Development Goals.
- SDG 13 (Climate Action): Increased surface temperatures accelerate the water cycle, leading to a higher frequency and intensity of floods and droughts. This contributes to the melting of glaciers and thermal expansion of ocean water, causing sea-level rise.
- SDG 11 (Sustainable Cities and Communities): Climate-related disasters such as wildfires, heat waves, and hurricanes are becoming more severe, threatening the resilience and safety of human settlements.
- SDG 14 (Life Below Water): The ocean absorbs excess CO2, leading to increased acidity. This process of ocean acidification harms marine organisms, particularly those crucial to the marine food chain, directly compromising targets for protecting marine ecosystems.
- SDG 15 (Life on Land): While terrestrial ecosystems like forests act as carbon sinks, their capacity is insufficient to offset current emission levels. Climate change also puts these vital ecosystems under stress.
Analysis of CO2 Emission Sources in the United States
Primary Source: Fossil Fuel Combustion
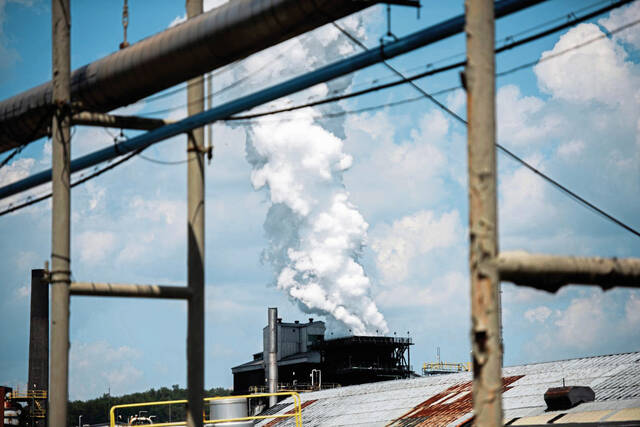
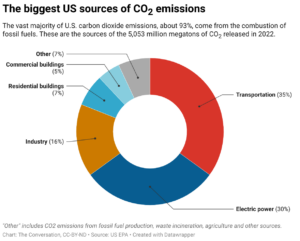
The overwhelming source of additional CO2 is the combustion of fossil fuels—oil, natural gas, and coal—which reverses millions of years of natural carbon sequestration. In 2022, 93% of the 5,053 million metric tons of CO2 emitted by the U.S. originated from this source, highlighting the critical need to transition towards cleaner energy as outlined in SDG 7.
Sectoral Emissions Breakdown (2022 Data)
A sectoral analysis reveals key areas for intervention to advance SDG 7 (Affordable and Clean Energy) and SDG 11 (Sustainable Cities and Communities).
- Transportation (35%): Dominated by petroleum products, this is the largest emitting sector.
- Electric Power Generation (30%): Fueled by coal and natural gas, this sector provides energy to all other sectors.
- Industrial (16%): Relates to on-site fossil fuel consumption for manufacturing and industrial processes, a key area for SDG 12 (Responsible Consumption and Production).
- Residential (7%): Emissions from heating and other energy uses in homes.
- Commercial (5%): Emissions from energy consumption in commercial buildings.
Emission Trends and Progress Towards Sustainability Goals
U.S. Emission Trajectory
U.S. CO2 emissions peaked in 2005 at 6,217 million metric tons and have since shown a gradual decline. This reduction has been largely driven by a shift from coal to natural gas in electricity production. However, further and faster reductions are necessary to meet climate targets.
Key Developments and Challenges for SDG 7
- Energy Efficiency: The U.S. economy has demonstrated increased energy efficiency, a positive trend that supports SDG Target 7.3 by decoupling economic growth from energy consumption.
- Renewable Energy Growth: Solar and wind energy generation has grown steadily, offering a zero-emission alternative that directly supports SDG Target 7.2 (increase the share of renewable energy). These sources have become cost-competitive with fossil fuels.
- Future Challenges: Progress is threatened by shifting federal support for renewable energy and increasing electricity demand from new sources like data centers. The method used to meet this demand will significantly influence future emissions and the nation’s ability to contribute to SDG 13.
Global Context and International Responsibility
Comparative Emissions Analysis
While China is the world’s largest annual emitter of CO2, the United States holds the position of the largest cumulative emitter in history. On a per capita basis, U.S. emissions remain significantly higher than those of China and most European nations. This historical and ongoing contribution underscores a significant responsibility in leading global climate action.
Implications for Global Equity
Greenhouse gases mix globally, meaning emissions from industrialized nations disproportionately affect the climate of developing countries. This reality highlights the interconnectedness of the SDGs and the need for international cooperation and climate justice to ensure that the burdens of climate change do not fall on the most vulnerable populations who have benefited least from industrialization.
Analysis of Sustainable Development Goals in the Article
1. Which SDGs are addressed or connected to the issues highlighted in the article?
-
SDG 7: Affordable and Clean Energy
- The article extensively discusses energy sources, focusing on the combustion of fossil fuels (oil, natural gas, coal) for electricity generation and transportation. It also highlights the growth of renewable energy sources like solar and wind, mentioning their increasing affordability and role in reducing CO2 emissions.
-
SDG 11: Sustainable Cities and Communities
- The article breaks down U.S. CO2 emissions by sector, specifically identifying transportation (35%), residential buildings (7%), and commercial buildings (5%) as major contributors. This directly relates to the environmental impact of urban and community activities.
-
SDG 13: Climate Action
- This is the central theme of the article. It details the rise in atmospheric CO2 concentrations since the industrial revolution, linking it directly to global warming and its consequences, such as accelerated water cycles (floods, droughts), melting glaciers, sea-level rise, and an increased frequency of extreme weather events like wildfires, heat waves, and hurricanes.
-
SDG 14: Life Below Water
- The article explicitly states that the ocean absorbs excess CO2, “making the water increasingly acidic, which can harm species crucial to the marine food chain.” This directly addresses the issue of ocean acidification and its threat to marine ecosystems.
-
SDG 15: Life on Land
- The role of forests in mitigating climate change is mentioned. The article notes that “U.S. forests are removing CO2 from the atmosphere” and quantifies this by stating they “removed and stored about 920 million metric tons of CO2 in 2022,” highlighting the importance of terrestrial ecosystems in the carbon cycle.
2. What specific targets under those SDGs can be identified based on the article’s content?
-
Under SDG 7 (Affordable and Clean Energy)
- Target 7.2: By 2030, increase substantially the share of renewable energy in the global energy mix. The article supports this by discussing how solar and wind energy generation has “grown steadily in recent years” and that relying more on these sources “will dramatically reduce its CO2 emissions.”
- Target 7.3: By 2030, double the global rate of improvement in energy efficiency. This is referenced when the article states, “the U.S. economy has become more energy efficient over time, increasing productivity while decreasing emissions.”
-
Under SDG 11 (Sustainable Cities and Communities)
- Target 11.6: By 2030, reduce the adverse per capita environmental impact of cities, including by paying special attention to air quality and municipal and other waste management. The article’s breakdown of CO2 emissions from transportation, residential, and commercial sectors directly relates to the air quality aspect of this target.
-
Under SDG 13 (Climate Action)
- Target 13.1: Strengthen resilience and adaptive capacity to climate-related hazards and natural disasters in all countries. The article identifies these hazards by mentioning the “increasing frequency or intensity of wildfires, heat waves, flooding and hurricanes, all influenced by increasing CO2 concentrations.”
- Target 13.2: Integrate climate change measures into national policies, strategies and planning. The discussion of U.S. emissions trends, the shift away from coal, the growth of renewables, and the impact of federal support for different energy sources all relate to national strategies for climate action.
-
Under SDG 14 (Life Below Water)
- Target 14.3: Minimize and address the impacts of ocean acidification, including through enhanced scientific cooperation at all levels. The article directly identifies this issue by stating that ocean absorption of CO2 makes the water “increasingly acidic.”
-
Under SDG 15 (Life on Land)
- Target 15.2: By 2020, promote the implementation of sustainable management of all types of forests, halt deforestation, restore degraded forests and substantially increase afforestation and reforestation globally. The article’s mention of U.S. forests removing and storing CO2 from the atmosphere underscores the importance of forest ecosystems in climate mitigation, which is a core component of sustainable forest management.
3. Are there any indicators mentioned or implied in the article that can be used to measure progress towards the identified targets?
-
For SDG 7 Targets:
- Indicator for Target 7.2: The share of renewable energy (solar and wind) in total energy production. The article notes this share has “grown steadily.”
- Indicator for Target 7.3: Energy intensity measured in terms of emissions per unit of economic productivity. The article implies this by stating the U.S. economy is “increasing productivity while decreasing emissions.”
-
For SDG 11 Targets:
- Indicator for Target 11.6: Greenhouse gas emissions per capita or by sector. The article provides specific data points: “35% of the CO2 emissions were from transportation, 30% from the generation of electric power, and 16%, 7% and 5% from… industrial, residential and commercial buildings.”
-
For SDG 13 Targets:
- Indicator for Target 13.1: The frequency and intensity of climate-related disasters. The article explicitly mentions an “increasing frequency or intensity of wildfires, heat waves, flooding and hurricanes.”
- Indicator for Target 13.2: Total greenhouse gas emissions. The article provides precise figures, such as the U.S. emitting “5,053 million metric tons of CO2 into the atmosphere in 2022″ and tracks the trend from a peak in 2005. It also mentions the atmospheric concentration of CO2, which has “risen by more than 50%.”
-
For SDG 14 Targets:
- Indicator for Target 14.3: Average marine acidity (pH). While not giving a specific pH value, the article directly implies this measurement by stating the ocean is becoming “increasingly acidic.”
-
For SDG 15 Targets:
- Indicator for Target 15.2: Progress towards sustainable forest management, measured by carbon stock in forests. The article provides a direct measure of this ecosystem service: “U.S. forests removed and stored about 920 million metric tons of CO2 in 2022.”
4. Summary Table of SDGs, Targets, and Indicators
| SDGs | Targets | Indicators Identified in the Article |
|---|---|---|
| SDG 7: Affordable and Clean Energy | 7.2 Increase the share of renewable energy. 7.3 Improve energy efficiency. |
|
| SDG 11: Sustainable Cities and Communities | 11.6 Reduce the environmental impact of cities. |
|
| SDG 13: Climate Action | 13.1 Strengthen resilience to climate-related disasters. 13.2 Integrate climate change measures into policies. |
|
| SDG 14: Life Below Water | 14.3 Minimize and address ocean acidification. |
|
| SDG 15: Life on Land | 15.2 Promote sustainable management of forests. |
|
Source: theinvadingsea.com
What is Your Reaction?
 Like
0
Like
0
 Dislike
0
Dislike
0
 Love
0
Love
0
 Funny
0
Funny
0
 Angry
0
Angry
0
 Sad
0
Sad
0
 Wow
0
Wow
0