


How to Tell If Your Outdoor Air Is Safe – Time Magazine

Report on Air Quality Monitoring and its Implications for Sustainable Development Goals (SDGs)
Outdoor air pollution represents one of the most significant environmental health risks, contributing to millions of premature deaths annually. This issue directly challenges the achievement of several United Nations Sustainable Development Goals (SDGs), including SDG 3 (Good Health and Well-being), SDG 11 (Sustainable Cities and Communities), and SDG 13 (Climate Action). Effective monitoring, public awareness, and mitigation strategies are essential to address the cumulative health risks associated with poor air quality.
Health Implications of Air Pollution: A Challenge to SDG 3
Air pollution is a critical underlying factor for numerous non-communicable diseases, directly impeding progress toward SDG 3. While official causes of death are listed as heart disease, stroke, or cancer, exposure to airborne toxins is a frequent root cause.
Particulate Matter (PM2.5) and Chronic Disease
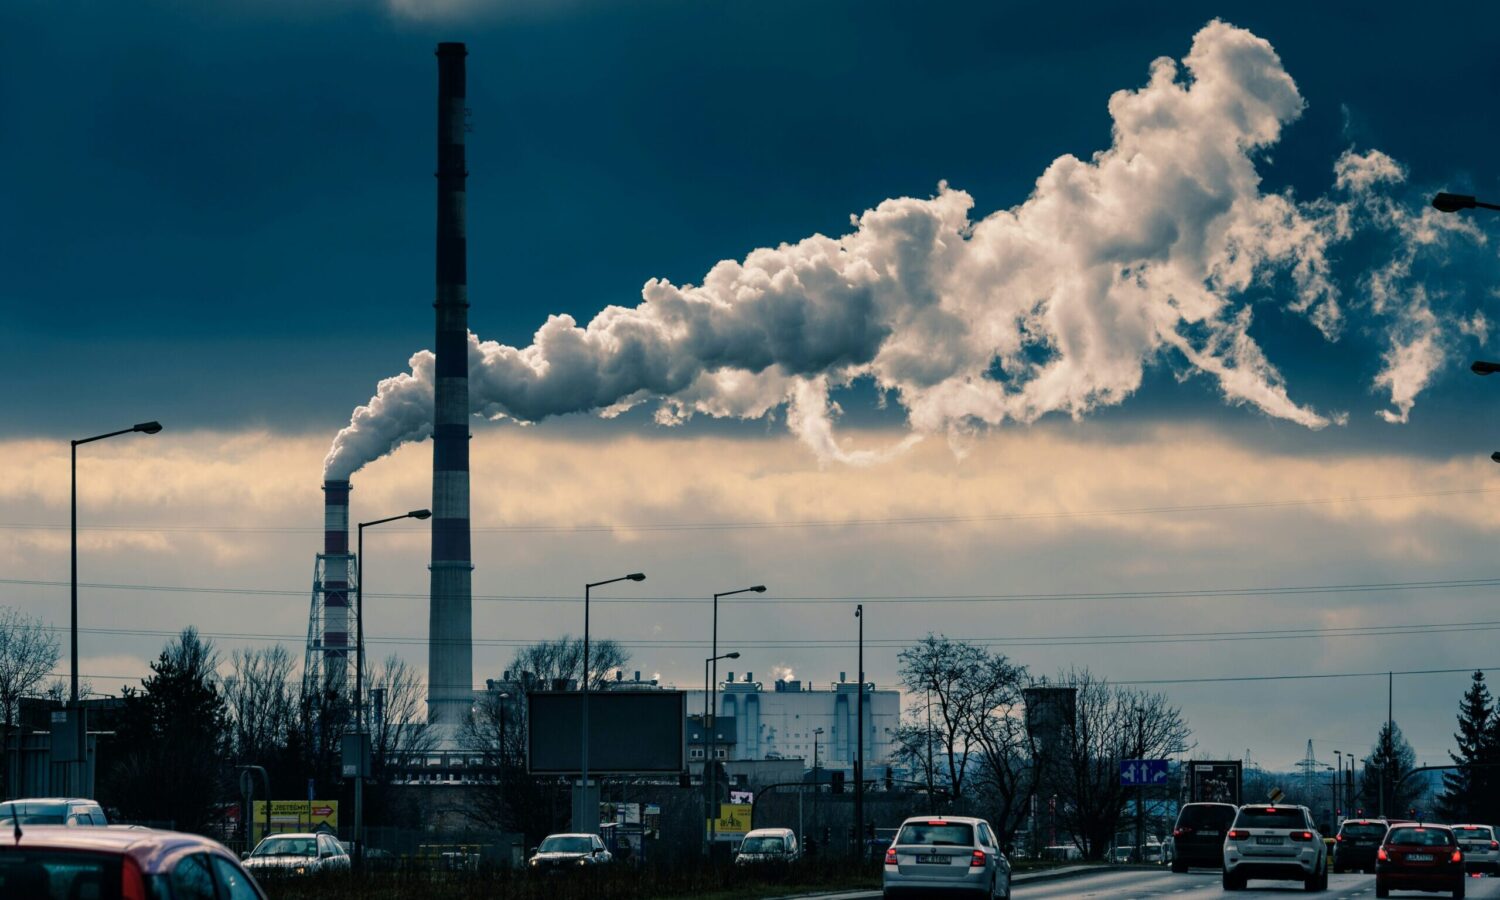
- Pollution from sources such as vehicle emissions, coal-powered plants, and natural gas heating contains hazardous Particulate Matter 2.5 (PM2.5). These fine particles can penetrate deep into the body, driving severe health impacts.
- Research indicates a direct correlation between PM2.5 exposure and increased health risks. For example, a study found that for every 10-microgram increase in PM2.5 exposure, the risk of dementia rises by 17%.
- For individuals with pre-existing conditions, poor air quality can exacerbate symptoms. Research demonstrated a 41% decrease in pediatric asthma-related emergency hospital visits in the month following the closure of a fossil fuel-emitting plant, highlighting the immediate public health benefits of reducing pollution.
Monitoring and Data Challenges in Achieving Sustainable Urban Environments (SDG 11)
Protecting populations from air pollution requires accurate and accessible data, a key component of building sustainable and resilient cities as outlined in SDG 11. However, the current landscape of Air Quality Indices (AQIs) is complex and often inconsistent.
Inconsistencies in Air Quality Indices
Different organizations, including the U.S. Environmental Protection Agency (EPA), AccuWeather, and PurpleAir, provide AQI readings that frequently diverge. This is due to varying data sources, biases, and assumptions in their models. The complexity of atmospheric science, including the unpredictable nature of wind and temperature, makes forecasting more uncertain than standard weather prediction.
Technological and Logistical Barriers
- Official Monitoring Stations: The EPA’s AirNow service relies on highly accurate, “gold-standard” monitoring stations. However, these stations are expensive to build and maintain, resulting in sparse coverage that often misses localized pollution events and fails to adequately serve less populated or lower-income communities, raising concerns related to SDG 10 (Reduced Inequalities).
- Crowdsourced Sensor Networks: Services like PurpleAir supplement official data with networks of privately-owned sensors, offering valuable real-time, hyperlocal information. However, the quality of these lower-cost sensors can degrade over time, and their placement and maintenance lack standardization. Furthermore, research indicates these networks are less common in lower-income communities, creating data gaps.
Contributing Factors and Links to Climate Action (SDG 13 & SDG 7)
The sources of air pollution are intrinsically linked to broader environmental challenges targeted by the SDGs. Emissions from vehicles, coal-fueled power plants, and natural gas are major contributors to poor air quality and are also primary drivers of climate change. Addressing these sources is fundamental to achieving both SDG 7 (Affordable and Clean Energy) and SDG 13 (Climate Action). The increasing intensity of wildfires, a consequence of climate change, further exacerbates air pollution, creating a harmful feedback loop.
Recommendations for Public Action and Individual Mitigation Strategies
A comprehensive approach is necessary for individuals to assess personal risk and reduce exposure, thereby supporting personal health outcomes aligned with SDG 3.
A Multi-faceted Approach to Information Gathering
- Monitor Regional Events: Subscribe to official alerts, such as the EPA’s AirNow EnviroFlash emails, to stay informed about large-scale pollution events like wildfire smoke.
- Consult Local Sensors: Check hyperlocal, real-time sensor maps from services like PurpleAir or IQAir for localized conditions before outdoor activities.
- Observe Environmental Patterns: Recognize pollution patterns related to traffic, weather (e.g., sunny afternoons, morning heating), and geography to make informed decisions.
- Use Hourly Forecasts: Refer to hourly AQI forecasts for short-term planning but verify with real-time data as conditions can change rapidly.
- Aim for Reduced Average Exposure: Focus on lowering cumulative long-term exposure, as consistent exposure to even low levels of pollution poses significant chronic health risks.
Personal Exposure Reduction and Indoor Air Quality Management
Given that individuals spend approximately 90% of their time indoors, managing indoor air quality is a critical and controllable mitigation strategy.
- Utilize indoor air purifiers in homes and vehicles to filter out harmful particulates.
- Transition from gas stoves, which emit carcinogens like benzene, to electric alternatives to reduce a primary source of indoor pollution.
- Wear a mask in environments with predictably high pollution levels, such as subway systems.
Analysis of Sustainable Development Goals in the Article
1. Which SDGs are addressed or connected to the issues highlighted in the article?
-
SDG 3: Good Health and Well-being
The article extensively discusses the severe health consequences of air pollution. It states that outdoor air pollution is “the most harmful type based on current evidence causing millions of deaths per year.” It links pollution to specific diseases such as heart disease, stroke, cancer, dementia, and asthma, directly connecting environmental quality to human health and well-being.
-
SDG 11: Sustainable Cities and Communities
The article highlights the disparity in air quality between rural, suburban, and urban areas, using the example of a commute from Waccabuc to Manhattan. It identifies key sources of urban pollution like “vehicle emissions, coal-fueled power plants, and natural gas used to heat buildings.” The focus on monitoring air quality within cities using tools like the Air Quality Index (AQI) and various sensor networks (EPA, PurpleAir) directly relates to managing the environmental impact of urban centers.
-
SDG 13: Climate Action
A direct connection to climate change is made when the article mentions “intensifying wildfires” as a source of harmful airborne particles. Wildfires are a well-documented consequence of climate change, and their impact on regional air quality is a significant theme, linking climate-related hazards to public health.
-
SDG 10: Reduced Inequalities
The article touches upon inequality by pointing out that crowdsourced air quality monitoring networks, such as PurpleAir, “rarely include lower-income communities.” This highlights a disparity in access to crucial environmental information, which can lead to unequal health outcomes and a lack of environmental justice for marginalized populations.
2. What specific targets under those SDGs can be identified based on the article’s content?
-
Target 3.9: Substantially reduce deaths and illnesses from pollution
This target aims to “by 2030, substantially reduce the number of deaths and illnesses from hazardous chemicals and air, water and soil pollution and contamination.” The article’s central theme is the health burden of air pollution, citing “millions of deaths per year” and detailing illnesses like asthma, dementia, and heart disease caused by pollutants like PM2.5. The entire discussion on monitoring and reducing exposure serves this target.
-
Target 11.6: Reduce the environmental impact of cities
This target is to “by 2030, reduce the adverse per capita environmental impact of cities, including by paying special attention to air quality.” The article’s focus on measuring urban air pollution through various AQIs, identifying urban pollution sources (traffic, heating), and providing guidance for citizens to manage their exposure in urban environments directly aligns with the goal of managing and improving city air quality.
-
Target 13.1: Strengthen resilience to climate-related hazards
This target is to “strengthen resilience and adaptive capacity to climate-related hazards and natural disasters in all countries.” The mention of “intensifying wildfires” as a major source of air pollution connects directly to this target. Monitoring air quality from wildfire smoke, as discussed with tools like AirNow, is a form of building adaptive capacity to a climate-related hazard that directly impacts human health.
3. Are there any indicators mentioned or implied in the article that can be used to measure progress towards the identified targets?
-
Indicator for Target 3.9: Mortality rate from air pollution
The article directly references the metric for indicator 3.9.1 (“Mortality rate attributed to household and ambient air pollution”) by stating that outdoor air pollution causes “millions of deaths per year.” Additionally, it provides a proxy for illness reduction by noting a “41% drop” in emergency hospital visits for pediatric asthma after a polluting plant closed, which measures changes in illness rates linked to air quality improvements.
-
Indicator for Target 11.6: Annual mean levels of fine particulate matter (PM2.5)
The article is centered around indicator 11.6.2 (“Annual mean levels of fine particulate matter (e.g. PM2.5 and PM10) in cities”). It repeatedly mentions “particulate matter 2.5” (PM2.5) as a key dangerous pollutant. It discusses specific concentration levels and thresholds used by the EPA (9 micrograms for annual average) and WHO (5 micrograms for annual average) to define safe air, which are the exact metrics used for this indicator.
4. SDGs, Targets, and Indicators Table
| SDGs | Targets | Indicators |
|---|---|---|
| SDG 3: Good Health and Well-being | Target 3.9: By 2030, substantially reduce the number of deaths and illnesses from hazardous chemicals and air, water and soil pollution and contamination. | Indicator 3.9.1: Mortality rate attributed to household and ambient air pollution (mentioned as “millions of deaths per year”). Also, reduction in hospital visits for respiratory illnesses like asthma. |
| SDG 11: Sustainable Cities and Communities | Target 11.6: By 2030, reduce the adverse per capita environmental impact of cities, including by paying special attention to air quality. | Indicator 11.6.2: Annual mean levels of fine particulate matter (PM2.5) in cities (the article discusses PM2.5 levels, AQI, and specific thresholds from the EPA and WHO). |
| SDG 13: Climate Action | Target 13.1: Strengthen resilience and adaptive capacity to climate-related hazards and natural disasters in all countries. | The presence of air pollution from “intensifying wildfires” is an implied indicator of a climate-related hazard impacting communities. |
| SDG 10: Reduced Inequalities | Target 10.2: By 2030, empower and promote the social, economic and political inclusion of all. | The disparity in the availability of air quality sensors, which “rarely include lower-income communities,” serves as a qualitative indicator of unequal access to environmental information and protection. |
Source: time.com

What is Your Reaction?
 Like
0
Like
0
 Dislike
0
Dislike
0
 Love
0
Love
0
 Funny
0
Funny
0
 Angry
0
Angry
0
 Sad
0
Sad
0
 Wow
0
Wow
0