


Individual US Crop Inputs Post 2014 Farm Bill – farmdoc daily
Report on US Crop Production Costs and Implications for Sustainable Development Goals (SDGs)
Executive Summary
An analysis of United States crop production costs from the 2012-2013 period to 2023-2024 reveals a significant 34% increase in overall economic costs. This trend presents substantial challenges to the achievement of several Sustainable Development Goals (SDGs). The most pronounced cost escalations were observed in chemical inputs (80%) and machinery & equipment (63%). These increases threaten the economic viability of farming operations, impacting SDG 8 (Decent Work and Economic Growth), and raise critical questions about the environmental sustainability of current agricultural practices, directly relating to SDG 12 (Responsible Consumption and Production) and SDG 2 (Zero Hunger).
Methodological Framework
Data and Procedures
This report is based on per-acre economic cost data from the US Department of Agriculture, Economic Research Service (USDA, ERS) for nine principal crops: barley, corn, cotton, oats, peanuts, rice, sorghum, soybeans, and wheat. The analysis compares the combined costs for these crops across two periods: 2012-2013 and 2023-2024. Price indices for crop inputs were sourced from the USDA, National Agricultural Statistics Service (NASS) to differentiate between changes in input price versus input use.
Analysis of Input Cost Changes and SDG Linkages
Key Drivers of Cost Increases
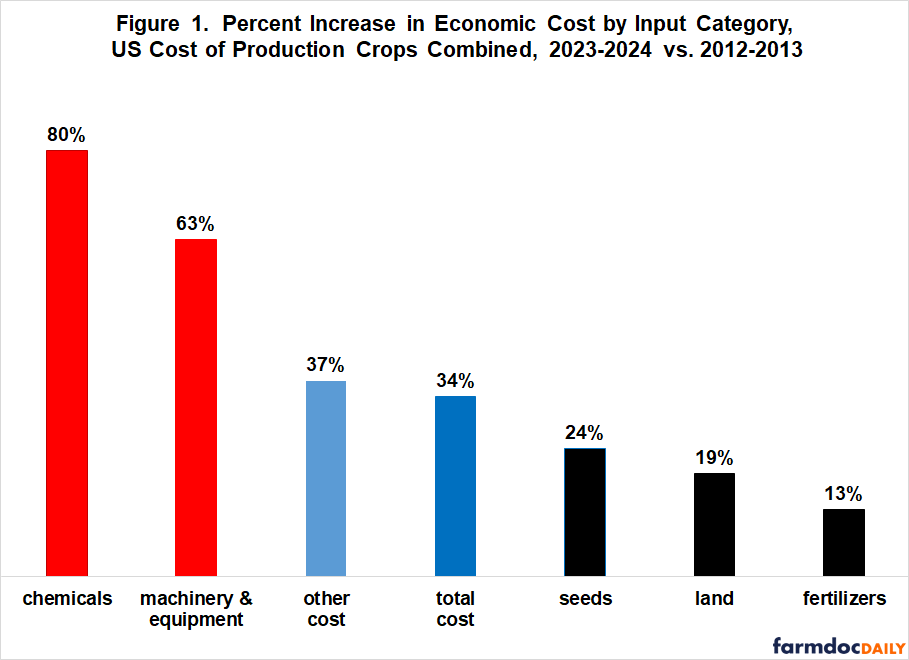
The combined cost for all inputs across the nine crops rose by 34%. However, the increases were not uniform across categories, highlighting specific areas of concern for sustainable development.
- Chemicals: 80% increase
- Machinery & Equipment: 63% increase
- Other Costs: 37% increase
- Total Costs: 34% increase
- Seeds: 24% increase
- Land: 19% increase
- Fertilizers: 13% increase
Price vs. Quantity: Implications for Sustainable Production
Chemical Inputs: A Challenge to SDG 12 and SDG 15
A stark divergence exists between the increase in chemical costs and prices. While the combined cost of chemicals rose by 80%, the corresponding price index for chemicals increased by only 19%. This disparity strongly suggests that the primary driver of higher chemical costs is a significant increase in the quantity used per acre. This trend has direct and adverse implications for several SDGs.
- SDG 12 (Responsible Consumption and Production): The escalating use of chemical inputs runs counter to the goal of achieving environmentally sound management of chemicals throughout their life cycle to minimize adverse impacts on human health and the environment.
- SDG 15 (Life on Land): Increased chemical application can degrade soil health, harm biodiversity, and negatively affect terrestrial ecosystems, undermining efforts to ensure the conservation and sustainable use of land.
- SDG 2 (Zero Hunger): While aimed at increasing yields, a growing dependency on chemical inputs can compromise the long-term ecological foundation required for sustainable food production systems.
Machinery & Equipment: A Challenge to SDG 8 and SDG 9
In contrast to chemicals, the 63% increase in machinery and equipment costs is closely aligned with the 56% increase in the price index for machinery. This indicates that rising prices, rather than increased use, are the principal factor. This economic pressure has significant consequences for sustainable agricultural development.
- SDG 8 (Decent Work and Economic Growth): Soaring machinery prices reduce farm profitability and threaten the economic sustainability of agricultural livelihoods. This pressure can hinder the ability of the agricultural sector to provide decent work and contribute to sustained economic growth.
- SDG 9 (Industry, Innovation, and Infrastructure): The high cost of essential farm equipment underscores a need for innovation in developing more affordable, efficient, and sustainable agricultural machinery. Promoting access to such technology is crucial for building resilient agricultural infrastructure.
Conclusion and Policy Considerations for Sustainable Agriculture
The analysis reveals that rising US crop production costs are driven primarily by increased chemical use and higher machinery prices. These trends pose significant obstacles to achieving a sustainable and resilient food system as envisioned by the SDGs. To align agricultural practices with global sustainability targets, policy and industry focus should be directed toward:
- Promoting Sustainable Practices: Encouraging the adoption of integrated pest management and other agroecological methods to reduce reliance on chemical inputs, thereby advancing SDG 12 and SDG 15.
- Fostering Innovation and Access: Supporting the development and accessibility of cost-effective and sustainable farm machinery to enhance farmer economic resilience (SDG 8) and promote sustainable infrastructure (SDG 9).
- Aligning Farm Policy: Ensuring that agricultural support programs incentivize sustainable production methods and do not inadvertently contribute to the inflation of input costs, which is critical for long-term food security under SDG 2.
Analysis of Sustainable Development Goals (SDGs) in the Article
1. Which SDGs are addressed or connected to the issues highlighted in the article?
-
SDG 2: Zero Hunger
This goal aims to end hunger, achieve food security, improve nutrition, and promote sustainable agriculture. The article directly relates to the “sustainable agriculture” component by analyzing the economic viability of producing nine major US crops, including corn, wheat, and soybeans. The rising cost of production inputs like chemicals and machinery directly impacts farm profitability, which is a cornerstone of a sustainable agricultural sector capable of ensuring long-term food security.
-
SDG 8: Decent Work and Economic Growth
This goal focuses on promoting sustained, inclusive, and sustainable economic growth. The article’s core theme is the economic health of the US crop production sector. It examines the 34% increase in the total cost of inputs and how this affects the net returns and economic sustainability of farming operations. The analysis of costs for machinery, labor (including unpaid family labor), and other inputs is central to understanding the economic conditions of this key sector.
-
SDG 12: Responsible Consumption and Production
This goal is about ensuring sustainable consumption and production patterns. The article provides a detailed analysis of the inputs used in agricultural production. The finding that the cost of chemicals increased by 80%, largely due to increased use rather than price, points directly to production patterns that may be unsustainable. The discussion on the rising costs and prices of machinery, fertilizers, and seeds relates to the efficient use of resources in the production cycle.
2. What specific targets under those SDGs can be identified based on the article’s content?
-
Target 2.3: Double the agricultural productivity and incomes of small-scale food producers.
While the article does not specify farm size, its focus on the rising costs of production is directly relevant to farmer incomes. The significant increases in costs for essential inputs like machinery (63%) and chemicals (80%) pose a direct threat to the profitability and net income of farming operations. Managing these costs is crucial for achieving the economic goals outlined in this target.
-
Target 2.4: Ensure sustainable food production systems and implement resilient agricultural practices.
The article implies a challenge to this target by highlighting a significant increase in the use of chemicals. It states, “…the difference is so large that use of chemicals is highly likely to have increased notably between 2012-2013 and 2023-2024.” This trend toward higher chemical dependency raises questions about the long-term sustainability of current food production systems and their environmental impact.
-
Target 12.2: Achieve the sustainable management and efficient use of natural resources.
The article’s entire analysis is a measurement of the resources (land, seed, fertilizer, chemicals, machinery) used in crop production. The differentiation between cost increases due to price versus quantity is key to assessing resource efficiency. The conclusion that increased chemical cost is due to higher use, while machinery cost is due to higher prices, provides critical information for understanding and improving the efficiency of resource management in agriculture.
3. Are there any indicators mentioned or implied in the article that can be used to measure progress towards the identified targets?
-
Per-acre economic cost of production:
The article uses “per acre economic cost to plant” for nine different crops as a primary data point. This serves as a direct indicator for monitoring the economic pressures on farmers, which is relevant to Target 2.3 (farmer incomes).
-
Percent change in cost of inputs:
The article provides specific figures for the percent increase in the cost of various inputs from 2012-2013 to 2023-2024. For example, the 80% increase in chemical costs and the 63% increase in machinery costs are quantitative indicators of changing production patterns and resource use, relevant to Target 2.4 and Target 12.2.
-
Price index of agricultural inputs:
The article uses the “annual US price index for crop input categories” to distinguish between changes in input price and input use. The comparison between the 80% increase in chemical cost and the 19% increase in the chemical price index is a powerful analytical indicator. It implies a substantial increase in the volume of chemicals used, a key metric for measuring progress toward sustainable resource management under Target 12.2.
4. Summary Table of SDGs, Targets, and Indicators
| SDGs | Targets | Indicators |
|---|---|---|
| SDG 2: Zero Hunger | 2.3: Double the agricultural productivity and incomes of small-scale food producers.
2.4: Ensure sustainable food production systems and implement resilient agricultural practices. |
|
| SDG 8: Decent Work and Economic Growth | 8.2: Achieve higher levels of economic productivity through diversification, technological upgrading and innovation. |
|
| SDG 12: Responsible Consumption and Production | 12.2: Achieve the sustainable management and efficient use of natural resources. |
|
Source: farmdocdaily.illinois.edu
What is Your Reaction?
 Like
0
Like
0
 Dislike
0
Dislike
0
 Love
0
Love
0
 Funny
0
Funny
0
 Angry
0
Angry
0
 Sad
0
Sad
0
 Wow
0
Wow
0